[
{"id":383461199041,"name":"Getting Started","type":"category","path":"/docs/getting-started","breadcrumb":"Getting Started","description":"","searchText":"getting started this section provides the fastest path to understanding how to set up and use analyticscreator. it focuses on how a data warehouse is generated, deployed, and executed based on metadata definitions. if you are new to analyticscreator, start with the quick start guide. it walks through the full workflow from repository creation to data consumption. recommended path quick start guide end-to-end implementation flow from metadata to deployed data warehouse understanding analyticscreator architecture, layers (stg, core, dm), and design principles installation and configuration system setup and environment configuration typical workflow create repository define connectors run data warehouse wizard refine model synchronize database deploy artifacts execute workflows consume data available sections installation system requirements download and installation understanding analyticscreator quick start guide"}
,{"id":383225948363,"name":"Quick Start Guide","type":"section","path":"/docs/getting-started/quick-start-guide","breadcrumb":"Getting Started › Quick Start Guide","description":"","searchText":"getting started quick start guide this quick start guide helps new and trial users understand how to set up, model, and automate a data warehouse using analyticscreator. it follows the actual execution flow of the application, from metadata definition to deployment and execution, and explains how sql-based warehouse structures are generated and processed. the guide assumes: strong sql and etl background familiarity with layered dwh design (stg, core, dm) core concept analyticscreator is a metadata-driven design application that generates sql-based data warehouse structures, transformation logic, and orchestration components. instead of manually implementing etl processes, developers define metadata, which is translated into executable database objects and pipelines. the process follows a generation-driven approach: connect to source systems import metadata (tables, columns, keys, relationships) generate a draft data warehouse model using the wizard refine transformations, keys, and historization generate and deploy sql artifacts and pipelines execute data loading and processing workflows a key architectural element is the persistent staging layer (stg): source data is stored persistently after extraction supports reprocessing without re-reading the source system decouples ingestion from transformation and historization in practice, staging is followed by a second layer where historization is applied before data is transformed into core structures (dimensions and facts). quick start flow the implementation process in analyticscreator follows a defined sequence: create repository initialize a metadata repository (sql server database) that stores all definitions of the data warehouse. create connectors define connections to source systems (e.g. sap, sql server) and enable metadata extraction. import metadata and run wizard automatically read source structures and generate a draft data warehouse model (stg, core, dm). refine the model adjust business keys, surrogate keys, relationships, historization behavior, and transformations. synchronize generate sql objects (tables, views, procedures) and materialize the structure in the target database. deploy generate and deploy deployment packages (dacpac, pipelines, semantic models). execute workflows run generated pipelines (e.g. ssis, azure data factory) to load and process data. consume data use generated data marts and semantic models in reporting tools (e.g. power bi). what this quick start covers create connectors and define relationships (foreign keys, references) import and persist source data in the stg layer understand historization and persistent staging behavior build and refine core transformations (dimensions and facts) define business keys and surrogate keys create data marts (dm layer) and calendar dimensions generate and deploy sql server, pipeline, and analytical model artifacts"}
,{"id":383985776833,"name":"Repository & Metadata Model","type":"subsection","path":"/docs/getting-started/quick-start-guide/repository-metadata-model","breadcrumb":"Getting Started › Quick Start Guide › Repository & Metadata Model","description":"","searchText":"getting started quick start guide repository & metadata model before any connector, transformation, or data warehouse object is created, analyticscreator requires a repository. the repository is a sql server database that stores the complete metadata definition of the data warehouse. all objects defined in analyticscreator—sources, transformations, keys, relationships, deployment settings, and workflows—are stored in this repository. it acts as the central control layer from which all sql code and artifacts are generated. purpose provide a persistent metadata foundation that defines the structure, logic, and behavior of the data warehouse independently of the generated sql artifacts. design principle analyticscreator follows a metadata-driven approach where the repository contains the full definition of the data warehouse model. the repository is not a runtime system; it is a design-time control layer. all generated objects (tables, views, procedures, pipelines) are derived from this metadata. once generated and deployed, these objects can run independently of analyticscreator. key principle: metadata stored in repository → sql and pipelines generated → deployed to target system inputs / outputs inputs repository name and sql server instance initial project configuration outputs sql server database containing metadata structured definitions of: connectors source objects transformations keys and relationships deployment configurations internal mechanics 1. repository creation when a new project is created, analyticscreator initializes a sql server database that serves as the repository. this database contains all metadata required to define the data warehouse. 2. metadata storage each object in analyticscreator is stored as structured metadata. this includes: source definitions (tables, columns, data types) transformation logic historization settings dependencies between objects the repository is fully accessible and can be queried or extended directly if required. 3. central control layer all design changes are written to the repository. no sql objects are created in the target system at this stage. the repository acts as the single source for: code generation deployment packaging dependency resolution 4. separation of design-time and runtime analyticscreator operates purely at design time. the repository defines what will be generated, but execution happens only after deployment in the target environment (sql server, azure, etc.). types / variants local sql server repository (development setup) shared repository (team collaboration) version-controlled repository (via acrepo / json export) example creating a new repository results in a sql server database that contains metadata tables describing the data warehouse model. conceptually: repository (sql server) ├── connectors ├── sources ├── transformations ├── keys / relationships ├── deployment config no stg, core, or dm tables exist yet in the target system. only their definitions are stored. when to use / when not to use use when starting a new data warehouse project managing metadata centrally working in a team with shared definitions do not use as a runtime system the repository does not store business data it is not queried by reporting tools performance & design considerations repository size grows with model complexity, not data volume changes in metadata trigger regeneration, not direct sql changes direct modifications in the target database can be overwritten during synchronization design trade-off: centralized metadata control vs direct sql flexibility integration with other ac features connectors: stored and managed in repository wizard: reads metadata and generates draft models synchronization: converts metadata into sql objects deployment: packages generated artifacts ci/cd: repository can be versioned and exported common pitfalls treating the repository as a data storage layer manually modifying generated sql instead of metadata ignoring repository versioning in team environments mixing multiple environments in a single repository key takeaway the repository is the central metadata store that defines the entire data warehouse and drives all code generation and deployment in analyticscreator."}
,{"id":385512338635,"name":"Synchronize (SQL Generation)","type":"subsection","path":"/docs/getting-started/quick-start-guide/synchronize-sql-generation","breadcrumb":"Getting Started › Quick Start Guide › Synchronize (SQL Generation)","description":"","searchText":"getting started quick start guide synchronize (sql generation) after the model has been refined, the next step is to synchronize the data warehouse. synchronization converts the metadata stored in the repository into physical sql objects in the target database. at this stage, analyticscreator materializes the designed warehouse structure. tables, views, and generated procedures become visible in the sql server database. this is the point where the model moves from design-time metadata to deployable database objects. purpose generate and materialize the physical database structure from the metadata model. design principle synchronization is the controlled transition from metadata definition to sql implementation. the repository remains the source of truth the target database is regenerated or updated from metadata developers do not manually create warehouse objects in the target database. instead, analyticscreator generates them consistently from the repository definitions. inputs / outputs inputs refined metadata model in the repository target database configuration naming conventions and generation settings outputs generated sql server database objects, including: stg tables persistent staging and historization tables core views and tables dm views and tables stored procedures for loading, historization, and persisting internal mechanics 1. metadata evaluation analyticscreator reads the current model definition from the repository and determines which sql objects must be created or updated. 2. object generation based on the metadata, the system generates sql artifacts such as: physical tables for staging and persistent layers views for generated transformations stored procedures for historization and persisting 3. schema materialization the generated structure is applied to the target sql server database. after synchronization, the database contains the warehouse objects defined in the model. 4. dependency-aware generation objects are generated in the required order so that dependent objects can reference upstream objects correctly. 5. re-synchronization behavior if the model changes, synchronization updates the target structure accordingly. this keeps the generated sql database aligned with the repository metadata. types / variants typical synchronized object types import tables historization tables transformation views persisted transformation tables stored procedures generation patterns view-based transformations table-based persisted layers procedure-driven loading and historization example a refined model contains: one source import table one historized customer table one fact transformation one customer dimension after synchronization, the target sql server database contains generated objects such as: stg.customer_import pst.customer_history core.vw_factsales dm.vw_dimcustomer sp_load_customer_import sp_historize_customer the model now exists as physical sql objects, but data is not yet loaded unless execution is triggered separately. when to use / when not to use use when the model has been refined and validated you want to materialize the current warehouse structure you need to inspect or test generated sql objects do not treat synchronization as execution synchronization creates structure, not loaded business data etl or pipeline execution happens later performance & design considerations synchronization affects schema, not data volume frequent changes to metadata can cause repeated structural updates manual database changes outside analyticscreator can be overwritten design trade-off: consistent generated structure vs manual database customization integration with other analyticscreator features repository: remains the source for all generated objects refinement: defines what is materialized persisting: adds generated persisted tables and procedures deployment: packages the synchronized structures for release common pitfalls assuming synchronization loads data editing generated database objects manually synchronizing before validating keys and joins forgetting that metadata, not the target database, is authoritative key takeaway synchronization materializes the metadata model as physical sql objects in the target database, but it does not execute data loading by itself."}
,{"id":385512401134,"name":"Consume Data in Data Marts and Semantic Models","type":"subsection","path":"/docs/getting-started/quick-start-guide/consume-data-in-data-marts-and-semantic-models","breadcrumb":"Getting Started › Quick Start Guide › Consume Data in Data Marts and Semantic Models","description":"","searchText":"getting started quick start guide consume data in data marts and semantic models after workflows have been executed, the data warehouse is populated and ready for consumption. the final step is to access the processed data through data marts and semantic models. analyticscreator generates structures that are optimized for analytical consumption. these include dimensional models and semantic layers that can be directly used by reporting and bi tools. purpose provide structured, query-ready data for analytical tools and reporting use cases. design principle analyticscreator separates data processing from data consumption. stg and core layers handle ingestion and transformation dm and semantic models provide consumption-ready structures consumers should not access staging or intermediate layers directly. inputs / outputs inputs processed core structures generated dm layer (facts and dimensions) deployed semantic model outputs queryable data marts semantic models with defined relationships and measures data available for reporting tools (e.g. power bi) internal mechanics 1. dm layer exposure the dm layer contains consumption-ready structures such as fact and dimension tables or views. these are generated based on the core transformations and are optimized for analytical queries. 2. semantic model generation analyticscreator can generate a semantic model that defines: relationships between facts and dimensions measures and calculated fields hierarchies and aggregation logic 3. data access reporting tools connect to the semantic model or directly to the dm layer. typical access patterns include: directquery or import into bi tools connection to tabular models 4. refresh behavior after workflow execution, the semantic model can be refreshed to reflect updated data. this ensures consistency between the data warehouse and reporting layer. types / variants consumption layers dm tables or views tabular models external bi tool connections access patterns direct query on dm layer semantic model (recommended) hybrid approaches example after execution, the following structures are available: dm.factsales dm.dimcustomer dm.dimproduct a semantic model defines relationships between these tables and exposes measures such as: totalsales = sum(factsales.amount) a reporting tool connects to this model and visualizes sales by customer, product, and time. when to use / when not to use use when data warehouse has been executed and populated users require analytical access to data reporting or dashboarding is required do not use lower layers when accessing stg or core directly for reporting building reports on non-finalized structures performance & design considerations dm layer should be optimized for query performance semantic models reduce complexity for end users pre-aggregations can improve performance for large datasets direct access to core can negatively impact performance and consistency design trade-off: direct access offers flexibility semantic models provide consistency and usability integration with other analyticscreator features core transformations: provide input for dm layer deployment: creates semantic models execution: ensures data is up to date macros and transformations: influence calculated fields and measures common pitfalls querying stg or core layers directly ignoring semantic model design missing refresh after data load overloading dm layer with unnecessary complexity key takeaway the dm layer and semantic model provide consumption-ready data for reporting tools and should be the primary access point for analytical workloads."}
,{"id":385512401131,"name":"Deploy","type":"subsection","path":"/docs/getting-started/quick-start-guide/deploy","breadcrumb":"Getting Started › Quick Start Guide › Deploy","description":"","searchText":"getting started quick start guide deploy after synchronization, the data warehouse structure exists in the target database. the next step is deployment, where analyticscreator generates and distributes deployment artifacts to the selected environment. deployment packages the generated database objects together with orchestration components such as pipelines and analytical models. this allows the data warehouse to be executed and used in a target environment such as sql server, azure or fabric. purpose package and deploy generated database structures, pipelines, and analytical models to a target environment. design principle deployment separates structure generation from environment distribution. synchronization creates the structure deployment distributes and activates it in a target system all deployment artifacts are generated from metadata and can be recreated at any time. inputs / outputs inputs synchronized data warehouse model deployment configuration (target server, database, credentials) selected components (database objects, pipelines, semantic models) outputs deployment package containing: sql scripts or dacpac ssis packages or azure data factory pipelines analytical models (e.g. tabular model for power bi) deployed artifacts in the target environment internal mechanics 1. deployment package creation analyticscreator generates a deployment package that contains all required components for the data warehouse. this includes database objects, pipeline definitions, and optional analytical models. 2. target configuration deployment settings define where the artifacts will be deployed. this includes: sql server or azure environment database name authentication details 3. database deployment the generated database structure is applied to the target system. this may include: creating or updating schemas deploying tables, views, and procedures 4. pipeline generation analyticscreator automatically generates orchestration components: ssis packages for on-premise environments azure data factory pipelines for cloud environments fabric data factory pipelines these pipelines define how data is extracted, transformed, and loaded. 5. analytical model generation if configured, a semantic model is generated and deployed. this includes: dimensions and measures relationships between tables compatibility with reporting tools such as power bi 6. deployment logging the deployment process produces logs that show which objects and components were created or updated. types / variants deployment targets on-premise sql server azure sql database azure synapse or fabric environments pipeline variants ssis packages azure data factory pipelines analytical outputs tabular models for power bi power bi project other supported analytical engines example a deployment is configured with: target sql server database ssis package generation enabled tabular model generation enabled after deployment: database objects are created in the target database ssis packages are generated and available in a visual studio project a tabular model is deployed and available for power bi at this stage, the system is fully deployed but not yet populated with data. when to use / when not to use use when the model is finalized and synchronized you want to move the data warehouse to a target environment pipelines and analytical models need to be generated do not assume deployment loads data deployment creates structure and pipelines data loading requires execution of pipelines performance & design considerations deployment time depends on model size and number of objects pipeline generation adds orchestration complexity but reduces manual work repeated deployments should be controlled via versioning design trade-off: automated deployment vs manual control of environment-specific configurations integration with other analyticscreator features synchronization: provides the generated structure workflows: define execution order within pipelines ci/cd: deployment packages can be integrated into pipelines repository: remains the source for regeneration common pitfalls deploying without validating the model incorrect connection configuration assuming deployment includes data loading not selecting required pipeline or model components key takeaway deployment packages and distributes the generated data warehouse structure, pipelines, and analytical models to a target environment, but does not execute data loading."}
,{"id":385512338634,"name":"Run Data Warehouse Wizard","type":"subsection","path":"/docs/getting-started/quick-start-guide/run-data-warehouse-wizard","breadcrumb":"Getting Started › Quick Start Guide › Run Data Warehouse Wizard","description":"","searchText":"getting started quick start guide run data warehouse wizard after connectors and metadata are available in the repository, the next step is to generate a draft data warehouse model using the analyticscreator wizard. this is the central step where the system translates metadata into a structured warehouse design. the wizard analyzes imported metadata and automatically creates a full model including staging, historization, and transformation layers. this provides a working baseline that can be refined instead of built manually from scratch. purpose generate a complete draft data warehouse model based on imported metadata, including stg, core, and dm structures. design principle analyticscreator follows a generation-first approach: the full data warehouse model is generated automatically from metadata developers refine and adjust the generated model instead of building it manually the wizard uses structural metadata such as tables, keys, and relationships to infer joins, dimensions, and fact structures. inputs / outputs inputs imported metadata from connectors selected source tables modeling approach (e.g. data vault, dimensional, mixed) optional configuration (naming conventions, defaults) outputs generated data warehouse model including: stg layer (import structures) persistent staging and historization structures core layer (dimensions and facts) dm layer (analytical structures) predefined joins and relationships initial transformation logic internal mechanics 1. metadata analysis the wizard reads all metadata stored in the repository, including tables, columns, and relationships. based on this, it determines how objects are related. 2. model generation analyticscreator generates a complete data warehouse structure. this includes: import tables in the stg layer persistent staging structures with historization core transformations for dimensions and facts dm structures for analytical consumption 3. relationship inference joins between tables are derived automatically based on source relationships. these joins are used to construct fact and dimension transformations. 4. default logic generation the wizard can apply default behaviors such as: including directly and indirectly related tables in facts creating standard transformations generating calendar dimensions 5. visual model creation the result is a fully structured data warehouse diagram that shows all layers and dependencies. at this stage, the model is defined but not yet deployed. types / variants modeling approaches data vault model (hubs, links, satellites) dimensional model (facts and dimensions) mixed approach (data vault foundation with dimensional output) configuration options naming conventions (prefixes, suffixes) default transformations inclusion rules for related tables example a set of source tables is selected: customer orders orderlines products after running the wizard: stg tables are created for each source relationships are detected automatically a fact table is generated based on transaction data dimensions are generated for related entities the resulting model already contains joins, transformation paths, and structural dependencies. when to use / when not to use use when starting a new data warehouse model rapidly generating a baseline structure working with well-defined source metadata do not rely on defaults when business logic is complex or non-standard source relationships are incomplete or incorrect fact and dimension definitions require domain-specific adjustments performance & design considerations the wizard accelerates initial modeling but does not replace design decisions generated joins should be reviewed for correctness and performance fact table scope depends on inclusion settings (direct vs indirect relationships) design trade-off: full automation provides speed manual refinement ensures correctness and performance integration with other analyticscreator features repository: provides metadata input for the wizard transformations: generated and refined after wizard execution synchronization: converts generated model into sql objects deployment: packages generated artifacts common pitfalls assuming the generated model is production-ready without review over-including tables leading to overly complex fact structures ignoring incorrect or missing source relationships not validating generated joins key takeaway the wizard generates a complete data warehouse model from metadata, which is then refined and deployed rather than built manually."}
,{"id":385512401101,"name":"Create Connectors","type":"subsection","path":"/docs/getting-started/quick-start-guide/create-connectors","breadcrumb":"Getting Started › Quick Start Guide › Create Connectors","description":"","searchText":"getting started quick start guide create connectors after initializing the repository, the next step is to define connectors to source systems. connectors provide the technical and structural foundation for importing metadata and generating the data warehouse model. a connector defines how analyticscreator accesses a source system and how metadata (tables, columns, keys, relationships) is retrieved. this metadata is then stored in the repository and used by the data warehouse wizard to generate a draft model. purpose establish access to source systems and import structural metadata required for automated data warehouse generation. design principle analyticscreator separates metadata acquisition from data extraction. metadata (structure) is imported first and stored in the repository data extraction happens later during execution (via pipelines) this means a data warehouse model can be designed and generated without requiring an active connection to the source system at runtime. inputs / outputs inputs connector type (e.g. sql server, sap, metadata connector) connection configuration (server, database, authentication) selected schemas, tables, or metadata source outputs connector definition stored in repository imported metadata: tables and views columns and data types primary keys foreign keys or references (if available) internal mechanics 1. connector definition the connector stores the configuration required to access a source system. this includes connection details and selection of relevant schemas or objects. 2. metadata extraction analyticscreator reads structural metadata from the source system or from a metadata connector. this includes: table structures column definitions key definitions relationships between tables in some cases (e.g. sap or metadata connectors), metadata can be imported without direct access to the operational system. 3. repository persistence all imported metadata is stored in the repository. at this stage: no sql objects are generated no data is extracted no pipelines are executed the system builds a structural model that will later drive code generation. 4. relationship availability if source systems expose foreign keys or references, these are imported and can be reused during modeling. if not, relationships must be defined manually in later steps. types / variants connector types direct database connectors (e.g. sql server) erp connectors (e.g. sap metadata extraction) metadata connectors (predefined structures without live connection) import modes full metadata import selective table import manual definition (if metadata is incomplete) example a connector is created for a sql server database containing the following tables: customer orders orderlines the system imports: column definitions (e.g. customerid, orderid) primary keys foreign key relationships (e.g. orders → customer) these definitions are stored in the repository and become available for automated model generation in the next step. when to use / when not to use use when starting a new data warehouse model importing metadata from source systems preparing for automated model generation do not rely on connectors alone when source metadata is incomplete or inconsistent business relationships differ from technical relationships required structures are not exposed in the source system performance & design considerations connector scope directly affects model complexity importing unnecessary tables increases modeling overhead metadata quality determines quality of generated model design trade-off: broad import (high coverage, more noise) selective import (cleaner model, more manual work later) integration with other analyticscreator features repository: stores connector and metadata definitions wizard: uses imported metadata to generate draft model stg generation: based on imported source structures transformations: reuse source metadata and relationships common pitfalls importing entire source systems without filtering assuming source relationships are suitable for analytical models using technical keys as business keys without validation skipping metadata validation before running the wizard key takeaway connectors import and persist source metadata in the repository, forming the structural basis for automated data warehouse generation."}
,{"id":385512401133,"name":"Execute Workflows (Load Data)","type":"subsection","path":"/docs/getting-started/quick-start-guide/execute-workflows-load-data","breadcrumb":"Getting Started › Quick Start Guide › Execute Workflows (Load Data)","description":"","searchText":"getting started quick start guide execute workflows (load data) after deployment, the data warehouse structure, pipelines, and analytical models exist in the target environment, but no business data has been loaded yet. the next step is to execute the generated workflows. workflow execution runs the generated load processes in the correct order. this is the stage where source data is extracted, written to staging, historized where required, transformed into core structures, and exposed through data marts and analytical models. purpose execute the generated loading and processing workflows so that the deployed data warehouse is populated with data. design principle analyticscreator separates execution from generation. generation defines structure and logic execution runs the actual data movement and processing this separation makes it possible to validate and deploy a model before loading any business data. inputs / outputs inputs deployed database objects generated workflows or pipeline packages configured source connections and linked services execution parameters and scheduling context outputs loaded stg tables historized persistent staging tables processed core structures updated dm structures refreshed analytical model content internal mechanics 1. workflow start execution begins by starting the generated workflow package or pipeline. this acts as the orchestration entry point for the full load process. 2. source extraction data is read from the configured source systems and written into the stg layer. import mappings, filters, and variables defined in the model are applied during this step. 3. persistent staging and historization after import, the data is written into the persistent staging layer. if historization is enabled, valid-from and valid-to handling or other configured historization logic is executed here. 4. core processing generated transformations are processed in dependency order. facts, dimensions, and other core structures are built from the persisted source data. 5. dm and semantic model refresh after core processing, the dm layer and the generated semantic model can be refreshed so that reporting tools can consume the updated data. 6. dependency handling the execution order is controlled by the generated workflow logic. upstream objects are processed before downstream objects so that dependencies are resolved automatically. types / variants execution variants ssis-based execution azure data factory pipeline execution manual execution for testing scheduled execution in production loading patterns full load incremental load historized load example a deployed workflow package contains the following sequence: load source table into stg.customer_import apply historization into pst.customer_history refresh fact and dimension transformations refresh the semantic model used by power bi at the end of execution: source data is available in staging historical versions are stored where configured reporting tools can access current analytical data when to use / when not to use use when the deployment has completed successfully source connections are configured correctly you want to populate or refresh the data warehouse do not execute before validating linked services and source access reviewing load filters and parameters confirming that required objects have been deployed performance & design considerations execution time depends on data volume, transformation complexity, and load pattern persistent staging supports reprocessing without re-reading source systems incremental loading reduces runtime but requires correct filter logic historization increases write volume and storage requirements design trade-off: full reloads are simpler to validate incremental and historized loads scale better but require stricter design control integration with other analyticscreator features connectors: provide source access used during execution stg and historization: form the first processing layers workflows: define orchestration and dependency order deployment: provides the executable packages and pipelines semantic models: can be refreshed after successful load common pitfalls assuming deployment already loaded data running workflows without validating linked services using incorrect filter logic for incremental loads ignoring dependency order in manually triggered runs confusing source staging with final analytical output key takeaway workflow execution is the step where deployed structures are populated with data and processed into usable analytical output."}
,{"id":385512401114,"name":"Refine the Model","type":"subsection","path":"/docs/getting-started/quick-start-guide/refine-the-model","breadcrumb":"Getting Started › Quick Start Guide › Refine the Model","description":"","searchText":"getting started quick start guide refine the model after generating the draft model with the wizard, the next step is to refine and adjust the data warehouse structure. the generated model provides a complete baseline, but it must be validated and adapted to match business logic, data quality, and performance requirements. this step focuses on defining keys, adjusting transformations, handling historization, and ensuring that the generated joins and structures reflect the intended analytical model. purpose validate and adjust the generated data warehouse model to ensure correct business logic, data relationships, and performance behavior. design principle analyticscreator generates a structurally complete model, but correctness is achieved through refinement. automation provides the structure manual refinement ensures semantic accuracy developers work on metadata definitions, not directly on sql, and all changes are reflected in generated code during synchronization. inputs / outputs inputs generated draft model (stg, core, dm) source metadata and relationships business requirements and logic outputs refined transformations defined business keys and surrogate keys adjusted joins and relationships configured historization behavior internal mechanics 1. column selection and cleanup generated transformations often include all available columns. unnecessary attributes should be removed to reduce model complexity and improve performance. 2. business key definition business keys must be validated or defined explicitly. these keys determine: uniqueness of entities join conditions between tables basis for historization 3. surrogate key generation analyticscreator generates surrogate keys automatically. depending on the modeling approach: identity-based keys (e.g. integer) hash-based keys (for data vault or hybrid models) hash keys are typically generated in the staging layer as calculated and persisted columns. 4. relationship validation automatically generated joins should be reviewed. this includes: correct join paths cardinality assumptions inclusion of required tables 5. historization configuration historization is applied in persistent staging and core layers. typical behavior includes: valid-from and valid-to columns tracking changes over time the historization strategy should be verified for correctness and performance impact. 6. macro usage reusable sql logic is implemented using macros. for example: hash key generation standard transformations macros allow centralized control of repeated logic without modifying generated sql directly. 7. dimension and fact adjustments fact tables and dimensions generated by the wizard should be refined: remove unnecessary joins add required attributes ensure correct grain of fact tables 8. calendar and date handling date columns should typically be replaced by references to a calendar dimension. this is often done using predefined macros. types / variants key strategies business keys only surrogate keys (identity) hash-based keys historization strategies scd2 (valid-from / valid-to) snapshot-based access current-state only transformation styles fully generated adjusted via metadata extended with custom sql logic example a generated fact table includes all columns from multiple related tables. refinement steps: remove unnecessary attributes validate join between orders and customers define surrogate key for dimension tables replace date columns with calendar dimension references example adjustment: -- before refinement select * from stg_orders o join stg_customer c on o.customer_id = c.customer_id; -- after refinement (conceptual) select o.order_id, c.customer_key, o.order_date_key, o.amount from core_orders o join dim_customer c on o.customer_key = c.customer_key; when to use / when not to use use when after running the wizard validating generated model structures aligning model with business logic do not skip when working with complex source systems data quality issues exist performance requirements are strict performance & design considerations reducing column count improves performance incorrect joins can cause data duplication historization increases storage and processing cost hash keys improve scalability but add computation overhead design trade-off: automation speed vs model accuracy flexibility vs standardization integration with other analyticscreator features wizard: provides initial model macros: define reusable sql logic synchronization: generates sql from refined metadata deployment: uses finalized model for artifact creation common pitfalls leaving generated joins unvalidated using incorrect business keys overloading fact tables with unnecessary attributes ignoring historization impact on performance mixing business logic directly into sql instead of metadata key takeaway the generated model must be refined to ensure correct business logic, keys, and performance before sql generation and deployment."}
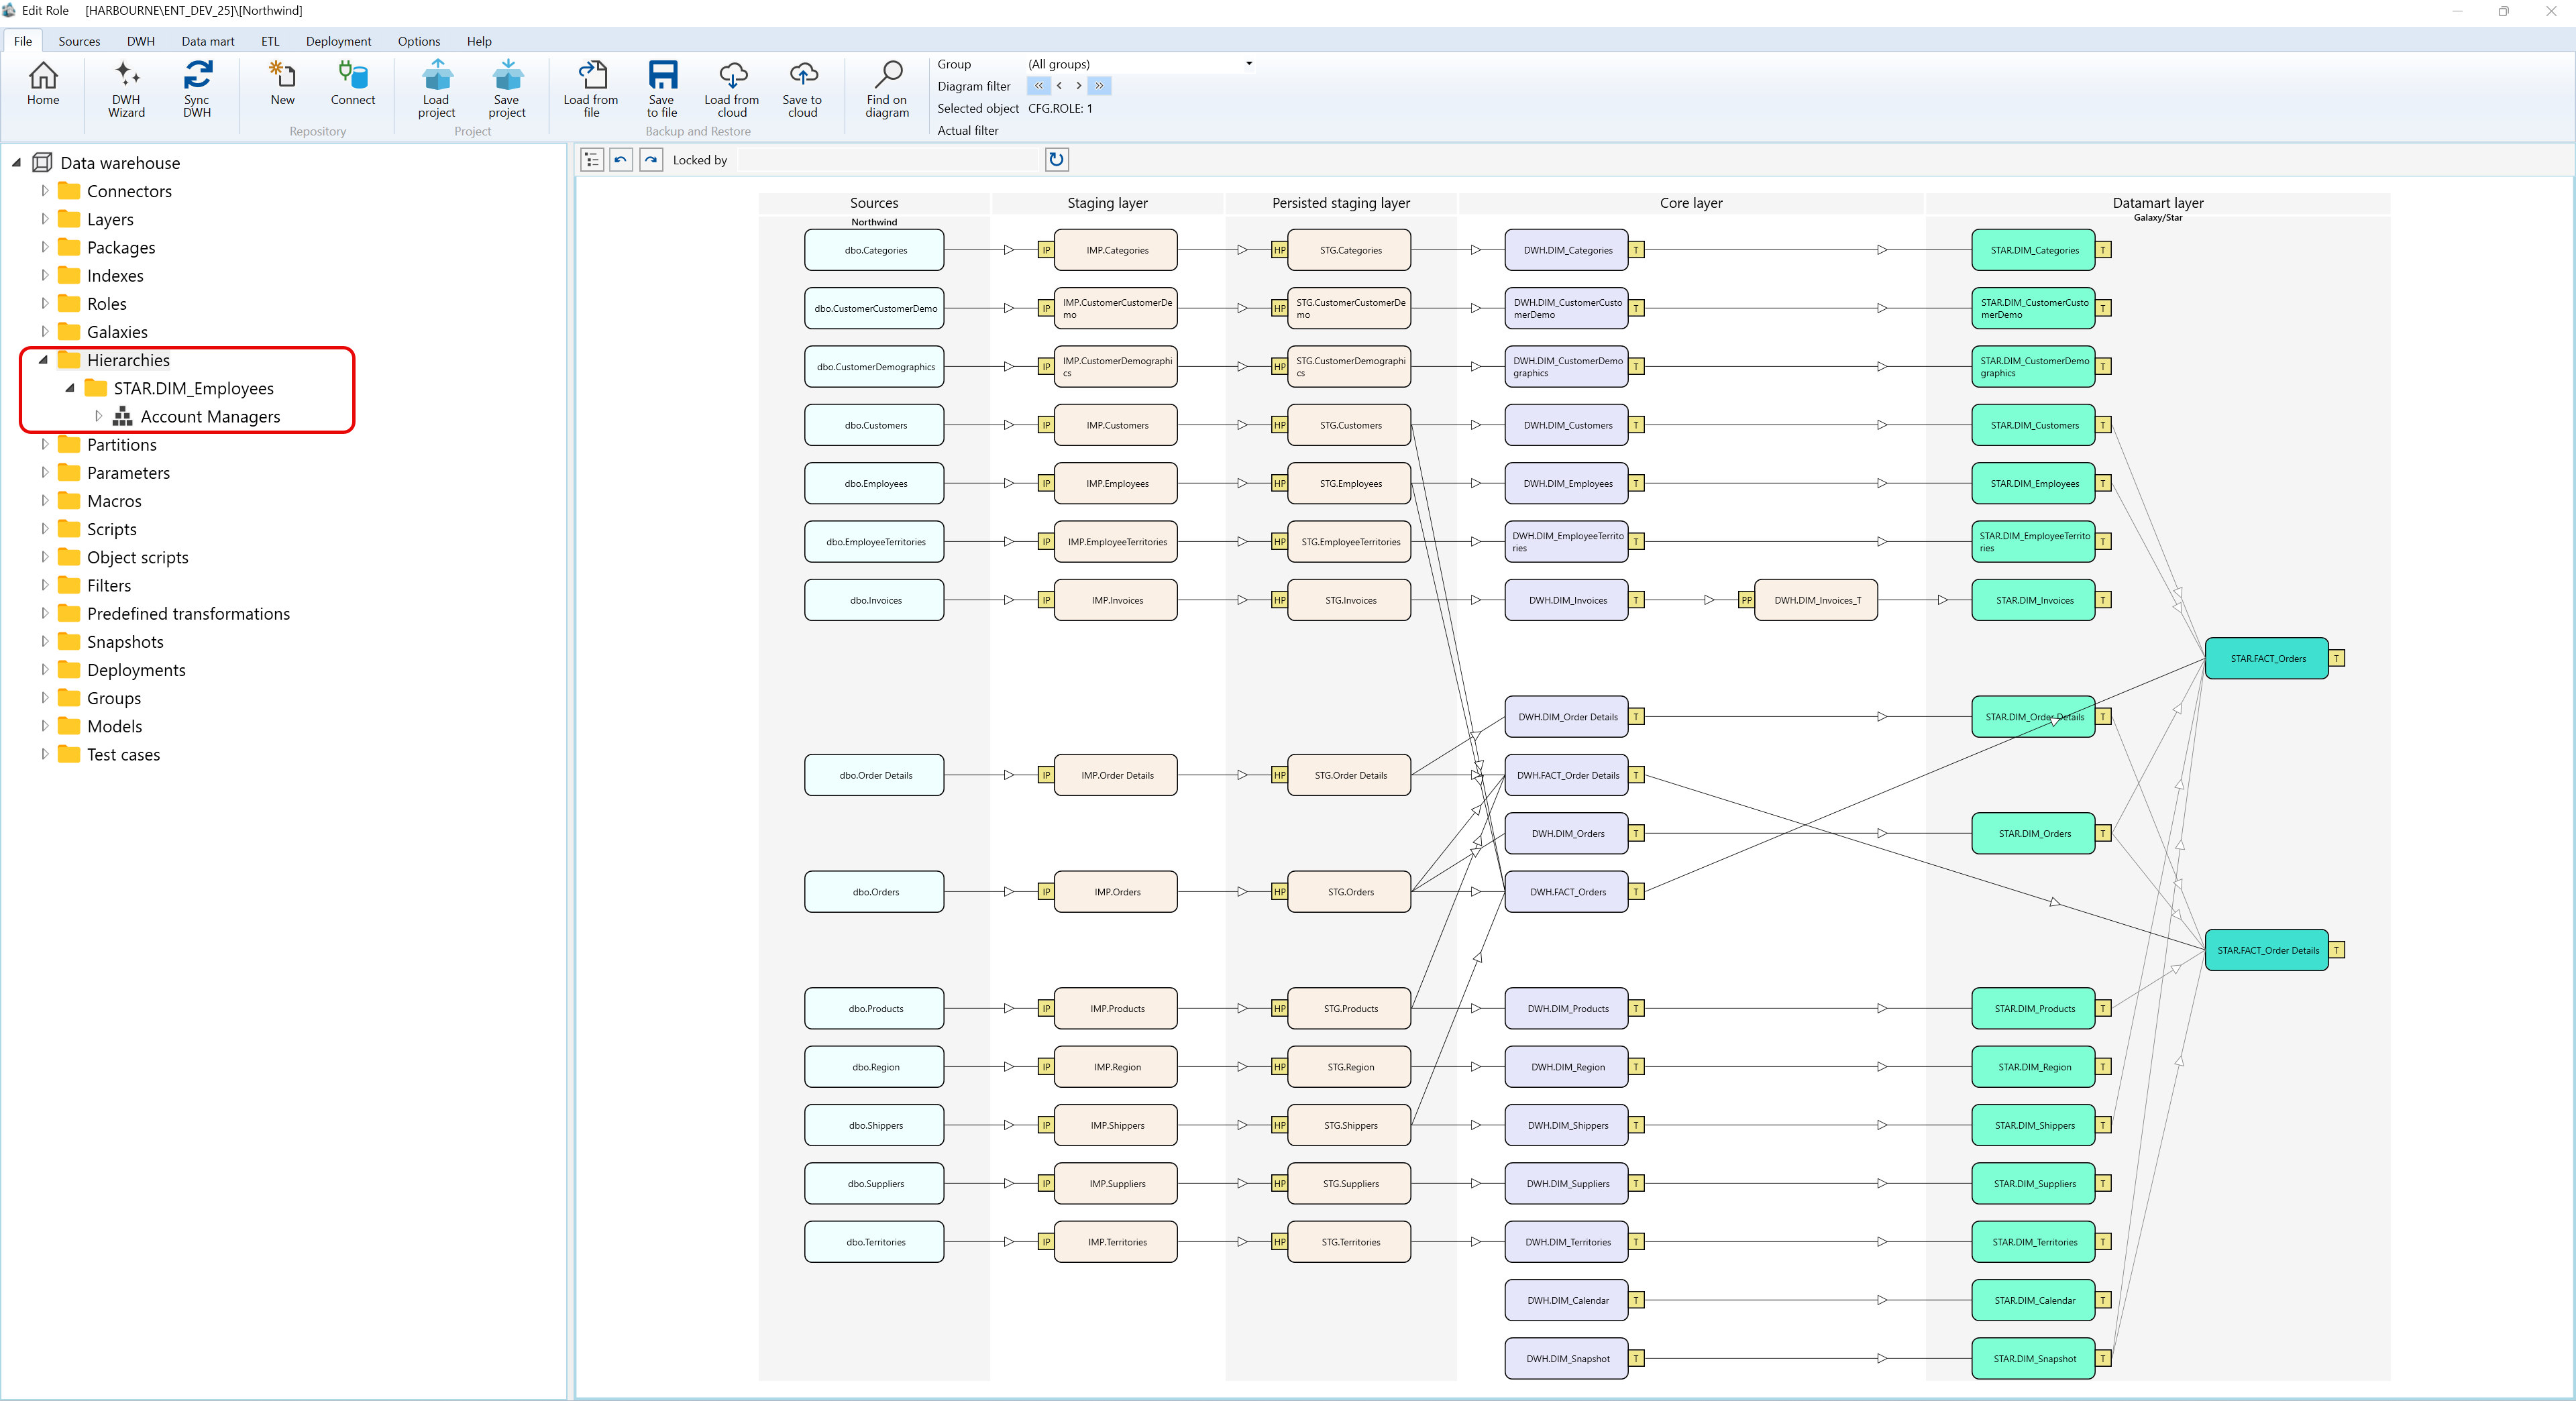
,{"id":383225948362,"name":"Understanding AnalyticsCreator","type":"section","path":"/docs/getting-started/understanding-analytics-creator","breadcrumb":"Getting Started › Understanding AnalyticsCreator","description":"","searchText":"getting started understanding analyticscreator analyticscreator is a metadata-driven design application for building and automating data warehouses and analytical models. instead of manually implementing etl and sql logic, developers define metadata such as sources, keys, relationships, transformations, and loading behavior. analyticscreator uses these definitions to generate database objects, pipelines, and semantic models. how analyticscreator works the workflow in analyticscreator starts with a repository, continues with source metadata import, and then uses a wizard to generate a draft data warehouse model. that model is refined, synchronized into sql objects, deployed to the target environment, and finally executed through generated workflows or pipelines. create a repository define or import connectors import source metadata run the data warehouse wizard refine the generated model synchronize the structure deploy artifacts execute workflows consume data through data marts and semantic models repository and metadata every analyticscreator project is based on a repository. the repository is a sql server database that stores the full metadata definition of the data warehouse. this includes connectors, source objects, transformations, keys, relationships, deployment settings, and other object definitions. the repository is the design-time control layer and the source for all generated artifacts. this means the target database is not modeled manually. instead, analyticscreator reads the repository metadata and generates the required sql structures from it. generated code can run independently after deployment because analyticscreator is used as a design-time application, not as a runtime dependency. connectors and metadata import analyticscreator connects to source systems such as sql server or sap and imports structural metadata including tables, columns, keys, and references. in some scenarios, metadata can also be imported through metadata connectors, which makes it possible to model a data warehouse without an active connection to the live source system during design. imported metadata is stored in the repository and later used by the wizard to generate the draft warehouse model. at this stage, no warehouse data has been loaded yet. only structure and metadata are being captured. the wizard the data warehouse wizard is the central acceleration mechanism in analyticscreator. it analyzes source metadata and generates a draft warehouse model automatically. depending on the selected approach, this can be a dimensional model, a data vault model, or a mixed approach. the wizard can create staging structures, historization layers, dimensions, facts, calendar dimensions, and default relationships based on detected metadata. the generated model is not the end result. it is the baseline that developers refine and validate. the main engineering work happens after generation, when keys, joins, historization behavior, measures, and transformations are adjusted to fit the intended warehouse design. warehouse layers analyticscreator supports a layered warehouse architecture from source to presentation. in a typical setup, this includes source objects, staging, persistent staging or historization, core transformations, data marts, and semantic or reporting layers. it can also generate analytical models for tools such as power bi. persistent staging a key architectural concept is the persistent staging layer. source data is first imported into staging structures and then stored persistently for further processing. this persistent layer is used for historization and for decoupling source extraction from downstream transformations. it allows data to be reprocessed without repeatedly reading the source system. in dimensional scenarios, historized tables typically include surrogate keys together with valid-from and valid-to columns. in data vault and hybrid scenarios, additional hash-based keys and references can be generated in the staging layer as persisted calculated columns and then reused in later layers. transformations transformations in analyticscreator are usually generated as sql views based on metadata definitions. these definitions specify source tables, joins, selected columns, macros, and transformation rules. in many cases, the default generated view logic is sufficient as a starting point, but it can be refined through metadata rather than by rewriting generated sql directly. analyticscreator also supports reusable macros for standard sql logic, such as date-to-calendar-key conversion or hash key generation. this allows repeated logic to be defined once and reused consistently across the model. synchronization, deployment, and execution these three steps are related but different and should not be confused. synchronization synchronization materializes the metadata model into sql objects in the target database. this creates the database structure defined in analyticscreator, such as tables, views, and procedures. it does not mean that business data has already been loaded. :contentreference[oaicite:13]{index=13} deployment deployment creates and distributes deployable artifacts for the selected target environment. these can include sql database packages, ssis packages, azure data factory pipelines, and semantic models. deployment prepares the environment but still does not imply that source data has already been processed. execution execution runs the generated workflows and pipelines. this is the step where source data is actually extracted, written to staging, historized where required, transformed into core structures, and exposed through data marts and semantic models. in azure scenarios, this may happen through azure data factory. in on-premise scenarios, this may happen through ssis. consumption after execution, the data warehouse can be consumed through data marts and semantic models. these structures are intended for reporting and analytics, while lower layers such as staging and historization should remain implementation layers rather than direct reporting interfaces. analyticscreator can generate tabular models and structures for tools such as power bi. design implications the repository is the source of truth metadata drives generation, not manual sql-first development the wizard creates a baseline, not a final production model persistent staging is part of the architecture, not just a temporary landing area synchronization, deployment, and execution are separate steps consumption should happen from data marts or semantic models, not from staging layers key takeaway analyticscreator works by storing warehouse definitions as metadata, generating sql and orchestration artifacts from that metadata, and then deploying and executing those artifacts in the target environment."}
,{"id":383225948358,"name":"Installation","type":"section","path":"/docs/getting-started/installation","breadcrumb":"Getting Started › Installation","description":"","searchText":"getting started installation installing analyticscreator: 32-bit and 64-bit versions this guide offers step-by-step instructions for installing either the 32-bit or 64-bit version of analyticscreator, depending on your system requirements. ⓘ note: to ensure optimal performance, verify that your system meets the following prerequisites before installation."}
,{"id":383225948359,"name":"System Requirements","type":"section","path":"/docs/getting-started/system-requirements","breadcrumb":"Getting Started › System Requirements","description":"","searchText":"getting started system requirements to ensure optimal performance, verify that the following requirements are met: ⓘ note: if you already have sql server installed and accessible, you can proceed directly to the launching analyticscreator section. networking: communication over port 443 is where analytics communicates to the analyticscreator server. operating system: windows 10 or later. analyticscreator is compatible with windows operating systems starting from version 10. ⓘ warning: port 443 is the standard https port for secured transactions. it is used for data transfers and ensures that data exchanged between a web browser and websites remains encrypted and protected from unauthorized access. microsoft sql server: sql server on azure virtual machines azure sql managed instances"}
,{"id":383225948360,"name":"Download and Installation","type":"section","path":"/docs/getting-started/download-and-installation","breadcrumb":"Getting Started › Download and Installation","description":"","searchText":"getting started download and installation access the download page navigate to the analyticscreator download page download the installer locate and download the installation file. verify sql server connectivity before proceeding with the installation, confirm that you can connect to your sql server instance. connecting to sql server: to ensure successful connectivity: use sql server management studio (ssms), a tool for managing and configuring sql server. if ssms is not installed on your system, download it from the official microsoft site: download sql server management studio (ssms) install the software once connectivity is confirmed, follow the instructions below to complete the installation."}
,{"id":383225948361,"name":"Configuring AnalyticsCreator","type":"section","path":"/docs/getting-started/configuring-analyticscreator","breadcrumb":"Getting Started › Configuring AnalyticsCreator","description":"","searchText":"getting started configuring analyticscreator this guide will walk you through configuring analyticscreator with your system. provide the login and password that you received by e-mail from analyticscreator minimum requirements configuration settings the configuration of analyticscreator is very simple. the only mandatory configuration is the sql server settings. sql server settings use localdb to store repository: enables you to store the analyticscreator project (metadata only) on your localdb. sql server to store repository: enter the ip address or the name of your microsoft sql server. security integrated: authentication is based on the current windows user. standard: requires a username and password. azure ad: uses azure ad (now microsoft entra) for microsoft sql server authentication. trust server certificate: accepts the server's certificate as trusted. sql user: the sql server username. sql password: the corresponding password. optional requirements paths unc path to store backup: a network path to store project backups. local sql server path to store backup: a local folder to store your project backups. local sql server path to store database: a local folder to store your sql server database backups. repository database template: the alias format for your repositories. default: repo_{reponame}. dwh database template: the alias format for your dwh templates. default: dwh_{reponame}. proxy settings proxy address: the ip address or hostname of your proxy server. proxy port: the port number used by the proxy. proxy user: the username for proxy authentication. proxy password: the password for the proxy user. now you're ready to create your new data warehouse with analyticscreator."}
,
{"id":383461199042,"name":"User Guide","type":"category","path":"/docs/user-guide","breadcrumb":"User Guide","description":"","searchText":"user guide you can launch analyticscreator in two ways: from the desktop icon after installation or streaming setup, a desktop shortcut is created. double-click the icon to start analyticscreator. from the installer window open the downloaded analyticscreator installer. instead of selecting install, click launch (labeled as number one in the image below). a window will appear showing the available analyticscreator servers, which deliver the latest version to your system. this process launches analyticscreator without performing a full installation, assuming all necessary prerequisites are already in place."}
,{"id":383225948364,"name":"Desktop Interface","type":"section","path":"/docs/user-guide/desktop-interface","breadcrumb":"User Guide › Desktop Interface","description":"","searchText":"user guide desktop interface with analyticscreator desktop users can: data warehouse creation automatically generate and structure your data warehouse, including fact tables and dimensions. connectors add connections to various data sources and import metadata seamlessly. layer management define and manage layers such as staging, persisted staging, core, and datamart layers. package generation generate integration packages for ssis (sql server integration services) and adf (azure data factory). indexes and partitions automatically configure indexes and partitions for optimized performance. roles and security manage roles and permissions to ensure secure access to your data. galaxies and hierarchies organize data across galaxies and define hierarchies for better data representation. customizations configure parameters, macros, scripts, and object-specific scripts for tailored solutions. filters and predefined transformations apply advanced filters and transformations for data preparation and enrichment. snapshots and versioning create snapshots to track and manage changes in your data warehouse. deployments deploy your projects with flexible configurations, supporting on-premises and cloud solutions. groups and models organize objects into groups and manage models for streamlined workflows. data historization automate the process of creating historical data models for auditing and analysis."}
,{"id":383225948365,"name":"Working with AnalyticsCreator","type":"section","path":"/docs/user-guide/working-with-analyticscreator","breadcrumb":"User Guide › Working with AnalyticsCreator","description":"","searchText":"user guide working with analyticscreator understanding the fundamental operations in analyticscreator desktop is essential for efficiently managing your data warehouse repository and ensuring accuracy in your projects. below are key basic operations you can perform within the interface: edit mode and saving - data warehouse editor single object editing: in the data warehouse repository, you can edit one object at a time. this ensures precision and reduces the risk of unintended changes across multiple objects. how to edit: double-click on any field within an object to enter edit mode. the selected field becomes editable, allowing you to make modifications. save prompt: if any changes are made, a prompt will appear, reminding you to save your modifications before exiting the edit mode. this safeguard prevents accidental loss of changes. unsaved changes: while edits are immediately reflected in the repository interface, they are not permanently saved until explicitly confirmed by clicking the save button. accessing views in data warehouse explorer layer-specific views: each layer in the data warehouse contains views generated by analyticscreator. these views provide insights into the underlying data structure and transformations applied at that layer. how to access: navigate to the data warehouse explorer and click on the view tab for the desired layer. this displays the layer's contents, including tables, fields, and transformations. adding and deleting objects adding new objects: navigate to the appropriate section (e.g., tables, layers, or connectors) in the navigation tree. right-click and select add [object type] to create a new object. provide the necessary details, such as name, description, and configuration parameters. save the object. deleting objects: select the object in the navigation tree and right-click to choose delete. confirm the deletion when prompted. â ď¸ note: deleting an object may affect dependent objects or configurations. filtering and searching in data warehouse explorer filtering: use filters to narrow down displayed objects by criteria such as name, type, or creation date. searching: enter keywords or phrases in the search bar to quickly locate objects. benefits: these features enhance repository navigation and efficiency when working with large datasets. object dependencies and relationships dependency view: for any selected object, view its dependencies and relationships with other objects by accessing the dependencies tab. impact analysis: analyze how changes to one object might affect other parts of the data warehouse. managing scripts predefined scripts: add scripts for common operations like data transformations or custom sql queries. edit and run: double-click a script in the navigation tree to modify it. use run script to execute and view results. validating and testing changes validation tools: use built-in tools to check for errors or inconsistencies in your repository. evaluate changes: use the evaluate button before saving or deploying to test functionality and ensure correctness. locking and unlocking objects locking: prevent simultaneous edits by locking objects, useful in team environments. unlocking: release locks once edits are complete to allow further modifications by others. exporting and importing data export: export objects, scripts, or configurations for backup or sharing. use the export option in the toolbar or navigation tree. import: import previously exported files to replicate configurations or restore backups. use the import option and follow the prompts to load the data."}
,{"id":391011561704,"name":"Historization with AnalyticsCreator","type":"subsection","path":"/docs/user-guide/working-with-analyticscreator/historization-with-analyticscreator","breadcrumb":"User Guide › Working with AnalyticsCreator › Historization with AnalyticsCreator","description":"","searchText":"user guide working with analyticscreator historization with analyticscreator historization in analyticscreator is applied after source import and before downstream analytical modeling. source data is first loaded into staging, then written into a persistent staging or historization layer, and only then used in core and datamart transformations. historization in analyticscreator table historization stores changing records with validity periods and surrogate keys. this page focuses on that pattern. column historization individual columns can use full history, equal-only behavior, or no change tracking. transformation historization downstream transformations can consume historized data as current-state, snapshot-based, or full historical output. join historization historized joins can apply different validity rules when combining time-dependent structures. purpose explain how analyticscreator stores and processes changing data over time so that previous states remain available for analysis and downstream processing. design principle analyticscreator treats historization as a warehouse-layer concern, not a reporting-layer concern. source data is imported first historization is applied in persistent staging downstream transformations consume historized data this design separates source extraction from change tracking and allows historical states to be reused across multiple downstream transformations. inputs / outputs inputs imported source table or source query in staging key definition used to identify records across loads column-level historization settings missing-source behavior optional filters and variables outputs historized table in persistent staging valid-from column valid-to column generated surrogate key generated historization stored procedure optional snapshot-aware downstream transformations internal mechanics 1. import first, historize second analyticscreator first imports source data into a staging table. historization is executed after the import step, not during initial extraction. 2. historized table structure a historized table typically contains: business key or source key tracked attributes valid-from field valid-to field surrogate key field this is the standard scd type 2 structure used to preserve previous states of a record. 3. column-level historization behavior historization is configurable per column. analyticscreator supports different behaviors per attribute: full history – changes create new historical versions equal only / scd1-style – current value is updated without creating a history row none – the column is ignored for change tracking this allows mixed historization strategies within the same object. 4. missing-source behavior analyticscreator allows explicit handling of records that disappear from the source: close the current record by setting the end of validity leave the current record open optionally insert an empty record to avoid timeline gaps this is important when rows can temporarily disappear and reappear later. 5. generated historization procedure historization logic is generated as a stored procedure. the procedure is specific to the object configuration and can be reviewed or extended if required. 6. downstream consumption downstream transformations can consume historized data in different ways: actual only – only the currently valid row is used snapshot – rows are selected based on a snapshot date between valid-from and valid-to full historical – all historical states remain available types / variants column-level change tracking full history equal only none missing-source behavior close validity keep open add empty record consumption behavior current-state only snapshot-based full historical access example assume a staging table contains customer data: stg_customer ( customer_id, name, city ) a historized table generated from it may look like this: pst_customer_history ( sats_id bigint, customer_id int, name nvarchar(100), city nvarchar(100), date_from datetime, date_to datetime ) a representative scd type 2 pattern is: -- close current row when tracked attributes changed update tgt set date_to = @load_ts from pst_customer_history tgt join stg_customer src on tgt.customer_id = src.customer_id and tgt.date_to is null where isnull(tgt.name, '') <> isnull(src.name, '') or isnull(tgt.city, '') <> isnull(src.city, ''); -- insert new current row insert into pst_customer_history ( customer_id, name, city, date_from, date_to ) select src.customer_id, src.name, src.city, @load_ts, null from stg_customer src left join pst_customer_history tgt on tgt.customer_id = src.customer_id and tgt.date_to is null where tgt.customer_id is null or isnull(tgt.name, '') <> isnull(src.name, '') or isnull(tgt.city, '') <> isnull(src.city, ''); this pattern shows the core behavior: current rows are closed when tracked attributes change, and a new current row is inserted. when to use / when not to use use when attribute changes must remain traceable over time source systems overwrite current values point-in-time analysis is required previous business states must remain queryable do not use when only the latest state matters the source already provides reliable historized data and duplicate historization is unnecessary storage growth from history rows is not acceptable performance & design considerations historization increases write volume and storage usage over-tracking noisy columns creates unnecessary row churn wrong missing-source settings can produce incorrect history timelines snapshot-based downstream joins are more expensive than current-state joins design trade-off: full history gives maximum traceability selective tracking improves storage and runtime efficiency integration with other analyticscreator features import packages and pipelines provide the staging input for historization transformation historization types define how historized rows are consumed downstream macros can support key generation in hybrid and data vault scenarios persisting can materialize downstream historized views for performance datamarts and semantic models can consume current-state or snapshot-based outputs common pitfalls tracking all columns as scd type 2 even when some should be scd1 or ignored not defining missing-source behavior using current-state-only logic when point-in-time analysis is required overusing snapshot logic in scenarios where current-state output is sufficient changing generated sql directly instead of fixing metadata configuration metadata representation historization metadata in analyticscreator typically includes: source object reference key definition per-column historization mode missing-source behavior optional filters and variables downstream transformation historization mode these settings are stored in the repository and used to generate historization logic and dependent transformations. deployment behavior build reads metadata from the repository generates historized tables generates historization procedures builds downstream transformations deploy deploys historized table structures deploys generated procedures deploys orchestration assets refresh / execute imports source data into staging executes historization logic refreshes downstream core and datamart structures key design principle what is generated? historized tables, surrogate keys, validity columns, and historization procedures when is it executed? after source import and before downstream transformation processing where is it stored? in the persistent staging or historization layer how does it scale? through selective column tracking, explicit missing-source handling, filtered loads, and downstream consumption control key takeaway analyticscreator implements scd type 2 historization as a configurable warehouse-layer service that preserves previous states through validity windows, surrogate keys, and generated historization procedures."}
,{"id":383225948366,"name":"Advanced Features","type":"section","path":"/docs/user-guide/advanced-features","breadcrumb":"User Guide › Advanced Features","description":"","searchText":"user guide advanced features analyticscreator provides a rich set of advanced features to help you configure, customize, and optimize your data warehouse projects. these features extend the toolâs capabilities beyond standard operations, enabling more precise control and flexibility. scripts scripts in analyticscreator allow for detailed customization at various stages of data warehouse creation and deployment. they enhance workflow flexibility and enable advanced repository configurations. types of scripts object-specific scripts define custom behavior for individual objects, such as tables or transformations, to meet specific requirements. pre-creation scripts execute tasks prior to creating database objects. example: define sql functions to be used in transformations. pre-deployment scripts configure processes that run before deploying the project. example: validate dependencies or prepare the target environment. post-deployment scripts handle actions executed after deployment is complete. example: perform cleanup tasks or execute stored procedures. pre-workflow scripts manage operations that occur before initiating an etl workflow. example: configure variables or initialize staging environments. repository extension scripts extend repository functionality with user-defined logic. example: add custom behaviors to redefine repository objects. historization the historization features in analyticscreator enable robust tracking and analysis of historical data changes, supporting advanced time-based reporting and auditing. key components slowly changing dimensions (scd) automate the management of changes in dimension data. supports various scd types including: type 1 (overwrite) type 2 (versioning) others as needed time dimensions create and manage temporal structures to facilitate time-based analysis. example: build fiscal calendars or weekly rollups for time-series analytics. snapshots capture and preserve specific states of the data warehouse. use cases include audit trails, historical reporting, and rollback points. parameters and macros these tools provide centralized control and reusable logic to optimize workflows and streamline repetitive tasks. parameters dynamic management: centralize variable definitions for consistent use across scripts, transformations, and workflows. reusable configurations: update values in one place to apply changes globally. use cases: set default values for connection strings, table prefixes, or date ranges. macros reusable logic: create parameterized scripts for tasks repeated across projects or workflows. streamlined processes: use macros to enforce consistent logic in transformations and calculations. example: define a macro to calculate age from a birthdate and reuse it across transformations. summary analyticscreatorâs advanced features offer deep customization options that allow you to: control object-level behavior through scripting track and manage historical data effectively streamline project-wide settings with parameters reuse logic with powerful macros these capabilities enable you to build scalable, maintainable, and highly flexible data warehouse solutions."}
,{"id":383225948367,"name":"Wizards","type":"section","path":"/docs/user-guide/wizards","breadcrumb":"User Guide › Wizards","description":"","searchText":"user guide wizards the wizards in analyticscreator provide a guided and efficient way to perform various tasks related to building and managing a data warehouse. below is an overview of the eight available wizards and their core functions. dwh wizard the dwh wizard is designed to quickly create a semi-ready data warehouse. it is especially useful when the data source contains defined table relationships or manually maintained references. supports multiple architectures: classic (kimball), data vault 1.0 & 2.0, or mixed. automatically creates imports, dimensions, facts, hubs, satellites, and links. customizable field naming, calendar dimensions, and sap deltaq integration. source wizard the source wizard adds new data sources to the repository. supports source types: table or query. retrieves table relationships and sap-specific metadata. allows query testing and schema/table filtering. import wizard the import wizard defines and manages the import of external data into the warehouse. configures source, target schema, table name, and ssis package. allows additional attributes and parameters. historization wizard the historization wizard manages how tables or transformations are historized. supports scd types: 0, 1, and 2. configures empty record behavior and vault id usage. supports ssis-based or stored procedure historization. transformation wizard the transformation wizard creates and manages data transformations. supports regular, manual, script, and external transformation types. handles both historized and non-historized data. configures joins, fields, persistence, and metadata settings. calendar transformation wizard the calendar transformation wizard creates calendar transformations used in reporting and time-based models. configures schema, name, start/end dates, and date-to-id macros. assigns transformations to specific data mart stars. time transformation wizard the time transformation wizard creates time dimensions to support time-based analytics. configures schema, name, time period, and time-to-id macros. assigns transformations to specific data mart stars. snapshot transformation wizard the snapshot transformation wizard creates snapshot dimensions for snapshot-based analysis. allows creation of one snapshot dimension per data warehouse. configures schema, name, and data mart star assignment. by using these eight wizards, analyticscreator simplifies complex tasks, ensures consistency, and accelerates the creation and management of enterprise data warehouse solutions."}
,{"id":384157771973,"name":"DWH Wizard","type":"subsection","path":"/docs/user-guide/wizards/dwh-wizard-function","breadcrumb":"User Guide › Wizards › DWH Wizard","description":"","searchText":"user guide wizards dwh wizard the dwh wizard allows for the rapid creation of a semi-ready data warehouse. it is especially effective when the data source includes predefined table references or manually maintained source references. prerequisites at least one source connector must be defined before using the dwh wizard. note: the dwh wizard support flat files using duckdb , in that case you should select the option \"use metadata of existing sources\" or use the source wizard instead. to launch the dwh wizard, click the “dwh wizard” button in the toolbar. instead, the user can use the connector context menu: using the dwh wizard select the connector, optionally enter the schema or table filter, and click \"apply\". then, the source tables will be displayed. optionally, select the \"existing sources\" radio button to work with already defined sources instead of querying the external system (ideal for meta connectors). if a table already exists, the \"exist\" checkbox will be selected. to add or remove tables: select them and click the ▶ button to add. select from below and click the ◀ button to remove. dwh wizard architecture options the wizard can generate the dwh using: classic or mixed architecture: supports imports, historization, dimensions, and facts. data vault architecture: supports hubs, satellites, links, dimensions, and facts with automatic classification when “auto” is selected. define name templates for dwh objects: set additional parameters: dwh wizard properties field name appearance: leave unchanged, or convert to upper/lowercase. retrieve relations: enable automatic relation detection from source metadata. create calendar dimension: auto-create calendar dimension and define date range. include tables in facts: include related tables in facts (n:1, indirect, etc.). use calendar in facts: include date-to-calendar references in fact transformations. sap deltaq transfer mode: choose between idoc or trfs. sap deltaq automatic synchronization: enable automatic deltaq sync. sap description language: select sap object description language. datavault2: do not create hubs: optionally suppress hub creation in dv2. historizing type: choose ssis package or stored procedure for historization. use friendly names in transformations as column names: use display names from sap/meta/manual connectors. default transformations: select default predefined transformations for dimensions. stars: assign generated dimensions and facts to data mart stars."}
,{"id":389871309018,"name":"DWH Wizard Table Name","type":"topic","path":"/docs/user-guide/wizards/dwh-wizard-function/parameters-dwh-wizard-dwh-wizard-table-name","breadcrumb":"User Guide › Wizards › DWH Wizard › DWH Wizard Table Name","description":"","searchText":"user guide wizards dwh wizard dwh wizard table name overview dwh wizard table name is a dwh wizard parameter that defines the template for generated table names. function use this setting to keep dwh wizard object generation consistent across the project. analyticscreator uses this value when no custom value is saved for the project. keep placeholder names unchanged when adapting the pattern. this value supports placeholders such as {src_name}. access the parameter is maintained from the parameters list in analyticscreator. how to access navigation tree parameters->list parameters toolbar options->parameter diagram not opened from the diagram. visual element parameter list default value {src_name} custom value not set. where it is used this parameter belongs to the dwh wizard group and is used when analyticscreator applies dwh wizard object generation. setting value technical parameter name dwhwizard_tablename default value {src_name} custom value not set. parameter groups group dwh wizard wizard defaults wizard related topics dwh wizard dwh wizard snapshot dwh wizard tablesperpackage parameters previous dwh wizard nextdwh wizard imppackagename"}
,{"id":389871309019,"name":"DWH Wizard Imppackagename","type":"topic","path":"/docs/user-guide/wizards/dwh-wizard-function/parameters-dwh-wizard-dwh-wizard-imppackagename","breadcrumb":"User Guide › Wizards › DWH Wizard › DWH Wizard Imppackagename","description":"","searchText":"user guide wizards dwh wizard dwh wizard imppackagename overview dwh wizard imppackagename is a dwh wizard parameter that defines the template for generated import package names. function use this setting to keep dwh wizard object generation consistent across the project. analyticscreator uses this value when no custom value is saved for the project. keep placeholder names unchanged when adapting the pattern. this value supports placeholders such as {connector_name}, {nr}. access the parameter is maintained from the parameters list in analyticscreator. how to access navigation tree parameters->list parameters toolbar options->parameter diagram not opened from the diagram. visual element parameter list default value imp_{connector_name}{nr} custom value not set. where it is used this parameter belongs to the dwh wizard group and is used when analyticscreator applies dwh wizard object generation. setting value technical parameter name dwhwizard_imppackagename default value imp_{connector_name}{nr} custom value not set. parameter groups group dwh wizard wizard defaults wizard related topics dwh wizard dwh wizard hub transname dwh wizard link packagename parameters previous dwh wizard table name nextdwh wizard histpackagename"}
,{"id":389871309020,"name":"DWH Wizard Histpackagename","type":"topic","path":"/docs/user-guide/wizards/dwh-wizard-function/parameters-dwh-wizard-dwh-wizard-histpackagename","breadcrumb":"User Guide › Wizards › DWH Wizard › DWH Wizard Histpackagename","description":"","searchText":"user guide wizards dwh wizard dwh wizard histpackagename overview dwh wizard histpackagename is a dwh wizard parameter that defines the template for generated historization package names. function use this setting to keep dwh wizard object generation consistent across the project. analyticscreator uses this value when no custom value is saved for the project. keep placeholder names unchanged when adapting the pattern. this value supports placeholders such as {connector_name}, {nr}. access the parameter is maintained from the parameters list in analyticscreator. how to access navigation tree parameters->list parameters toolbar options->parameter diagram not opened from the diagram. visual element parameter list default value hist_{connector_name}{nr} custom value not set. where it is used this parameter belongs to the dwh wizard group and is used when analyticscreator applies dwh wizard object generation. setting value technical parameter name dwhwizard_histpackagename default value hist_{connector_name}{nr} custom value not set. parameter groups group dwh wizard wizard defaults wizard related topics dwh wizard dwh wizard factname dwh wizard hub packagename parameters previous dwh wizard imppackagename nextdwh wizard transname"}
,{"id":389871309021,"name":"DWH Wizard Transname","type":"topic","path":"/docs/user-guide/wizards/dwh-wizard-function/parameters-dwh-wizard-dwh-wizard-transname","breadcrumb":"User Guide › Wizards › DWH Wizard › DWH Wizard Transname","description":"","searchText":"user guide wizards dwh wizard dwh wizard transname overview dwh wizard transname is a dwh wizard parameter that defines the template for generated transformations. function use this setting to keep dwh wizard object generation consistent across the project. analyticscreator uses this value when no custom value is saved for the project. keep placeholder names unchanged when adapting the pattern. this value supports placeholders such as {src_name}. access the parameter is maintained from the parameters list in analyticscreator. how to access navigation tree parameters->list parameters toolbar options->parameter diagram not opened from the diagram. visual element parameter list default value {src_name}_v custom value not set. where it is used this parameter belongs to the dwh wizard group and is used when analyticscreator applies dwh wizard object generation. setting value technical parameter name dwhwizard_transname default value {src_name}_v custom value not set. parameter groups group dwh wizard wizard defaults wizard related topics dwh wizard dwh wizard tablesperpackage dwh wizard vaultlinksat parameters previous dwh wizard histpackagename nextdwh wizard dimname"}
,{"id":389871309022,"name":"DWH Wizard Dimname","type":"topic","path":"/docs/user-guide/wizards/dwh-wizard-function/parameters-dwh-wizard-dwh-wizard-dimname","breadcrumb":"User Guide › Wizards › DWH Wizard › DWH Wizard Dimname","description":"","searchText":"user guide wizards dwh wizard dwh wizard dimname overview dwh wizard dimname is a dwh wizard parameter that defines the template for generated dimensions. function use this setting to keep dwh wizard object generation consistent across the project. analyticscreator uses this value when no custom value is saved for the project. keep placeholder names unchanged when adapting the pattern. this value supports placeholders such as {src_name}. access the parameter is maintained from the parameters list in analyticscreator. how to access navigation tree parameters->list parameters toolbar options->parameter diagram not opened from the diagram. visual element parameter list default value dim_{src_name} custom value not set. where it is used this parameter belongs to the dwh wizard group and is used when analyticscreator applies dwh wizard object generation. setting value technical parameter name dwhwizard_dimname default value dim_{src_name} custom value not set. parameter groups group dwh wizard wizard defaults wizard related topics dwh wizard dwh wizard calendar transname dwh wizard dwhtype parameters previous dwh wizard transname nextdwh wizard factname"}
,{"id":389871309023,"name":"DWH Wizard Factname","type":"topic","path":"/docs/user-guide/wizards/dwh-wizard-function/parameters-dwh-wizard-dwh-wizard-factname","breadcrumb":"User Guide › Wizards › DWH Wizard › DWH Wizard Factname","description":"","searchText":"user guide wizards dwh wizard dwh wizard factname overview dwh wizard factname is a dwh wizard parameter that defines the template for generated facts. function use this setting to keep dwh wizard object generation consistent across the project. analyticscreator uses this value when no custom value is saved for the project. keep placeholder names unchanged when adapting the pattern. this value supports placeholders such as {src_name}. access the parameter is maintained from the parameters list in analyticscreator. how to access navigation tree parameters->list parameters toolbar options->parameter diagram not opened from the diagram. visual element parameter list default value fact_{src_name} custom value not set. where it is used this parameter belongs to the dwh wizard group and is used when analyticscreator applies dwh wizard object generation. setting value technical parameter name dwhwizard_factname default value fact_{src_name} custom value not set. parameter groups group dwh wizard wizard defaults wizard related topics dwh wizard dwh wizard fact calendar dwh wizard histpackagename parameters previous dwh wizard dimname nextdwh wizard tablesperpackage"}
,{"id":389871309024,"name":"DWH Wizard Tablesperpackage","type":"topic","path":"/docs/user-guide/wizards/dwh-wizard-function/parameters-dwh-wizard-dwh-wizard-tablesperpackage","breadcrumb":"User Guide › Wizards › DWH Wizard › DWH Wizard Tablesperpackage","description":"","searchText":"user guide wizards dwh wizard dwh wizard tablesperpackage overview dwh wizard tablesperpackage is a dwh wizard parameter that controls the number of tables included in each generated package. function use this setting to keep dwh wizard object generation consistent across the project. analyticscreator uses this value when no custom value is saved for the project. access the parameter is maintained from the parameters list in analyticscreator. how to access navigation tree parameters->list parameters toolbar options->parameter diagram not opened from the diagram. visual element parameter list default value 10 custom value not set. where it is used this parameter belongs to the dwh wizard group and is used when analyticscreator applies dwh wizard object generation. setting value technical parameter name dwhwizard_tablesperpackage default value 10 custom value not set. parameter groups group dwh wizard wizard defaults wizard related topics dwh wizard dwh wizard table name dwh wizard transname parameters previous dwh wizard factname nextdwh wizard hub packagename"}
,{"id":389871309025,"name":"DWH Wizard Hub Packagename","type":"topic","path":"/docs/user-guide/wizards/dwh-wizard-function/parameters-dwh-wizard-dwh-wizard-hub-packagename","breadcrumb":"User Guide › Wizards › DWH Wizard › DWH Wizard Hub Packagename","description":"","searchText":"user guide wizards dwh wizard dwh wizard hub packagename overview dwh wizard hub packagename is a dwh wizard parameter that defines the template for generated hub packages. function use this setting to keep dwh wizard object generation consistent across the project. analyticscreator uses this value when no custom value is saved for the project. keep placeholder names unchanged when adapting the pattern. this value supports placeholders such as {connector_name}, {nr}. access the parameter is maintained from the parameters list in analyticscreator. how to access navigation tree parameters->list parameters toolbar options->parameter diagram not opened from the diagram. visual element parameter list default value hist_{connector_name}_hub{nr} custom value not set. where it is used this parameter belongs to the dwh wizard group and is used when analyticscreator applies dwh wizard object generation. setting value technical parameter name dwhwizard_hub_packagename default value hist_{connector_name}_hub{nr} custom value not set. parameter groups group dwh wizard wizard defaults wizard related topics dwh wizard dwh wizard histpackagename dwh wizard hub table name parameters previous dwh wizard tablesperpackage nextdwh wizard sat packagename"}
,{"id":389871309026,"name":"DWH Wizard SAT Packagename","type":"topic","path":"/docs/user-guide/wizards/dwh-wizard-function/parameters-dwh-wizard-dwh-wizard-sat-packagename","breadcrumb":"User Guide › Wizards › DWH Wizard › DWH Wizard SAT Packagename","description":"","searchText":"user guide wizards dwh wizard dwh wizard sat packagename overview dwh wizard sat packagename is a dwh wizard parameter that defines the template for generated sat packages. function use this setting to keep dwh wizard object generation consistent across the project. analyticscreator uses this value when no custom value is saved for the project. keep placeholder names unchanged when adapting the pattern. this value supports placeholders such as {connector_name}, {nr}. access the parameter is maintained from the parameters list in analyticscreator. how to access navigation tree parameters->list parameters toolbar options->parameter diagram not opened from the diagram. visual element parameter list default value hist_{connector_name}_sat{nr} custom value not set. where it is used this parameter belongs to the dwh wizard group and is used when analyticscreator applies dwh wizard object generation. setting value technical parameter name dwhwizard_sat_packagename default value hist_{connector_name}_sat{nr} custom value not set. parameter groups group dwh wizard wizard defaults wizard related topics dwh wizard dwh wizard sap tables dwh wizard sat table name parameters previous dwh wizard hub packagename nextdwh wizard link packagename"}
,{"id":389871309027,"name":"DWH Wizard Link Packagename","type":"topic","path":"/docs/user-guide/wizards/dwh-wizard-function/parameters-dwh-wizard-dwh-wizard-link-packagename","breadcrumb":"User Guide › Wizards › DWH Wizard › DWH Wizard Link Packagename","description":"","searchText":"user guide wizards dwh wizard dwh wizard link packagename overview dwh wizard link packagename is a dwh wizard parameter that defines the template for generated link packages. function use this setting to keep dwh wizard object generation consistent across the project. analyticscreator uses this value when no custom value is saved for the project. keep placeholder names unchanged when adapting the pattern. this value supports placeholders such as {connector_name}, {nr}. access the parameter is maintained from the parameters list in analyticscreator. how to access navigation tree parameters->list parameters toolbar options->parameter diagram not opened from the diagram. visual element parameter list default value hist_{connector_name}_link{nr} custom value not set. where it is used this parameter belongs to the dwh wizard group and is used when analyticscreator applies dwh wizard object generation. setting value technical parameter name dwhwizard_link_packagename default value hist_{connector_name}_link{nr} custom value not set. parameter groups group dwh wizard wizard defaults wizard related topics dwh wizard dwh wizard imppackagename dwh wizard link table name parameters previous dwh wizard sat packagename nextdwh wizard hub transname"}
,{"id":389871309028,"name":"DWH Wizard Hub Transname","type":"topic","path":"/docs/user-guide/wizards/dwh-wizard-function/parameters-dwh-wizard-dwh-wizard-hub-transname","breadcrumb":"User Guide › Wizards › DWH Wizard › DWH Wizard Hub Transname","description":"","searchText":"user guide wizards dwh wizard dwh wizard hub transname overview dwh wizard hub transname is a dwh wizard parameter that defines the template for generated hub transformations. function use this setting to keep dwh wizard object generation consistent across the project. analyticscreator uses this value when no custom value is saved for the project. keep placeholder names unchanged when adapting the pattern. this value supports placeholders such as {src_name}. access the parameter is maintained from the parameters list in analyticscreator. how to access navigation tree parameters->list parameters toolbar options->parameter diagram not opened from the diagram. visual element parameter list default value {src_name}_hub custom value not set. where it is used this parameter belongs to the dwh wizard group and is used when analyticscreator applies dwh wizard object generation. setting value technical parameter name dwhwizard_hub_transname default value {src_name}_hub custom value not set. parameter groups group dwh wizard wizard defaults wizard related topics dwh wizard dwh wizard hub table name dwh wizard imppackagename parameters previous dwh wizard link packagename nextdwh wizard sat transname"}
,{"id":389871309029,"name":"DWH Wizard SAT Transname","type":"topic","path":"/docs/user-guide/wizards/dwh-wizard-function/parameters-dwh-wizard-dwh-wizard-sat-transname","breadcrumb":"User Guide › Wizards › DWH Wizard › DWH Wizard SAT Transname","description":"","searchText":"user guide wizards dwh wizard dwh wizard sat transname overview dwh wizard sat transname is a dwh wizard parameter that defines the template for generated sat transformations. function use this setting to keep dwh wizard object generation consistent across the project. analyticscreator uses this value when no custom value is saved for the project. keep placeholder names unchanged when adapting the pattern. this value supports placeholders such as {src_name}. access the parameter is maintained from the parameters list in analyticscreator. how to access navigation tree parameters->list parameters toolbar options->parameter diagram not opened from the diagram. visual element parameter list default value {src_name}_sat custom value not set. where it is used this parameter belongs to the dwh wizard group and is used when analyticscreator applies dwh wizard object generation. setting value technical parameter name dwhwizard_sat_transname default value {src_name}_sat custom value not set. parameter groups group dwh wizard wizard defaults wizard related topics dwh wizard dwh wizard sat table name dwh wizard snapshot parameters previous dwh wizard hub transname nextdwh wizard link transname"}
,{"id":389871309030,"name":"DWH Wizard Link Transname","type":"topic","path":"/docs/user-guide/wizards/dwh-wizard-function/parameters-dwh-wizard-dwh-wizard-link-transname","breadcrumb":"User Guide › Wizards › DWH Wizard › DWH Wizard Link Transname","description":"","searchText":"user guide wizards dwh wizard dwh wizard link transname overview dwh wizard link transname is a dwh wizard parameter that defines the template for generated link transformations. function use this setting to keep dwh wizard object generation consistent across the project. analyticscreator uses this value when no custom value is saved for the project. keep placeholder names unchanged when adapting the pattern. this value supports placeholders such as {src_name}. access the parameter is maintained from the parameters list in analyticscreator. how to access navigation tree parameters->list parameters toolbar options->parameter diagram not opened from the diagram. visual element parameter list default value {src_name}_link custom value not set. where it is used this parameter belongs to the dwh wizard group and is used when analyticscreator applies dwh wizard object generation. setting value technical parameter name dwhwizard_link_transname default value {src_name}_link custom value not set. parameter groups group dwh wizard wizard defaults wizard related topics dwh wizard dwh wizard link table name dwh wizard linksat transname parameters previous dwh wizard sat transname nextdwh wizard linksat transname"}
,{"id":389871309031,"name":"DWH Wizard Linksat Transname","type":"topic","path":"/docs/user-guide/wizards/dwh-wizard-function/parameters-dwh-wizard-dwh-wizard-linksat-transname","breadcrumb":"User Guide › Wizards › DWH Wizard › DWH Wizard Linksat Transname","description":"","searchText":"user guide wizards dwh wizard dwh wizard linksat transname overview dwh wizard linksat transname is a dwh wizard parameter that defines the template for generated linksat transformations. function use this setting to keep dwh wizard object generation consistent across the project. analyticscreator uses this value when no custom value is saved for the project. keep placeholder names unchanged when adapting the pattern. this value supports placeholders such as {link_name}. access the parameter is maintained from the parameters list in analyticscreator. how to access navigation tree parameters->list parameters toolbar options->parameter diagram not opened from the diagram. visual element parameter list default value {link_name}sat custom value not set. where it is used this parameter belongs to the dwh wizard group and is used when analyticscreator applies dwh wizard object generation. setting value technical parameter name dwhwizard_linksat_transname default value {link_name}sat custom value not set. parameter groups group dwh wizard wizard defaults wizard related topics dwh wizard dwh wizard link transname dwh wizard predefined transformations parameters previous dwh wizard link transname nextdwh wizard hub table name"}
,{"id":389871309032,"name":"DWH Wizard Hub Table Name","type":"topic","path":"/docs/user-guide/wizards/dwh-wizard-function/parameters-dwh-wizard-dwh-wizard-hub-table-name","breadcrumb":"User Guide › Wizards › DWH Wizard › DWH Wizard Hub Table Name","description":"","searchText":"user guide wizards dwh wizard dwh wizard hub table name overview dwh wizard hub table name is a dwh wizard parameter that defines the template for generated hub tables. function use this setting to keep dwh wizard object generation consistent across the project. analyticscreator uses this value when no custom value is saved for the project. keep placeholder names unchanged when adapting the pattern. this value supports placeholders such as {src_name}. access the parameter is maintained from the parameters list in analyticscreator. how to access navigation tree parameters->list parameters toolbar options->parameter diagram not opened from the diagram. visual element parameter list default value {src_name}_hub custom value not set. where it is used this parameter belongs to the dwh wizard group and is used when analyticscreator applies dwh wizard object generation. setting value technical parameter name dwhwizard_hub_tablename default value {src_name}_hub custom value not set. parameter groups group dwh wizard wizard defaults wizard related topics dwh wizard dwh wizard hub packagename dwh wizard hub transname parameters previous dwh wizard linksat transname nextdwh wizard sat table name"}
,{"id":389871309033,"name":"DWH Wizard SAT Table Name","type":"topic","path":"/docs/user-guide/wizards/dwh-wizard-function/parameters-dwh-wizard-dwh-wizard-sat-table-name","breadcrumb":"User Guide › Wizards › DWH Wizard › DWH Wizard SAT Table Name","description":"","searchText":"user guide wizards dwh wizard dwh wizard sat table name overview dwh wizard sat table name is a dwh wizard parameter that defines the template for generated sat tables. function use this setting to keep dwh wizard object generation consistent across the project. analyticscreator uses this value when no custom value is saved for the project. keep placeholder names unchanged when adapting the pattern. this value supports placeholders such as {src_name}. access the parameter is maintained from the parameters list in analyticscreator. how to access navigation tree parameters->list parameters toolbar options->parameter diagram not opened from the diagram. visual element parameter list default value {src_name}_sat custom value not set. where it is used this parameter belongs to the dwh wizard group and is used when analyticscreator applies dwh wizard object generation. setting value technical parameter name dwhwizard_sat_tablename default value {src_name}_sat custom value not set. parameter groups group dwh wizard wizard defaults wizard related topics dwh wizard dwh wizard sat packagename dwh wizard sat transname parameters previous dwh wizard hub table name nextdwh wizard link table name"}
,{"id":389871309034,"name":"DWH Wizard Link Table Name","type":"topic","path":"/docs/user-guide/wizards/dwh-wizard-function/parameters-dwh-wizard-dwh-wizard-link-table-name","breadcrumb":"User Guide › Wizards › DWH Wizard › DWH Wizard Link Table Name","description":"","searchText":"user guide wizards dwh wizard dwh wizard link table name overview dwh wizard link table name is a dwh wizard parameter that defines the template for generated link tables. function use this setting to keep dwh wizard object generation consistent across the project. analyticscreator uses this value when no custom value is saved for the project. keep placeholder names unchanged when adapting the pattern. this value supports placeholders such as {src_name}. access the parameter is maintained from the parameters list in analyticscreator. how to access navigation tree parameters->list parameters toolbar options->parameter diagram not opened from the diagram. visual element parameter list default value {src_name}_link custom value not set. where it is used this parameter belongs to the dwh wizard group and is used when analyticscreator applies dwh wizard object generation. setting value technical parameter name dwhwizard_link_tablename default value {src_name}_link custom value not set. parameter groups group dwh wizard wizard defaults wizard related topics dwh wizard dwh wizard link packagename dwh wizard link transname parameters previous dwh wizard sat table name nextdwh wizard dwhtype"}
,{"id":389871309035,"name":"DWH Wizard Dwhtype","type":"topic","path":"/docs/user-guide/wizards/dwh-wizard-function/parameters-dwh-wizard-dwh-wizard-dwhtype","breadcrumb":"User Guide › Wizards › DWH Wizard › DWH Wizard Dwhtype","description":"","searchText":"user guide wizards dwh wizard dwh wizard dwhtype overview dwh wizard dwhtype is a dwh wizard parameter that sets the dwh type used by the dwh wizard. function use this setting to keep dwh wizard object generation consistent across the project. analyticscreator uses this value when no custom value is saved for the project. access the parameter is maintained from the parameters list in analyticscreator. how to access navigation tree parameters->list parameters toolbar options->parameter diagram not opened from the diagram. visual element parameter list default value 1 custom value not set. where it is used this parameter belongs to the dwh wizard group and is used when analyticscreator applies dwh wizard object generation. setting value technical parameter name dwhwizard_dwhtype default value 1 custom value not set. parameter groups group dwh wizard wizard defaults wizard related topics dwh wizard dwh wizard dimname dwh wizard fact parameters previous dwh wizard link table name nextdwh wizard snapshot"}
,{"id":389871309036,"name":"DWH Wizard Snapshot","type":"topic","path":"/docs/user-guide/wizards/dwh-wizard-function/parameters-dwh-wizard-dwh-wizard-snapshot","breadcrumb":"User Guide › Wizards › DWH Wizard › DWH Wizard Snapshot","description":"","searchText":"user guide wizards dwh wizard dwh wizard snapshot overview dwh wizard snapshot is a dwh wizard parameter that controls whether the wizard creates snapshot objects. function use this setting to keep dwh wizard object generation consistent across the project. analyticscreator uses this value when no custom value is saved for the project. access the parameter is maintained from the parameters list in analyticscreator. how to access navigation tree parameters->list parameters toolbar options->parameter diagram not opened from the diagram. visual element parameter list default value 1 custom value not set. where it is used this parameter belongs to the dwh wizard group and is used when analyticscreator applies dwh wizard object generation. setting value technical parameter name dwhwizard_snapshot default value 1 custom value not set. parameter groups group dwh wizard wizard defaults wizard related topics dwh wizard dwh wizard sat transname dwh wizard table name parameters previous dwh wizard dwhtype nextdwh wizard calendar"}
,{"id":389871309037,"name":"DWH Wizard Calendar","type":"topic","path":"/docs/user-guide/wizards/dwh-wizard-function/parameters-dwh-wizard-dwh-wizard-calendar","breadcrumb":"User Guide › Wizards › DWH Wizard › DWH Wizard Calendar","description":"","searchText":"user guide wizards dwh wizard dwh wizard calendar overview dwh wizard calendar is a dwh wizard parameter that sets the option used for the dwh wizard calendar. function use this setting to keep dwh wizard object generation consistent across the project. analyticscreator uses this value when no custom value is saved for the project. access the parameter is maintained from the parameters list in analyticscreator. how to access navigation tree parameters->list parameters toolbar options->parameter diagram not opened from the diagram. visual element parameter list default value 1 custom value not set. where it is used this parameter belongs to the dwh wizard group and is used when analyticscreator applies dwh wizard object generation. setting value technical parameter name dwhwizard_calendar default value 1 custom value not set. parameter groups group dwh wizard wizard defaults wizard related topics dwh wizard dwh wizard calendar from parameters previous dwh wizard snapshot nextdwh wizard calendar transname"}
,{"id":389871309038,"name":"DWH Wizard Calendar Transname","type":"topic","path":"/docs/user-guide/wizards/dwh-wizard-function/parameters-dwh-wizard-dwh-wizard-calendar-transname","breadcrumb":"User Guide › Wizards › DWH Wizard › DWH Wizard Calendar Transname","description":"","searchText":"user guide wizards dwh wizard dwh wizard calendar transname overview dwh wizard calendar transname is a dwh wizard parameter that controls the calendar dimension name. function use this setting to keep dwh wizard object generation consistent across the project. analyticscreator uses this value when no custom value is saved for the project. access the parameter is maintained from the parameters list in analyticscreator. how to access navigation tree parameters->list parameters toolbar options->parameter diagram not opened from the diagram. visual element parameter list default value dim_calendar custom value not set. where it is used this parameter belongs to the dwh wizard group and is used when analyticscreator applies dwh wizard object generation. setting value technical parameter name dwhwizard_calendar_transname default value dim_calendar custom value not set. parameter groups group dwh wizard wizard defaults wizard related topics dwh wizard dwh wizard calendar to dwh wizard dimname parameters previous dwh wizard calendar nextdwh wizard calendar from"}
,{"id":389871309039,"name":"DWH Wizard Calendar From","type":"topic","path":"/docs/user-guide/wizards/dwh-wizard-function/parameters-dwh-wizard-dwh-wizard-calendar-from","breadcrumb":"User Guide › Wizards › DWH Wizard › DWH Wizard Calendar From","description":"","searchText":"user guide wizards dwh wizard dwh wizard calendar from overview dwh wizard calendar from is a dwh wizard parameter that controls the calendar start date. function use this setting to keep dwh wizard object generation consistent across the project. analyticscreator uses this value when no custom value is saved for the project. access the parameter is maintained from the parameters list in analyticscreator. how to access navigation tree parameters->list parameters toolbar options->parameter diagram not opened from the diagram. visual element parameter list default value 19800101 custom value not set. where it is used this parameter belongs to the dwh wizard group and is used when analyticscreator applies dwh wizard object generation. setting value technical parameter name dwhwizard_calendar_from default value 19800101 custom value not set. parameter groups group dwh wizard wizard defaults wizard related topics dwh wizard dwh wizard calendar dwh wizard calendar to parameters previous dwh wizard calendar transname nextdwh wizard calendar to"}
,{"id":389871309040,"name":"DWH Wizard Calendar To","type":"topic","path":"/docs/user-guide/wizards/dwh-wizard-function/parameters-dwh-wizard-dwh-wizard-calendar-to","breadcrumb":"User Guide › Wizards › DWH Wizard › DWH Wizard Calendar To","description":"","searchText":"user guide wizards dwh wizard dwh wizard calendar to overview dwh wizard calendar to is a dwh wizard parameter that controls the calendar end date. function use this setting to keep dwh wizard object generation consistent across the project. analyticscreator uses this value when no custom value is saved for the project. access the parameter is maintained from the parameters list in analyticscreator. how to access navigation tree parameters->list parameters toolbar options->parameter diagram not opened from the diagram. visual element parameter list default value 20401231 custom value not set. where it is used this parameter belongs to the dwh wizard group and is used when analyticscreator applies dwh wizard object generation. setting value technical parameter name dwhwizard_calendar_to default value 20401231 custom value not set. parameter groups group dwh wizard wizard defaults wizard related topics dwh wizard dwh wizard calendar from dwh wizard calendar transname parameters previous dwh wizard calendar from nextdwh wizard fact"}
,{"id":389871309041,"name":"DWH Wizard Fact","type":"topic","path":"/docs/user-guide/wizards/dwh-wizard-function/parameters-dwh-wizard-dwh-wizard-fact","breadcrumb":"User Guide › Wizards › DWH Wizard › DWH Wizard Fact","description":"","searchText":"user guide wizards dwh wizard dwh wizard fact overview dwh wizard fact is a dwh wizard parameter that sets the fact generation option of the dwh wizard. function use this setting to keep dwh wizard object generation consistent across the project. analyticscreator uses this value when no custom value is saved for the project. access the parameter is maintained from the parameters list in analyticscreator. how to access navigation tree parameters->list parameters toolbar options->parameter diagram not opened from the diagram. visual element parameter list default value 1 custom value not set. where it is used this parameter belongs to the dwh wizard group and is used when analyticscreator applies dwh wizard object generation. setting value technical parameter name dwhwizard_fact default value 1 custom value not set. parameter groups group dwh wizard wizard defaults wizard related topics dwh wizard dwh wizard dwhtype dwh wizard fact calendar parameters previous dwh wizard calendar to nextdwh wizard fact calendar"}
,{"id":389871309042,"name":"DWH Wizard Fact Calendar","type":"topic","path":"/docs/user-guide/wizards/dwh-wizard-function/parameters-dwh-wizard-dwh-wizard-fact-calendar","breadcrumb":"User Guide › Wizards › DWH Wizard › DWH Wizard Fact Calendar","description":"","searchText":"user guide wizards dwh wizard dwh wizard fact calendar overview dwh wizard fact calendar is a dwh wizard parameter that sets the calendar option for generated facts. function use this setting to keep dwh wizard object generation consistent across the project. analyticscreator uses this value when no custom value is saved for the project. access the parameter is maintained from the parameters list in analyticscreator. how to access navigation tree parameters->list parameters toolbar options->parameter diagram not opened from the diagram. visual element parameter list default value 1 custom value not set. where it is used this parameter belongs to the dwh wizard group and is used when analyticscreator applies dwh wizard object generation. setting value technical parameter name dwhwizard_fact_calendar default value 1 custom value not set. parameter groups group dwh wizard wizard defaults wizard related topics dwh wizard dwh wizard fact dwh wizard factname parameters previous dwh wizard fact nextdwh wizard vaultlinksat"}
,{"id":389872719057,"name":"DWH Wizard Vaultlinksat","type":"topic","path":"/docs/user-guide/wizards/dwh-wizard-function/parameters-dwh-wizard-dwh-wizard-vaultlinksat","breadcrumb":"User Guide › Wizards › DWH Wizard › DWH Wizard Vaultlinksat","description":"","searchText":"user guide wizards dwh wizard dwh wizard vaultlinksat overview dwh wizard vaultlinksat is a dwh wizard parameter that controls whether the wizard generates link sat objects in data vault models. function use this setting to keep dwh wizard object generation consistent across the project. analyticscreator uses this value when no custom value is saved for the project. access the parameter is maintained from the parameters list in analyticscreator. how to access navigation tree parameters->list parameters toolbar options->parameter diagram not opened from the diagram. visual element parameter list default value 1 custom value not set. where it is used this parameter belongs to the dwh wizard group and is used when analyticscreator applies dwh wizard object generation. setting value technical parameter name dwhwizard_vaultlinksat default value 1 custom value not set. parameter groups group dwh wizard wizard defaults wizard related topics dwh wizard dwh wizard transname parameters previous dwh wizard fact calendar nextdwh wizard predefined transformations"}
,{"id":389872719058,"name":"DWH Wizard Predefined Transformations","type":"topic","path":"/docs/user-guide/wizards/dwh-wizard-function/parameters-dwh-wizard-dwh-wizard-predefined-transformations","breadcrumb":"User Guide › Wizards › DWH Wizard › DWH Wizard Predefined Transformations","description":"","searchText":"user guide wizards dwh wizard dwh wizard predefined transformations overview dwh wizard predefined transformations is a dwh wizard parameter that sets the predefined transformations option of the dwh wizard. function use this setting to keep dwh wizard object generation consistent across the project. analyticscreator uses this value when no custom value is saved for the project. access the parameter is maintained from the parameters list in analyticscreator. how to access navigation tree parameters->list parameters toolbar options->parameter diagram not opened from the diagram. visual element parameter list default value 2 custom value not set. where it is used this parameter belongs to the dwh wizard group and is used when analyticscreator applies dwh wizard object generation. setting value technical parameter name dwhwizard_predefined_transformations default value 2 custom value not set. parameter groups group dwh wizard wizard defaults wizard related topics dwh wizard dwh wizard linksat transname dwh wizard sap deltaq parameters previous dwh wizard vaultlinksat nextdwh wizard sap tables"}
,{"id":389872719059,"name":"DWH Wizard SAP Tables","type":"topic","path":"/docs/user-guide/wizards/dwh-wizard-function/parameters-dwh-wizard-dwh-wizard-sap-tables","breadcrumb":"User Guide › Wizards › DWH Wizard › DWH Wizard SAP Tables","description":"","searchText":"user guide wizards dwh wizard dwh wizard sap tables overview dwh wizard sap tables is a dwh wizard parameter that controls the search in sap tables. function use this setting to keep dwh wizard object generation consistent across the project. analyticscreator uses this value when no custom value is saved for the project. access the parameter is maintained from the parameters list in analyticscreator. how to access navigation tree parameters->list parameters toolbar options->parameter diagram not opened from the diagram. visual element parameter list default value 1 custom value not set. where it is used this parameter belongs to the dwh wizard group and is used when analyticscreator applies dwh wizard object generation. setting value technical parameter name dwhwizard_sap_tables default value 1 custom value not set. parameter groups group dwh wizard wizard defaults wizard related topics dwh wizard dwh wizard sap odp dwh wizard sat packagename parameters previous dwh wizard predefined transformations nextdwh wizard sap deltaq"}
,{"id":389872719060,"name":"DWH Wizard SAP Deltaq","type":"topic","path":"/docs/user-guide/wizards/dwh-wizard-function/parameters-dwh-wizard-dwh-wizard-sap-deltaq","breadcrumb":"User Guide › Wizards › DWH Wizard › DWH Wizard SAP Deltaq","description":"","searchText":"user guide wizards dwh wizard dwh wizard sap deltaq overview dwh wizard sap deltaq is a dwh wizard parameter that controls search in sap deltaq. function use this setting to keep dwh wizard object generation consistent across the project. analyticscreator uses this value when no custom value is saved for the project. access the parameter is maintained from the parameters list in analyticscreator. how to access navigation tree parameters->list parameters toolbar options->parameter diagram not opened from the diagram. visual element parameter list default value 0 custom value not set. where it is used this parameter belongs to the dwh wizard group and is used when analyticscreator applies dwh wizard object generation. setting value technical parameter name dwhwizard_sap_deltaq default value 0 custom value not set. parameter groups group dwh wizard wizard defaults wizard related topics dwh wizard dwh wizard predefined transformations dwh wizard sap odp parameters previous dwh wizard sap tables nextdwh wizard sap odp"}
,{"id":389872719061,"name":"DWH Wizard SAP ODP","type":"topic","path":"/docs/user-guide/wizards/dwh-wizard-function/parameters-dwh-wizard-dwh-wizard-sap-odp","breadcrumb":"User Guide › Wizards › DWH Wizard › DWH Wizard SAP ODP","description":"","searchText":"user guide wizards dwh wizard dwh wizard sap odp overview dwh wizard sap odp is a dwh wizard parameter that controls search in sap odp. function use this setting to keep dwh wizard object generation consistent across the project. analyticscreator uses this value when no custom value is saved for the project. access the parameter is maintained from the parameters list in analyticscreator. how to access navigation tree parameters->list parameters toolbar options->parameter diagram not opened from the diagram. visual element parameter list default value 1 custom value not set. where it is used this parameter belongs to the dwh wizard group and is used when analyticscreator applies dwh wizard object generation. setting value technical parameter name dwhwizard_sap_odp default value 1 custom value not set. parameter groups group dwh wizard wizard defaults wizard related topics dwh wizard dwh wizard sap deltaq dwh wizard sap tables parameters previous dwh wizard sap deltaq nexttransformations"}
,{"id":384138863824,"name":"Snapshot transformation wizard","type":"subsection","path":"/docs/user-guide/wizards/snapshot-transformation-wizard","breadcrumb":"User Guide › Wizards › Snapshot transformation wizard","description":"","searchText":"user guide wizards snapshot transformation wizard to create a snapshot transformation, select \"add → snapshot dimension\" from the diagram context menu. this will open the snapshot transformation wizard. ⚠️ note: only one snapshot dimension can exist in the data warehouse. as shown in the image below: parameters schema the schema in which the snapshot transformation resides. name the name assigned to the snapshot transformation. stars the data mart stars where this snapshot transformation will be included."}
,{"id":384159908072,"name":"Import wizard","type":"subsection","path":"/docs/user-guide/wizards/import-wizard","breadcrumb":"User Guide › Wizards › Import wizard","description":"","searchText":"user guide wizards import wizard to start the import wizard, use the source context menu: import status indicators sources marked with a \"!\" icon indicate that they have not yet been imported. attempting to launch the import wizard on a source that has already been imported will result in an error. typical import wizard window there is a typical import wizard window, as shown in the image below: options: source: the source that should be imported. target schema: the schema of the import table. target name: the name of the import table. package: the name of the ssis package where the import will be done. you can select an existing import package or add a new package name. click finish to proceed. the import definition window will open, allowing the configuration of additional import attributes and parameters, as shown in the image below: post-import actions refer to the \"import package\" description for more details. after creating a new import, refresh the diagram to reflect the changes, as shown in the image below:"}
,{"id":384140346566,"name":"Source Wizard","type":"subsection","path":"/docs/user-guide/wizards/source-wizard","breadcrumb":"User Guide › Wizards › Source Wizard","description":"","searchText":"user guide wizards source wizard the source wizard is used to add new data sources to the repository. to launch the source wizard, right-click on the \"sources\" branch of a connector in the context menu and select \"add source.\" source wizard functionality the appearance and functionality of the source wizard will vary depending on the selected source type (table or query): table: when selecting table as the data source, the wizard provides options to configure and view available tables. configuring a table data source when selecting \"table\" as the data source in the source wizard, click the \"apply\" button to display the list of available source tables. optionally, you can enter a schema or table filter to refine the results. configuration options: retrieve relations: enables the retrieval of relationships for the selected source table, if available. sap description language: specifies the language for object descriptions when working with sap sources. sap deltaq attributes: for sap deltaq sources, additional deltaq-specific attributes must be defined. configuring a query as a data source when selecting \"query\" as the data source in the source wizard, follow these steps: define schema and name: specify the schema and name of the source for the repository. enter the query: provide the query in the query language supported by the data source. test the query: click the “test query” button to verify its validity and ensure it retrieves the expected results. complete the configuration: click the “finish” button to add the new source to the repository. the source definition window will open, allowing further modifications if needed."}
,{"id":384159908073,"name":"Time transformation wizard","type":"subsection","path":"/docs/user-guide/wizards/time-transformation-wizard","breadcrumb":"User Guide › Wizards › Time transformation wizard","description":"","searchText":"user guide wizards time transformation wizard to create a time transformation, select \"add → time dimension\" from the diagram context menu. as shown in the image below: the time transformation wizard will then open, allowing you to configure a new time transformation: parameters schema the schema in which the time transformation resides. name the name assigned to the time transformation. period (minutes) the interval (in minutes) used to generate time dimension records. time-to-id function the macro function that converts a datetime value into the key value for the time dimension. use case: convert datetime fields in fact transformations into time dimension members. stars the data mart stars where the time transformation will be included."}
,{"id":384136118500,"name":"Historization wizard","type":"subsection","path":"/docs/user-guide/wizards/historization-wizard","breadcrumb":"User Guide › Wizards › Historization wizard","description":"","searchText":"user guide wizards historization wizard the historization wizard is used to historize a table or transformation. to start the historization wizard, use the object context menu: \"add\" → \"historization\" in the diagram, as shown in the image below: alternatively, the object context menu in the navigation tree can be used, as shown in the image below: parameters there is a typical historization wizard window, as shown in the image below: source table: the table that should be historized. target schema: the schema of the historized table. target name: the name of the historized table. package: the name of the ssis package where the historization will be done. you can select an existing historization package or add a new package name. historizing type: you can select between ssis package and stored procedure. scd type: the user can select between different historization types: scd 0, scd 1, and scd 2. empty record behavior: defines what should happen in case of a missing source record. use vault id as pk: if you are using datavault or mixed architecture, the user can use hashkeys instead of business keys to perform historization. after clicking \"finish\", the historization will be generated, and the diagram will be updated automatically. then, the user can select the generated historization package and optionally change some package properties (see \"historizing package\")."}
,{"id":384157771974,"name":"Persisting wizard","type":"subsection","path":"/docs/user-guide/wizards/persisting-wizard","breadcrumb":"User Guide › Wizards › Persisting wizard","description":"","searchText":"user guide wizards persisting wizard the content of any regular or manual transformation can be stored in a table, typically to improve access speed for complex transformations. persisting the transformation is managed through an ssis package. to persist a transformation, the user should select \"add → persisting\" from the object context menu in the diagram. as shown in the image below: persisting wizard options as shown in the image below: transformation: the name of the transformation to persist. persist table: the name of the table where the transformation will be persisted. this table will be created in the same schema as the transformation. persist package: the name of the ssis package that manages the persistence process."}
,{"id":384138863823,"name":"Transformation wizard","type":"subsection","path":"/docs/user-guide/wizards/transformation-wizard","breadcrumb":"User Guide › Wizards › Transformation wizard","description":"","searchText":"user guide wizards transformation wizard the transformation wizard is used to create a new transformation. to start it, use the object context menu and select: \"add → transformation\" in the diagram. typical transformation wizard window supported transformation types regular transformations: described in tabular form, results in a generated view. manual transformations: hand-created views defined manually by the user. script transformations: based on sql scripts, often calling stored procedures. external transformations: created outside analyticscreator as ssis packages. main page parameters type: transformation type: dimension: fullhist, creates unknown member, joinhisttype: actual fact: snapshot, no unknown member, joinhisttype: historical_to other: fullhist, no unknown member, joinhisttype: historical_to manual, external, script: as named schema: schema name name: transformation name historizing type: fullhist snapshothist snapshot actualonly none main table: only for regular transformations create unknown member: adds surrogate id = 0 (for dimensions) persist transformation: save view to a table persist table: name of persist table persist package: ssis package name result table: for external/script types ssis package: for external/script types table selection page allows selection of additional tables. tables must be directly or indirectly related to the main table. parameters table joinhisttype none actual historical_from historical_to full join options: all n:1 direct related all direct related all n:1 related all related use hash keys if available parameter page configure additional parameters (for regular transformations only). fields: none all key fields all fields field names (if duplicated): field[n] table_field field name appearance: no changes upper case lower case key fields null to zero: replaces null with 0 use friendly names as column names stars page stars: data mart stars for the transformation default transformations: no defaults (facts) all defaults (dimensions) selected defaults dependent tables: manage dependent tables script page used for script transformations. enter the sql logic that defines the transformation. insert into imp.lastpayment(businessentityid, ratechangedate, rate) select ph.businessentityid, ph.ratechangedate, ph.rate from ( select businessentityid, max(ratechangedate) lastratechangedate from [imp].[employeepayhistory] group by businessentityid ) t inner join [imp].[employeepayhistory] ph on ph.businessentityid = t.businessentityid and ph.ratechangedate = t.lastratechangedate"}
,{"id":384140346567,"name":"Calendar transformation wizard","type":"subsection","path":"/docs/user-guide/wizards/calendar-transformation-wizard","breadcrumb":"User Guide › Wizards › Calendar transformation wizard","description":"","searchText":"user guide wizards calendar transformation wizard to create a calendar transformation, select \"add → calendar dimension\" from the diagram context menu. as shown in the image below: the calendar transformation wizard will open. typically, only one calendar transformation is required in the data warehouse. as shown in the image below: parameters schema: the schema of the calendar transformation. name: the name of the calendar transformation. date from: the start date for the calendar. date to: the end date for the calendar. date-to-id function: the macro name that transforms a datetime value into the key value for the calendar dimension. this macro is typically used in fact transformations to map datetime fields to calendar dimension members. stars: the data mart stars where the calendar transformation will be included."}
,
{"id":383461199043,"name":"Reference","type":"category","path":"/docs/reference","breadcrumb":"Reference","description":"","searchText":"reference this section provides structured technical reference documentation for analyticscreator. it is intended for users who need detailed information about the user interface, entity types, entities, and configuration parameters. use this section when you already know which part of the application you want to understand and need a precise description of available objects, categories, and options. reference sections user interface reference information for the analyticscreator user interface and its structural elements. navigation and ui components windows, dialogs, and views interaction patterns open user interface entity types reference for the structural categories used in analyticscreator, such as connectors, sources, tables, transformations, packages, scripts, and schemas. connector and source categories table and transformation types schema, package, and script types open entity types entities reference for the concrete entities used in analyticscreator and their roles in modeling, generation, and execution. modeling objects execution-related entities generated object definitions open entities parameters reference for configuration parameters and settings that control generation, execution, historization, and other system behavior. object-specific parameters execution and generation settings configuration options open parameters how to use this section the reference section is organized by topic area rather than by workflow. use user interface when you need help locating or understanding specific interface elements use entity types when you need to understand the available structural categories in analyticscreator use entities when you need reference information about concrete objects used in the model use parameters when you need detailed information about settings and configurable behavior when to use reference instead of other sections use getting started for onboarding and step-by-step implementation flow use tutorials for guided example walkthroughs use reference for precise technical definitions and detailed lookup documentation key takeaway the reference section provides structured technical lookup documentation for analyticscreator user interface elements, entity categories, concrete entities, and configuration parameters. nextuser interface"}
,{"id":383461259458,"name":"User Interface","type":"section","path":"/docs/reference/user-interface","breadcrumb":"Reference › User Interface","description":"","searchText":"reference user interface the analyticscreator user interface is designed to support structured, metadata-driven development of data products. it provides a clear separation between modeling, configuration, and generation activities, enabling users to navigate complex data solutions efficiently. the interface is organized into multiple functional areas that work together: navigation & repository structure provides access to repositories, object groups, and individual objects. it reflects the logical organization of the data solution and supports collaboration across teams. design & modeling area the central workspace where users define sources, transformations, and data products. this includes visual representations of data flows and dependencies, supporting transparency and impact analysis. properties & configuration panels context-sensitive panels that allow detailed configuration of selected objects, including technical settings, mappings, and behavior definitions. toolbar offers quick access to key actions such as synchronization, validation, and deployment, enabling an efficient workflow from design to delivery. lineage & dependency visualization displays relationships between objects and data flows. users can explore upstream and downstream dependencies to understand the impact of changes. the interface follows a metadata-driven approach: users define logic and structure once, and analyticscreator generates the corresponding technical artifacts. this ensures consistency, traceability, and efficient lifecycle management across environments. reference areas toolbar the toolbar gives users direct access to the main functional areas of analyticscreator and serves as the primary entry point for day-to-day work across the platform. open toolbar navigation tree the navigation tree provides the primary structural view of an analyticscreator repository and helps users browse objects by area, layer, and responsibility. open navigation tree dataflow diagram the dataflow diagram section explains the object types that appear in analyticscreator's visual dataflow and how they represent movement, transformation, and delivery across the solution. open dataflow diagram pages the pages section documents the page-level object views that users open to configure analyticscreator components in detail. open pages lists the lists section groups the list views and registry-style pages used to browse, compare, and manage collections of analyticscreator objects. open lists dialogs the dialogs section covers the focused pop-up workflows that support configuration, validation, search, preview, synchronization, and repository maintenance in analyticscreator. open dialogs wizards the wizards section documents the guided setup flows that help users create common analyticscreator objects and modeling patterns with structured input steps. open wizards previous reference nexttoolbar"}
,{"id":383509396676,"name":"Toolbar","type":"subsection","path":"/docs/reference/user-interface/toolbar","breadcrumb":"Reference › User Interface › Toolbar","description":"","searchText":"reference user interface toolbar the toolbar gives users direct access to the main functional areas of analyticscreator and serves as the primary entry point for day-to-day work across the platform. its sections follow the typical implementation flow, from repository and source management through warehouse design, data product preparation, process generation, deployment, configuration, and support. available topics file covers core workspace actions such as opening, saving, and managing repositories and project files. open file sources explains how to configure source systems, maintain connections, and import or refresh source metadata. open sources dwh describes the toolbar area used to design warehouse structures, transformations, and historization logic. open dwh data mart shows the commands used to build analytics-ready data products and business-facing reporting models. open data mart etl summarizes the toolbar functions related to generating and managing data movement and transformation workflows. open etl deployment documents the options for packaging, generating, and deploying analyticscreator artifacts to target environments. open deployment options covers application and repository settings that control environment behavior and authoring preferences. open options help points users to documentation, guidance, and support-oriented resources available from the toolbar. open help how to use this section start with file and sources when setting up or opening a repository and connecting source systems. use dwh and data mart when defining warehouse logic and shaping analytical output models. move to etl and deployment when you need to generate, run, or release implementation artifacts. use options for configuration changes and help when you need documentation or support guidance. key takeaway the toolbar section organizes analyticscreator commands by workflow stage, making it easier to move from repository setup and source ingestion to modeling, process generation, deployment, and support. previous user interface nextfile"}
,{"id":379959516358,"name":"File","type":"topic","path":"/docs/reference/user-interface/toolbar/file","breadcrumb":"Reference › User Interface › Toolbar › File","description":"","searchText":"reference user interface toolbar file overview the file tab in the toolbar contains commands for managing data warehouse repositories, managing data warehouse project files, restoring and saving backups, synchronizing data warehouse metadata, and finding objects on the active diagram. its command groups are repository, project, and backup and restore. function use this tab to create or connect to a data warehouse repository, start the dwh wizard, synchronize data warehouse metadata, load or save data warehouse project files, restore backups, save backups, and find objects on the active diagram. access the file tab is available from the main analyticscreator toolbar. some commands require an active data warehouse repository connection before they can be used. how to access navigation tree not direct. this page documents toolbar access. toolbar file tab diagram not direct. this page documents toolbar access. visual element file tab in the toolbar. screen overview the file tab lists the command labels below. repository, project, and backup and restore are command groups, not individual commands. id property description 1 home returns to the main home view when a repository is connected. 2 dwh wizard starts the dwh wizard for creating data warehouse objects from source metadata. 3 sync dwh synchronizes data warehouse metadata. the command changes to a stop action while synchronization is running. 4 new prompts for a repository name and creates a new repository configuration. 5 connect connects to an existing repository and updates it when the repository version requires it. 6 load project loads an analyticscreator project from a selected folder. 7 save project saves the current project structure to a folder. 8 load from file restores repository data from a local backup file. 9 save to file saves the current repository to a local backup file. 10 load from cloud restores repository data from a cloud-stored backup. 11 save to cloud saves the current repository as a cloud-stored backup. 12 find on diagram opens the object search flow for the active architecture diagram. related topics dwh wizard dwh sources options previous toolbar nextsources"}
,{"id":380042415310,"name":"Sources","type":"topic","path":"/docs/reference/user-interface/toolbar/sources","breadcrumb":"Reference › User Interface › Toolbar › Sources","description":"","searchText":"reference user interface toolbar sources overview the sources toolbar tab groups connector, source, and source-reference commands. function use the tab to return home, open connector, source, and reference lists, or start a new connector flow. the new connector commands support adding a connector manually or importing connector information from a file or cloud location. access open the sources tab from the application toolbar. how to access navigation tree not opened from the navigation tree. this is a toolbar tab. toolbar toolbar -> sources. diagram not opened directly from the diagram. visual element sources toolbar tab screen overview id property description 1 home returns to the start page. 2 list group of connector, source, and reference list commands. 3 connectors opens the connectors list. 4 sources opens the sources list. 5 references opens the source references list. 6 new connector group of commands for creating or importing connector definitions. 7 add starts manual connector creation. 8 import from file imports connector information from a local file. 9 import from cloud imports connector information from a cloud location. related topics connectors list page sources list page source references list page connector page previous file nextdwh"}
,{"id":380044750015,"name":"DWH","type":"topic","path":"/docs/reference/user-interface/toolbar/dwh","breadcrumb":"Reference › User Interface › Toolbar › DWH","description":"","searchText":"reference user interface toolbar dwh overview the dwh toolbar tab opens core data warehouse lists and maintenance pages. function use the dwh toolbar tab to open the commands listed in its ribbon groups. commands are enabled according to the current connection and application context. access open the dwh tab from the application toolbar. how to access navigation tree not direct. this is a toolbar tab. toolbar toolbar -> dwh. diagram not opened directly from the diagram. visual element dwh toolbar tab screen overview id property description 1 home returns to the start page. 2 list group of data warehouse list commands. 3 layers opens the layers list. 4 schemas opens the schemas list. 5 tables opens the tables list. 6 indexes opens the indexes list. 7 references opens the references list. 8 macros opens the macros list. 9 predefined trans. opens the predefined transformations list. 10 snapshots opens the snapshots list. related topics dwh toolbar data mart toolbar etl toolbar options toolbar previous sources nextdata mart"}
,{"id":380044818681,"name":"Data mart","type":"topic","path":"/docs/reference/user-interface/toolbar/data-mart","breadcrumb":"Reference › User Interface › Toolbar › Data mart","description":"","searchText":"reference user interface toolbar data mart overview the data mart toolbar tab provides quick access to semantic model and data mart objects. function use the data mart toolbar tab to open the commands listed in its command groups. commands are enabled according to the current connection and application context. access open the data mart tab from the application toolbar. how to access navigation tree not direct. this is a toolbar tab. toolbar toolbar -> data mart. diagram not opened directly from the diagram. visual element data mart toolbar tab screen overview id property description 1 home returns to the start page. 2 list group of data mart list commands. 3 galaxies opens the galaxies list. 4 stars opens the stars list. 5 hierarchies opens the hierarchies list. 6 roles opens the olap roles list. 7 partitions opens the olap partitions list. 8 models opens the models list. related topics dwh toolbar data mart toolbar etl toolbar options toolbar previous dwh nextetl"}
,{"id":380044750017,"name":"ETL","type":"topic","path":"/docs/reference/user-interface/toolbar/etl","breadcrumb":"Reference › User Interface › Toolbar › ETL","description":"","searchText":"reference user interface toolbar etl overview the etl toolbar tab opens package, script, import, historization, transformation, and new-dimension workflows. function use the etl toolbar tab to open the commands listed in its ribbon groups. commands are enabled according to the current connection and application context. access open the etl tab from the application toolbar. how to access navigation tree not direct. this is a toolbar tab. toolbar toolbar -> etl. diagram not opened directly from the diagram. visual element etl toolbar tab screen overview id property description 1 home returns to the start page. 2 list group of etl list commands. 3 packages opens the packages list. 4 scripts opens the sql script list. 5 imports opens the imports list. 6 historizations opens the historizations list. 7 transformations opens the transformations list. 8 new group of new etl object commands. 9 new transformation starts the create transformation wizard. 10 calendar dimension starts the create calendar dimension wizard. 11 time dimension starts the create time dimension wizard. 12 snapshot dimension starts the create snapshot dimension wizard. related topics dwh toolbar data mart toolbar etl toolbar options toolbar previous data mart nextdeployment"}
,{"id":380044819646,"name":"Deployment","type":"topic","path":"/docs/reference/user-interface/toolbar/deployment","breadcrumb":"Reference › User Interface › Toolbar › Deployment","description":"","searchText":"reference user interface toolbar deployment overview the deployment toolbar tab opens deployment package generation and deployment-related workflows. function use the deployment toolbar tab to open the commands listed in its ribbon groups. commands are enabled according to the current connection and application context. access open the deployment tab from the application toolbar. how to access navigation tree not direct. this is a toolbar tab. toolbar toolbar -> deployment. diagram not opened directly from the diagram. visual element deployment toolbar tab screen overview id property description 1 home returns to the start page. 2 deployment package opens the deployment package workflow. related topics dwh toolbar data mart toolbar etl toolbar options toolbar previous etl nextoptions"}
,{"id":380044819647,"name":"Options","type":"topic","path":"/docs/reference/user-interface/toolbar/options","breadcrumb":"Reference › User Interface › Toolbar › Options","description":"","searchText":"reference user interface toolbar options overview the options toolbar tab opens user, repository, interface, parameter, and encrypted-string settings. function use the options toolbar tab to open the commands listed in its ribbon groups. commands are enabled according to the current connection and application context. access open the options tab from the application toolbar. how to access navigation tree not direct. this is a toolbar tab. toolbar toolbar -> options. diagram not opened directly from the diagram. visual element options toolbar tab screen overview id property description 1 home returns to the start page. 2 user groups opens user group management. 3 dwh settings opens data warehouse settings. 4 interface opens interface settings. 5 parameter opens the parameter list. 6 encrypted strings opens encrypted string management. related topics dwh toolbar data mart toolbar etl toolbar options toolbar previous deployment nexthelp"}
,{"id":380044750021,"name":"Help","type":"topic","path":"/docs/reference/user-interface/toolbar/help","breadcrumb":"Reference › User Interface › Toolbar › Help","description":"","searchText":"reference user interface toolbar help overview the help toolbar tab opens export, learning, community, version, license, and about commands. function use the help toolbar tab to open the commands listed in its ribbon groups. commands are enabled according to the current connection and application context. access open the help tab from the application toolbar. how to access navigation tree not direct. this is a toolbar tab. toolbar toolbar -> help. diagram not opened directly from the diagram. visual element help toolbar tab screen overview id property description 1 home returns to the start page. 2 export group of documentation export commands. 3 export to visio exports the model diagram to visio. 4 export to word exports documentation to word. 5 internet group of online help links. 6 wikipedia opens the analyticscreator wiki or reference resource. 7 videos opens analyticscreator video resources. 8 community opens the community resource. 9 version history opens version history information. 10 eula opens license terms. 11 about opens the about dialog. related topics dwh toolbar data mart toolbar etl toolbar options toolbar previous options nextnavigation tree"}
,{"id":383509396677,"name":"Navigation tree","type":"subsection","path":"/docs/reference/user-interface/navigation-tree","breadcrumb":"Reference › User Interface › Navigation tree","description":"","searchText":"reference user interface navigation tree the navigation tree provides the primary structural view of an analyticscreator repository and helps users browse objects by area, layer, and responsibility. it is the fastest way to move across repository components, inspect relationships, and open the exact object or configuration area needed during design, maintenance, and troubleshooting. available topics connectors explains how connector objects appear in the tree and how they organize source-system access points. open connectors layers describes how repository layers structure objects and separate modeling responsibilities across the solution. open layers packages shows how package objects are grouped in the tree for orchestration, movement, and process control. open packages indexes covers where index definitions appear and how they are organized within the repository hierarchy. open indexes roles documents the tree placement of role-related objects used for access and semantic model control. open roles galaxies explains how galaxy structures are represented and accessed from the navigation tree. open galaxies hierarchies shows how hierarchy objects are grouped in the tree for analytical model navigation. open hierarchies partitions describes where partition definitions live in the tree and how they support model organization. open partitions parameters explains how technical and functional parameters are exposed for repository configuration and reuse. open parameters macros documents the navigation-tree location of reusable macros and shared logic components. open macros object scripts covers how object-level scripts are organized for targeted execution and automation tasks. open object scripts filters shows how filter definitions appear in the tree and support selective modeling behavior. open filters predefined transformations explains where predefined transformation templates are stored and accessed from the tree. open predefined transformations snapshots describes the tree location of snapshot-related objects used for point-in-time handling. open snapshots deployments documents how deployment objects are grouped for release preparation and execution. open deployments groups shows how group structures help organize large repositories and related object collections. open groups models explains where model objects appear in the tree and how they anchor business-facing structures. open models transformations describes how transformation logic is surfaced in the tree for editing, tracing, and maintenance. open transformations how to use this section use the tree to move quickly between repository object families instead of searching manually across dialogs and designers. start with structural areas such as layers, parameters, and groups when orienting yourself inside a project. use object-specific branches such as connectors, packages, deployments, and transformations when working on a focused implementation task. use the tree as the operational backbone of the repository, then open individual topics here to understand the behavior of each object area in detail. key takeaway the navigation tree organizes analyticscreator repository objects into a clear operational hierarchy, making it the central navigation surface for browsing, opening, and managing solution components. previous help nextconnectors"}
,{"id":380121766108,"name":"Connectors","type":"topic","path":"/docs/reference/user-interface/navigation-tree/connectors","breadcrumb":"Reference › User Interface › Navigation tree › Connectors","description":"","searchText":"reference user interface navigation tree connectors overview the connectors menu in analyticscreator defines metadata for establishing a connection to a source system. each connector includes a name, a source type, and a connection string. these connections are used in etl packages to access external data sources during data warehouse generation. function connectors allow analyticscreator to integrate with relational databases and other supported systems. the connection string is stored in the project metadata and referenced during package execution. each connector is project-specific and can be reused across multiple packages or layers. access connectors are managed under the sources section in the analyticscreator user interface. all defined connectors are listed in a searchable grid, and new entries can be created or deleted from this screen. selecting new opens a connector definition form with metadata fields and a connection string editor. how to access navigation tree connectors → connector → edit connector; connectors → add connector toolbar sources → add diagram not applicable visual element {searchconnectors} → connector → double-click screen overview the first image below shows the main connectors interface. the second shows the editor that appears when a new connector is created. related topics sources connector types refresh source metadata create source previous navigation tree nextlayers"}
,{"id":380121766109,"name":"Layers","type":"topic","path":"/docs/reference/user-interface/navigation-tree/layers","breadcrumb":"Reference › User Interface › Navigation tree › Layers","description":"","searchText":"reference user interface navigation tree layers overview the layers feature in analyticscreator defines the logical and sequential structure in which metadata objects are grouped and generated. each object in a project is assigned to a layer, which determines its build order and visibility during solution generation. function layers represent vertical slices in a project's architecture, such as source, staging, persisted staging, transformation, data warehouse - core, or datamart. one layer can have one or more schemas associated with it. they are used to control: object assignment and isolation layers define where objects belong and keep architectural responsibilities clearly separated. deployment sequencing layers control the order in which structures are generated and deployed across environments. selective generation specific parts of the solution can be included or excluded based on layer configuration. dependency resolution layer order influences build-time logic and helps resolve dependencies between generated objects. layer configuration impacts how analyticscreator generates the sql database schema, azure data factory pipelines, and semantic models. access layers are accessible from the dwh section. a dedicated layers panel displays all defined layers, their order, and their assignment status. how to access navigation tree data warehouse -> layers -> edit layer toolbar dwh -> layers diagram not direct. use the navigation tree or dwh toolbar list command. visual element list layers page screen overview the image below shows the list layers interface with columns labeled for easy identification. id property description 1 name name of the layer used to identify it within the project structure. 2 seqnr defines the sequence number of the layer and controls its display order in the lineage. 3 description optional field used to provide a more detailed description of the layer. behavior execution order layers are executed in the defined top-down order. generation scope disabling a layer excludes its objects from generation. object assignment each object must belong to one and only one layer. build influence layers influence sql build context and pipeline generation. usage context layers are typically aligned with logical data architecture phases. common usage includes separating ingestion, transformation, modeling, and reporting responsibilities. notes layer configurations are stored within the project metadata. changes to layer order or status require regeneration of the solution. layer visibility and behavior apply across all deployment targets. related topics schema table transformation predefined transformations previous connectors nextpackages"}
,{"id":380121766110,"name":"Packages","type":"topic","path":"/docs/reference/user-interface/navigation-tree/packages","breadcrumb":"Reference › User Interface › Navigation tree › Packages","description":"","searchText":"reference user interface navigation tree packages overview the packages navigation tree branch opens package definitions and package-type branches. function use the branch or etl toolbar command to open the package list. the list shows package name, package type, manual creation, external launch, and description with actions for creating or deleting packages. access open the packages branch from the navigation tree or use the etl toolbar tab. how to access navigation tree packages -> list packages; packages -> [package type] -> list packages. toolbar etl -> packages. diagram not opened directly from the diagram. visual element packages navigation branch and list screen overview related topics etl toolbar packages list page package page package types previous layers nextindexes"}
,{"id":380121766111,"name":"Indexes","type":"topic","path":"/docs/reference/user-interface/navigation-tree/indexes","breadcrumb":"Reference › User Interface › Navigation tree › Indexes","description":"","searchText":"reference user interface navigation tree indexes overview the indexes navigation tree branch opens table index definitions. function use the branch or dwh toolbar command to open the index list. the list shows schema, table, index name, clustered, unique, and primary-key settings with new and delete actions. access open the indexes branch from the navigation tree or use the dwh toolbar tab. how to access navigation tree indexes -> list indexes. toolbar dwh -> indexes. diagram not opened directly from the diagram. visual element indexes navigation branch and list screen overview related topics dwh toolbar index page tables list page schemas list page previous packages nextroles"}
,{"id":380121767100,"name":"Roles","type":"topic","path":"/docs/reference/user-interface/navigation-tree/roles","breadcrumb":"Reference › User Interface › Navigation tree › Roles","description":"","searchText":"reference user interface navigation tree roles overview the roles navigation tree branch opens data mart role definitions. function use the branch or data mart toolbar command to open the role list. the list shows role name and description, with actions for deleting, duplicating, or creating roles. access open the roles branch from the navigation tree or use the data mart toolbar tab. how to access navigation tree roles -> list roles. toolbar data mart -> roles. diagram not opened directly from the diagram. visual element roles navigation branch and list screen overview related topics data mart toolbar olap role page models navigation tree login dialog previous indexes nextgalaxies"}
,{"id":380121783543,"name":"Galaxies","type":"topic","path":"/docs/reference/user-interface/navigation-tree/galaxies","breadcrumb":"Reference › User Interface › Navigation tree › Galaxies","description":"","searchText":"reference user interface navigation tree galaxies overview the galaxies navigation tree branch opens galaxy definitions used in data mart organization. function use the branch or toolbar command to open the galaxy list. the list supports searching and editing galaxy name and description values before saving or cancelling changes. access open the galaxies branch from the navigation tree or use the data mart toolbar tab. how to access navigation tree galaxies -> list galaxies. toolbar data mart -> galaxies. diagram not opened directly from the diagram. visual element galaxies navigation branch and list screen overview related topics data mart toolbar stars list page models navigation tree hierarchies navigation tree previous roles nexthierarchies"}
,{"id":380121783544,"name":"Hierarchies","type":"topic","path":"/docs/reference/user-interface/navigation-tree/hierarchies","breadcrumb":"Reference › User Interface › Navigation tree › Hierarchies","description":"","searchText":"reference user interface navigation tree hierarchies overview the hierarchies navigation tree branch opens hierarchy definitions for data mart structures. function use the branch or toolbar command to open the hierarchy list. the list shows schema, table, hierarchy name, clustered setting, and actions for creating or deleting hierarchy rows. access open the hierarchies branch from the navigation tree or use the data mart toolbar tab. how to access navigation tree hierarchies -> list hierarchies. toolbar data mart -> hierarchies. diagram not opened directly from the diagram. visual element hierarchies navigation branch and list screen overview related topics data mart toolbar olap hierarchy page tables list page models navigation tree previous galaxies nextpartitions"}
,{"id":380121784533,"name":"Partitions","type":"topic","path":"/docs/reference/user-interface/navigation-tree/partitions","breadcrumb":"Reference › User Interface › Navigation tree › Partitions","description":"","searchText":"reference user interface navigation tree partitions overview the partitions navigation tree branch opens partition definitions for large table refresh and management scenarios. function use the branch or data mart toolbar command to open the partition list. the list shows fact table and partition name, with actions for deleting, duplicating, or creating partition definitions. access open the partitions branch from the navigation tree or use the data mart toolbar tab. how to access navigation tree partitions -> list partitions. toolbar data mart -> partitions. diagram not opened directly from the diagram. visual element partitions navigation branch and list screen overview related topics data mart toolbar olap partition page tables list page models navigation tree previous hierarchies nextparameters"}
,{"id":380121767101,"name":"Parameters","type":"topic","path":"/docs/reference/user-interface/navigation-tree/parameters","breadcrumb":"Reference › User Interface › Navigation tree › Parameters","description":"","searchText":"reference user interface navigation tree parameters overview parameters are configuration settings that control technical behavior, naming rules, deployment options, and other system or project-specific functions across the application. each parameter provides a technical or project-related setting that influences areas such as logging, naming conventions, deployment behavior, storage settings, and provider configuration. function the parameters feature is used to review default parameter values and define custom values for the current project. changes made in this area affect how analyticscreator behaves during modeling, generation, deployment, and related technical processing. access parameters are available from the analyticscreator navigation tree and the options ribbon tab. how to access navigation tree parameters toolbar options -> parameter diagram not opened from a diagram. use the options ribbon tab. visual element parameter settings page opened from the options ribbon. screen overview the parameters screen contains a parameter list with default values and optional custom values. related topics options dwh settings interface settings dwh previous partitions nextmacros"}
,{"id":380121767102,"name":"Macros","type":"topic","path":"/docs/reference/user-interface/navigation-tree/macros","breadcrumb":"Reference › User Interface › Navigation tree › Macros","description":"","searchText":"reference user interface navigation tree macros overview the macros navigation tree branch opens reusable macro definitions. function use the branch or dwh toolbar command to open the macro list. the list shows macro name and language, with actions to create or delete macro definitions. access open the macros branch from the navigation tree or use the dwh toolbar tab. how to access navigation tree macros -> list macros. toolbar dwh -> macros. diagram not opened directly from the diagram. visual element macros navigation branch and list screen overview related topics dwh toolbar macro page predefined transformations navigation tree transformations list page previous parameters nextobject scripts"}
,{"id":380121784534,"name":"Object scripts","type":"topic","path":"/docs/reference/user-interface/navigation-tree/object-scripts","breadcrumb":"Reference › User Interface › Navigation tree › Object scripts","description":"","searchText":"reference user interface navigation tree object scripts overview object scripts is the navigation-tree entry for reusable scripts that are attached to analyticscreator objects. use it to organize scripts by object scope, open the object-script list, create a new script, edit existing scripts, run eligible scripts, or remove scripts that are no longer needed. function the object scripts node sits under the data warehouse root. it provides refresh, list, and add commands for object-script maintenance, then expands into script groupings such as all scripts, table-independent scripts, and object-specific branches. access open the object scripts node from the data warehouse navigation tree. use the node context menu to refresh the branch, list object scripts, or add a script. expand a script grouping to reach existing script items, then use a script item's context menu to edit, run, or delete the script. how to access navigation tree data warehouse -> object scripts toolbar not opened directly from the toolbar. use the object scripts node or an object context command. diagram not opened directly from the diagram. manage object scripts from the navigation tree and object context menus. visual element object scripts navigation-tree node, object scripts list page, object script page, and run object script wizard screen overview related topics object scripts list page object script page run object script wizard groups navigation tree previous macros nextfilters"}
,{"id":380121784535,"name":"Filters","type":"topic","path":"/docs/reference/user-interface/navigation-tree/filters","breadcrumb":"Reference › User Interface › Navigation tree › Filters","description":"","searchText":"reference user interface navigation tree filters overview filters is the navigation-tree entry for saved diagram filters in analyticscreator. use it to store the current diagram filter, reopen saved filters, apply a saved filter to the diagram, or delete saved filters that are no longer needed. function the filters node sits under the data warehouse root. it lists saved filters by name and provides the command that stores the current diagram filter as a reusable saved filter. store current filter saves the objects currently shown in the actual filter field. analyticscreator asks for a filter name, prevents empty names and duplicate filter names, and stores the selected diagram objects under that name. a saved filter can later be opened from the filters node and applied to the diagram. object context menus can set or add to the diagram filter. the group selector narrows the diagram by object group, and the actual filter field shows the object names currently included in the active diagram filter. find on diagram is available from the file toolbar for locating objects in the diagram. access open the filters node from the data warehouse navigation tree. use the node context menu to refresh the tree or store the current diagram filter. use a saved filter's context menu to apply or delete it. how to access navigation tree data warehouse -> filters toolbar file -> find on diagram. saved filters are managed from the navigation tree. diagram object context menu -> set diagram filter or add to diagram filter. visual element filters navigation-tree node and actual filter field screen overview related topics dataflow diagram filters groups navigation tree object scripts navigation tree deployments navigation tree previous object scripts nextpredefined transformations"}
,{"id":380121767103,"name":"Predefined transformations","type":"topic","path":"/docs/reference/user-interface/navigation-tree/predefined-transformations","breadcrumb":"Reference › User Interface › Navigation tree › Predefined transformations","description":"","searchText":"reference user interface navigation tree predefined transformations overview the predefined transformations navigation tree branch opens reusable transformation templates. function use the branch or dwh toolbar command to open predefined transformation templates. the editor stores the check statement, transformation statement, evaluated preview, and allowed keywords used by the template. access open the predefined transformations branch from the navigation tree or use the dwh toolbar tab. how to access navigation tree predefined transformations -> list predefined transformations. toolbar dwh -> predefined transformations. diagram not opened directly from the diagram. visual element predefined transformations navigation branch and editor screen overview related topics dwh toolbar predefined transformation page transformations list page transformation page previous filters nextsnapshots"}
,{"id":380121767104,"name":"Snapshots","type":"topic","path":"/docs/reference/user-interface/navigation-tree/snapshots","breadcrumb":"Reference › User Interface › Navigation tree › Snapshots","description":"","searchText":"reference user interface navigation tree snapshots overview the snapshots navigation tree branch opens snapshot definitions. function use the branch or etl toolbar command to open the snapshot list. the list shows snapshot name, update statement, and description, with actions for creating or deleting snapshots. how to access navigation tree snapshots -> list snapshots. toolbar etl -> snapshots. diagram not opened directly from the diagram. visual element snapshots navigation branch and list screen overview related topics etl toolbar snapshot page snapshot group page create snapshot dimension wizard previous predefined transformations nextdeployments"}
,{"id":380121767105,"name":"Deployments","type":"topic","path":"/docs/reference/user-interface/navigation-tree/deployments","breadcrumb":"Reference › User Interface › Navigation tree › Deployments","description":"","searchText":"reference user interface navigation tree deployments overview deployments is the navigation-tree entry for deployment definitions in analyticscreator. use it to refresh deployment-related navigation, open the deployment list, or create a new deployment configuration. function the deployments node sits under the data warehouse root in the navigation tree. its commands provide the main navigation path for managing deployment definitions from the project tree. list deployments opens the searchable deployments list, where users can find deployments by name or description and double-click a row to edit or run it. add deployment opens the deployment page for a new deployment. refresh reloads the navigation tree after deployment changes. access open the deployments node from the data warehouse navigation tree. use the node's context menu to refresh the tree, list deployments, or add a deployment. how to access navigation tree data warehouse -> deployments toolbar not opened directly from the toolbar. use the deployments node in the navigation tree. diagram not opened directly from the diagram. use the navigation tree to manage deployments. visual element deployments navigation-tree node screen overview related topics deployments list page deployment page deployment toolbar groups navigation tree previous snapshots nextgroups"}
,{"id":380121767106,"name":"Groups","type":"topic","path":"/docs/reference/user-interface/navigation-tree/groups","breadcrumb":"Reference › User Interface › Navigation tree › Groups","description":"","searchText":"reference user interface navigation tree groups overview groups is the navigation-tree entry for object groups in analyticscreator. use it to maintain named groups, review the objects assigned to a group, and apply a group as the active diagram scope. function the groups node sits under the data warehouse root. it lists groups by name and provides commands for maintaining group definitions from the project tree. list groups and add group open the groups dialog, where users can create or edit group records, maintain descriptions, define workflow-related settings, and save or cancel changes. existing group items also provide commands to edit the group, list the objects assigned to it, lock or unlock the group, delete it, or apply it to the diagram. set diagram filter selects the group in the main window's group selector and refreshes the diagram so the model is shown through that group scope. a locked group displays the user who currently holds the lock, helping teams avoid conflicting group edits. access open the groups node from the data warehouse navigation tree. use the node context menu to refresh the branch, list groups, or add a group. use an existing group's context menu to manage that group or apply it to the diagram. how to access navigation tree data warehouse -> groups toolbar not opened directly from the toolbar. use the groups node or the main window group selector. diagram use a group item's set diagram filter command or the group selector to filter the diagram. visual element groups navigation-tree node, groups dialog, and list group objects page screen overview related topics object groups in the dataflow diagram object groups dialog filters navigation tree object scripts navigation tree previous deployments nextmodels"}
,{"id":380121784536,"name":"Models","type":"topic","path":"/docs/reference/user-interface/navigation-tree/models","breadcrumb":"Reference › User Interface › Navigation tree › Models","description":"","searchText":"reference user interface navigation tree models overview the models navigation tree branch opens data mart model definitions. function use the branch or data mart toolbar command to open the model list. the list supports searching and editing model name and description values before saving or cancelling changes. access open the models branch from the navigation tree or use the data mart toolbar tab. how to access navigation tree models -> list models. toolbar data mart -> models. diagram not opened directly from the diagram. visual element models navigation branch and list screen overview id property description 1 models navigation branch for model definitions. 2 list models opens the model list. 3 search criteria area used to filter model rows. 4 search applies the current search criteria. 5 name business name shown in lists and navigation. 6 description business description or notes for the object. 7 save saves the current definition, refreshes the relevant navigation or list, and keeps the page consistent with the saved state. 8 cancel leaves the page without continuing the current edit. related topics data mart toolbar model dimension page model fact page galaxies navigation tree previous groups nexttransformations"}
,{"id":383509174508,"name":"Dataflow diagram","type":"subsection","path":"/docs/reference/user-interface/dataflow-diagram","breadcrumb":"Reference › User Interface › Dataflow diagram","description":"","searchText":"reference user interface dataflow diagram the dataflow diagram section explains the object types that appear in analyticscreator's visual dataflow and how they represent movement, transformation, and delivery across the solution. use these topics to understand how operational objects relate to one another in the diagram and how to read the pipeline from filtering and grouping through storage, historization, and export. available topics search search is a dataflow diagram feature used to quickly locate objects by entering keywords or phrases in the search bar. open search filters a filter is a reusable view definition used in the dataflow diagram to limit the visible objects based on selected criteria such as object types, layers, schemas, or groups. open filters object groups object groups are used to organize objects such as sources, tables, and transformations into reusable groups. open object groups layers a layer is a logical architectural slice used to group metadata objects and define their build order and visibility in the model. open layers source in analyticscreator, a source is a metadata object that describes external data. open source table a table is a metadata object that represents a database table or view within the data warehouse. open table transformation a transformation is a metadata object used to define how data is processed in the staging and warehouse layers. open transformation fact in analyticscreator, a fact is a metadata object used to model quantitative business data for analytical processing in the data warehouse and data mart. open fact dimension a dimension is a metadata object used in the data warehouse model to organize descriptive business data and support analysis of facts through shared business context. open dimension import shows how import objects appear in the dataflow diagram and how they bring source data into the warehouse pipeline. open import historization a historization is a metadata object used to track changes of a table or transformation over time in the data warehouse model. open historization persisting a persisting object is a metadata object used to store the content of a regular or manual transformation in a table to improve access speed for complex transformations. open persisting export shows how export objects appear in the dataflow diagram and how they deliver modeled data to downstream targets. open export how to use this section start with search, filters, and object groups when you need to orient yourself inside a large visual model. use layers, source, table, and transformation to follow the structural path of data through the warehouse. use fact, dimension, import, historization, and persisting to understand the implementation role of each diagram element. use export when the flow continues beyond internal warehouse processing into downstream delivery scenarios. key takeaway the dataflow diagram section helps readers interpret analyticscreator diagrams as end-to-end operational models, connecting each object type to its role in the data pipeline. previous transformations nextsearch"}
,{"id":386694025440,"name":"Search","type":"topic","path":"/docs/reference/user-interface/dataflow-diagram/dataflow-diagram-search","breadcrumb":"Reference › User Interface › Dataflow diagram › Search","description":"","searchText":"reference user interface dataflow diagram search overview search helps users find and focus objects that are already shown on the dataflow diagram canvas. it is useful when a model contains many sources, tables, transformations, packages, and relationships and the user needs to jump directly to a known object. function the find on diagram command opens the search dialog for the active dataflow diagram. users enter a keyword, choose whether the match must use the whole word or match case, and move through results with find next (f3) or find previous (shift+f3). search compares the keyword with visible diagram object names and friendly names. when a match is found, the diagram scrolls to that object and highlights its label. repeating the search moves to the next or previous matching object. if no match is found, analyticscreator shows a message that the keyword was not found. search works together with diagram navigation and filters. navigation-tree commands can locate an object on the diagram, while diagram filter commands narrow the canvas first and then search helps jump within the visible result set. access search is available from the file toolbar while the dataflow diagram is open. it can also be started from the keyboard, and object-focused navigation can be started from source, table, or transformation nodes in the navigation tree. how to access navigation tree source, table, or transformation context menu -> locate in diagram toolbar file -> find on diagram diagram press ctrl+f, f3, or shift+f3 while the diagram is active. visual element search dialog and highlighted diagram label screen overview related topics filters object groups layers transformations previous dataflow diagram nextfilters"}
,{"id":386694025434,"name":"Filters","type":"topic","path":"/docs/reference/user-interface/dataflow-diagram/dataflow-diagram-filters","breadcrumb":"Reference › User Interface › Dataflow diagram › Filters","description":"","searchText":"reference user interface dataflow diagram filters overview filters in the dataflow diagram control which objects are shown in the analyticscreator architecture view. use them to focus the diagram on a selected object, add related objects to the current view, save a useful diagram selection, or reopen a saved selection later. function a diagram filter is a working selection of objects. when you set a filter from an object, the diagram refreshes around that object. when you add to a filter, the selected object is added to the current selection instead of replacing it. the main window shows the active context beside the diagram: the selected group, the diagram expansion controls, the selected object, and the actual filter text. the actual filter field lists the object names currently included in the filter. filters can be stored from the diagram or from the filters entry in the navigation tree. a stored filter can then be applied from the navigation tree to reopen the same focused diagram view, which is useful when reviewing a specific dataflow repeatedly. access open the dataflow diagram from the dwh area, then use an object context menu, the diagram context menu, or the filters entry in the navigation tree. the file ribbon also provides find on diagram for locating objects before filtering. how to access navigation tree use filters -> store current filter, or use a saved filter with apply filter. toolbar use file -> find on diagram to locate an object before setting or extending the filter. diagram use dataflow diagram -> object context menu -> set filter or add to filter. visual element diagram filter controls, actual filter field, or saved filter row. screen overview related topics dimension fact export filters in the navigation tree previous search nextobject groups"}
,{"id":386694025438,"name":"Object groups","type":"topic","path":"/docs/reference/user-interface/dataflow-diagram/dataflow-diagram-object-groups","breadcrumb":"Reference › User Interface › Dataflow diagram › Object groups","description":"","searchText":"reference user interface dataflow diagram object groups overview object groups let users focus the dataflow diagram on a named set of repository objects and their related flow context. function object groups are used to isolate a business area, workflow, or implementation slice without changing the full repository model. a selected group limits the dataflow diagram to the objects that belong to that group, making large projects easier to review, generate, and maintain. groups can be selected from the diagram control area, applied from the navigation tree, or edited from an object in the diagram. membership can be assigned directly for the selected object, inherited from predecessors or successors, or excluded when a related object should not appear in the group. groups can also be locked to protect the selected scope while another user is working on it. access use the diagram group selector to switch between all objects and a named group. use an object context menu when assigning the selected diagram object to groups. use the navigation tree when managing group records or reviewing group membership. how to access navigation tree data warehouse -> groups -> list groups, add group, or group name toolbar dataflow diagram controls -> group diagram object context menu -> object groups visual element group selector, group navigation item, or groups dialog screen overview related topics filters layers search object group previous filters nextlayers"}
,{"id":386694025437,"name":"Layers","type":"topic","path":"/docs/reference/user-interface/dataflow-diagram/dataflow-diagram-layers","breadcrumb":"Reference › User Interface › Dataflow diagram › Layers","description":"","searchText":"reference user interface dataflow diagram layers overview layers are the dataflow diagram bands that organize source, warehouse, datamart, and export objects into readable architecture stages. function layers help users understand where objects belong in the warehouse flow. each band groups the objects for one architectural area, so tables, transformations, packages, imports, exports, and model-related work can be reviewed in context instead of as one flat diagram. the diagram starts with a sources band, adds configured warehouse layers in sequence, and adds an export band when outbound flows are present. from a layer band, users can refresh the view, store or remove diagram filters, add common warehouse objects, run the dwh wizard, synchronize the warehouse, import or export definitions, manage locks, create or update model membership, and save the diagram as a picture. access open the dataflow diagram from the dwh area, then use a layer band when you want to work with the objects that belong to a specific architecture stage. use the dwh layer list or the data warehouse navigation tree when you need to maintain the layer records themselves. how to access navigation tree data warehouse -> show diagram; data warehouse -> layers -> layer name toolbar dwh -> layers diagram dataflow diagram -> layer band visual element layer band or layer navigation item -> context menu screen overview related topics filters object groups import export previous object groups nextsource"}
,{"id":386694025441,"name":"Source","type":"topic","path":"/docs/reference/user-interface/dataflow-diagram/dataflow-diagram-source","breadcrumb":"Reference › User Interface › Dataflow diagram › Source","description":"","searchText":"reference user interface dataflow diagram source overview source in the dataflow diagram represents an input object supplied by a connector. it shows where external data enters the model and how that data can feed imports, exports, transformations, references, and downstream warehouse objects. function a source object appears as a selectable label on the dataflow diagram. users can focus it in the navigation tree, use it as a diagram filter, preview its data, refresh its structure, open its reference diagram, or start related import and export work from the same context. double-clicking a source opens the source editor. the editor maintains the source name, schema, connector, group, type, friendly name, description, path, query, directory options, and column definition. file-based sources also expose csv and directory settings, while query-based sources use the query tab. refresh actions compare the source definition with the connected data provider and can update columns, keys, descriptions, imported-table metadata, and source references. this keeps the diagram and the source editor aligned with the external structure used by the model. access sources can be listed from the sources toolbar tab, managed from the sources branch in the navigation tree, and opened directly from a visible source label on the dataflow diagram. the diagram canvas also supports adding a new data source from the add menu. how to access navigation tree sources -> connector -> sources -> source toolbar sources -> sources diagram source label context menu, source label double-click, or diagram canvas add -> data source visual element source object on the dataflow diagram and the source editor screen overview related topics sources list filters search table previous layers nexttable"}
,{"id":386694025442,"name":"Table","type":"topic","path":"/docs/reference/user-interface/dataflow-diagram/dataflow-diagram-table","breadcrumb":"Reference › User Interface › Dataflow diagram › Table","description":"","searchText":"reference user interface dataflow diagram table overview a table on the dataflow diagram represents a warehouse table that can receive data, provide data to downstream transformations, participate in references, and support historization, data vault, and semantic modeling work. function a table object can be managed from the dwh toolbar, from the navigation tree, or directly from its label on the dataflow diagram. context menu right-click a table label on the dataflow diagram to open the table context menu. the context menu provides quick actions for locating the table, focusing the diagram around it, editing the table definition, deleting the table when allowed, creating historization, adding data vault structures, managing references, and opening the reference diagram. access tables are available from the dwh toolbar and from schema branches in the navigation tree. on the dataflow diagram, a table can be opened by double-clicking its label or managed from the table label context menu. how to access navigation tree dwh -> schema -> tables -> table toolbar dwh -> tables diagram double-click the table label to open it, or right-click the table label to open the context menu. add from diagram use the diagram canvas add menu to create an externally filled table. screen overview related topics tables list source transformation filters previous source next transformation"}
,{"id":386694025443,"name":"Transformation","type":"topic","path":"/docs/reference/user-interface/dataflow-diagram/dataflow-diagram-transformation","breadcrumb":"Reference › User Interface › Dataflow diagram › Transformation","description":"","searchText":"reference user interface dataflow diagram transformation overview a transformation on the dataflow diagram represents a data-processing object that combines input tables, applies joins and filters, calculates output columns, and produces a reusable warehouse result for downstream dataflow, reporting, and semantic-model work. function a transformation object can be managed from the etl toolbar, from the transformations branch in the navigation tree, or directly from its label on the dataflow diagram. context menu right-click a transformation label on the dataflow diagram to open the transformation context menu. the context menu provides quick actions for locating the transformation, focusing the diagram around it, editing or deleting the transformation, duplicating it, creating or extending a model, and opening the reference diagram. access transformations are available from the etl toolbar and from schema-level transformations branches in the navigation tree. on the dataflow diagram, a transformation can be opened by double-clicking its label or managed from the transformation label context menu. how to access navigation tree dwh -> schema -> transformations -> transformation toolbar etl -> transformations or etl -> new transformation diagram double-click the transformation label to open it, or right-click the transformation label to open the context menu. add from diagram use the diagram canvas add menu to create a transformation. screen overview related topics transformations list transformation page create transformation wizard table"}
,{"id":386694025433,"name":"Fact","type":"topic","path":"/docs/reference/user-interface/dataflow-diagram/dataflow-diagram-fact","breadcrumb":"Reference › User Interface › Dataflow diagram › Fact","description":"","searchText":"reference user interface dataflow diagram fact overview a fact on the dataflow diagram represents a fact transformation used to prepare measurable business events, balances, or transactions. it shows how the fact connects to dimensions, source objects, packages, and downstream outputs. function a fact node gives the fact transformation a visible position in the dataflow diagram. it shows the object label, uses the fact color style, and connects to related objects through directional arrows. context menu right-click a fact node on the dataflow diagram to open the fact context menu. the context menu provides quick actions for opening the fact transformation, locating it in the navigation tree, focusing the diagram on the selected flow, adding it to a diagram filter, reviewing references, previewing data, managing object groups, and adjusting node colors. access facts are available on the dataflow diagram as fact nodes. a fact can be opened by double-clicking its node or managed from the fact node context menu. how to access navigation tree toolbar diagram double-click the fact node to open it, or right-click the fact node to open the context menu. visual element fact node on the dataflow diagram with right-click context menu actions. screen overview related topics dimension transformation filters fact table"}
,{"id":386694025431,"name":"Dimension","type":"topic","path":"/docs/reference/user-interface/dataflow-diagram/dataflow-diagram-dimension","breadcrumb":"Reference › User Interface › Dataflow diagram › Dimension","description":"","searchText":"reference user interface dataflow diagram dimension overview a dimension on the dataflow diagram represents a dimension output that prepares descriptive business data for analytical use. it shows where the dimension is created, how it connects to upstream processing, and where it supports downstream facts, models, exports, or related objects. function a dimension node gives the dimension a visible position in the dataflow diagram. it shows the object label, uses the dimension color style, and connects to related objects through directional arrows. context menu right-click a dimension node on the dataflow diagram to open the dimension context menu. the context menu provides quick actions for opening the dimension, locating it in the navigation tree, focusing the diagram on the selected flow, adding it to a diagram filter, reviewing references, previewing data, managing object groups, and adjusting node colors. access dimensions are available on the dataflow diagram as dimension nodes. a dimension can be opened by double-clicking its node or managed from the dimension node context menu. how to access navigation tree toolbar diagram double-click the dimension node to open it, or right-click the dimension node to open the context menu. visual element dimension node on the dataflow diagram with right-click context menu actions. screen overview related topics fact transformation filters model dimension previous fact next import"}
,{"id":386694025436,"name":"Import","type":"topic","path":"/docs/reference/user-interface/dataflow-diagram/dataflow-diagram-import","breadcrumb":"Reference › User Interface › Dataflow diagram › Import","description":"","searchText":"reference user interface dataflow diagram import overview the import, shown as the ip icon on the dataflow diagram, represents an import flow from a defined source into a warehouse table. use it to see where data enters analyticscreator, which source provides the data, which target table receives it, and which package performs the load. function an import flow connects a source object to the target table created or loaded from that source. on the dataflow diagram, the ip icon makes the import package or import relationship visible beside the connected source and target table. the import flow helps users review inbound data movement, including the source object, target table, execution package, and direction of the load. [ip] icon the ip icon marks the import package or import relationship on the dataflow diagram. double-click the ip icon or import marker to open the import definition when the marker represents an existing import relationship. access imports are available from the navigation tree, from etl list views, and from the dataflow diagram. on the diagram, an import can be created from a source node and reviewed through the ip icon, import marker, source object, target table, and directional flow. how to access navigation tree packages -> import, toolbar etl -> list -> imports, or etl -> list -> packages diagram use dataflow diagram -> source node -> add -> import to create an import flow. visual element ip icon on the dataflow diagram. double-click the icon or import marker to open the import definition. screen overview related topics imports list create import import package filters"}
,{"id":386694025435,"name":"Historization","type":"topic","path":"/docs/reference/user-interface/dataflow-diagram/dataflow-diagram-historization","breadcrumb":"Reference › User Interface › Dataflow diagram › Historization","description":"","searchText":"reference user interface dataflow diagram historization overview historization, shown as the hp icon on the dataflow diagram, represents a time-aware history flow for a table. use it to review which table is historized, which history table stores the changing records, and which package maintains the history load. function a historization flow connects a table with its history table and the package that executes the history load. on the dataflow diagram, the hp icon makes the historization package or historization relationship visible beside the connected table and history table. the historization flow helps users review where historical data is captured, which package owns the load, and how the current table connects to its history table. [hp] icon the hp icon marks the historization package or historization relationship on the dataflow diagram. double-click the hp icon or historization marker to open the historization definition when the marker represents an existing historization relationship. access historizations are available from the navigation tree, from etl list views, and from the dataflow diagram. on the diagram, historization can be created from a table node and reviewed through the hp icon, historization marker, current table, history table, and directional flow. how to access navigation tree packages -> historization toolbar etl -> list -> historizations, or etl -> list -> packages diagram use dataflow diagram -> table node -> add -> historization to create a historization flow. visual element hp icon on the dataflow diagram. double-click the icon or historization marker to open the historization definition. screen overview related topics historizations list create historization historization package filters previous import next persisting"}
,{"id":386694025439,"name":"Persisting","type":"topic","path":"/docs/reference/user-interface/dataflow-diagram/dataflow-diagram-persisting","breadcrumb":"Reference › User Interface › Dataflow diagram › Persisting","description":"","searchText":"reference user interface dataflow diagram persisting overview persisting, shown as the pp icon on the dataflow diagram, represents the storage of a transformation result in a managed persisted table. use it to see which transformation output is persisted, which table stores the result, and which package controls the load. function a persisting flow connects a transformation with the persisted table that stores its result. on the dataflow diagram, the pp icon makes the persisting package or persisting relationship visible beside the related transformation and persisted table. persisting is used when a transformation result must be retained, reused by later processing, loaded incrementally, or handled through a controlled package. [pp] icon the pp icon marks the persisting package or persisting relationship on the dataflow diagram. it helps users identify where a transformation result is stored as a persisted table and which package is responsible for maintaining that persisted output. access persisting can be created from the dataflow diagram by using the context menu on a layer or eligible transformation. existing persisting relationships are maintained from the package navigation tree. how to access navigation tree packages -> persisting -> package or persisting entry toolbar there is no direct toolbar entry for the pp icon. use the diagram add menu or the package navigation tree. diagram right-click a layer or eligible transformation, then use add -> persisting. visual element pp icon on the dataflow diagram. it marks the persisting relationship between a transformation result and a persisted table. screen overview screen overview: the pp icon on the dataflow diagram marks the persisting flow from a transformation to a persisted table. related topics layers object groups search transformation previous historization next export"}
,{"id":386694025432,"name":"Export","type":"topic","path":"/docs/reference/user-interface/dataflow-diagram/dataflow-diagram-export","breadcrumb":"Reference › User Interface › Dataflow diagram › Export","description":"","searchText":"reference user interface dataflow diagram export overview export, shown as the ep icon on the dataflow diagram, represents an export flow from an analyticscreator table to a target source or external destination. use it to see which table provides the data, where the data is exported, and which package controls the export process. function an export flow connects a source table in analyticscreator with the target source or destination that receives the exported data. on the dataflow diagram, the ep icon makes the export package or export relationship visible beside the related table and target object. export is used when data prepared in analyticscreator must be sent to another system, file location, database, or downstream target through a controlled package. [ep] icon the ep icon marks the export package or export relationship on the dataflow diagram. it helps users identify where data leaves the warehouse flow and which package is responsible for maintaining the export output. access exports can be reviewed from the dataflow diagram through the ep icon, export marker, source table, target source, and directional flow. existing export definitions can also be maintained from the package navigation tree or export-related list views. how to access navigation tree packages -> export toolbar use etl -> packages. diagram use the dataflow diagram to review the export flow between the source table, ep icon, and target source or destination. visual element ep icon on the dataflow diagram. it marks the export relationship between an analyticscreator table and a target source or destination. screen overview screen overview: the ep icon on the dataflow diagram marks the export flow from an analyticscreator table to a target source or destination. related topics export page create export table filters previous persisting"}
,{"id":383509174509,"name":"Pages","type":"subsection","path":"/docs/reference/user-interface/pages","breadcrumb":"Reference › User Interface › Pages","description":"","searchText":"reference user interface pages the pages section documents the page-level object views that users open to configure analyticscreator components in detail. use these topics to understand what each page is responsible for, which object family it manages, and how page-based editing supports modeling, deployment, semantic design, and operational maintenance. available topics connector the connector page is used to add and edit source connectors. open connector export the export page is used to add and edit data exports. open export olap hierarchy the olap hierarchy page is used to add and edit olap hierarchies. open olap hierarchy historization the historization page is used to add and edit historizations. open historization import the import page is used to add and edit data imports from a source. open import index the index page is used to add and edit table indexes. open index macro the macro page is used to add and edit macros. open macro model dimension the model dimension page is used to add and edit model dimensions. open model dimension model fact the model fact page is used to add and edit model facts. open model fact table the table page is used to add and edit tables. open table object script the object script page is used to add and edit object scripts. open object script package the package page is used to add and edit packages. open package olap partition the olap partition page is used to add and edit olap partitions. open olap partition persisting the persisting page is used to add and edit transformation persistings. open persisting predefined transformation the predefined transformation page is used to add and edit predefined transformations. open predefined transformation table reference the table reference page is used to add and edit table references. open table reference olap role the olap role page is used to add and edit olap roles. open olap role sql script the sql script page is used to add and edit sql scripts. open sql script snapshot group the snapshot group page is used to add and edit snapshot groups. open snapshot group snapshot the snapshot page is used to add and edit snapshots. open snapshot source the source page is used to add and edit sources in a connector. open source star the star page is used to add and edit data mart stars. open star deployment the deployment page is used to add, edit, and run deployments. open deployment source reference the source reference page is used to add and edit source references. open source reference transformation the transformation page is used to add and edit transformations. open transformation users in user group the users in user group page is used to add and edit users in a user group. open users in user group how to use this section start with core implementation pages such as connector, source, table, transformation, and package when you need to configure the main warehouse objects. use model dimension, model fact, olap hierarchy, olap partition, and olap role for analytical and semantic model structures. use persisting, predefined transformation, sql script, snapshot, and snapshot group for implementation behavior and reusable runtime structures. use deployment, table reference, source reference, and users in user group when the task involves release management, object relationships, or access organization. key takeaway the pages section maps analyticscreator's object-specific editing pages to the responsibilities they control, helping users choose the right page for the task at hand. previous export nextconnector"}
,{"id":386694025444,"name":"Connector","type":"topic","path":"/docs/reference/user-interface/pages/pages-connector","breadcrumb":"Reference › User Interface › Pages › Connector","description":"","searchText":"reference user interface pages connector overview the edit connector page is used to add or maintain a source connector in analyticscreator. use it to define the connector name, choose the connector type, enter connection details, configure connector-specific options, test the connection, and save the connector for reuse by sources and packages. function a connector stores the connection information required to access a source system. the page adapts to the selected connector type and displays the fields needed for that technology, such as connection strings, file settings, server and database settings, azure blob settings, odata settings, authentication options, or other connector-specific properties. use test connection to validate the current connector settings before saving. use save to store the connector and make it available for source-related workflows. edit connector the edit connector page is opened when users add a new connector, edit an existing connector from the navigation tree, or double-click a connector in the connectors list. it is the main page for maintaining the connection details used by source definitions. access open the edit connector page from the connectors branch in the navigation tree, from the sources toolbar, or from the connectors list. use add connector when creating a new connector and edit connector or double-click when maintaining an existing connector. how to access navigation tree connectors -> add connector, or connectors -> connector -> edit connector toolbar sources -> connectors diagram not opened directly from the dataflow diagram. connectors list double-click a connector row in the connectors list to open the edit connector page. screen overview screen overview: the edit connector page is used to configure connection details, test the connection, and save the connector. id property description 1 edit connector page editor area for adding or maintaining one source connector. 2 connector name required name shown in connector lists, source workflows, and the navigation tree. 3 connector type selects the connector technology and controls which connection fields are displayed. 4 connection settings contains the connection string, server details, database details, url, authentication, file, or connector-specific settings needed by the selected connector type. 5 encrypted string support allows encrypted-string aliases to be used instead of plain-text sensitive values when supported by the connector type. 6 template fills the connection editor with an example template for the selected connector type when available. 7 test connection checks the current connection settings and reports whether the connection can be established. 8 save saves the connector, validates required fields, and makes the connector available for source-related workflows. related topics connectors list page connectors navigation tree sources toolbar sources list previous pages next export"}
,{"id":386694025446,"name":"Export","type":"topic","path":"/docs/reference/user-interface/pages/pages-export","breadcrumb":"Reference › User Interface › Pages › Export","description":"","searchText":"reference user interface pages export overview the edit export page is used to add or maintain a data export in analyticscreator. use it to define the export package, review the table-to-target export relationship, configure export settings, map source fields to target fields, maintain package variables, and save the export definition. function an export moves data from an analyticscreator table to a target source or destination. the edit export page stores the export mapping in an export package and provides the settings needed to control how the export is generated and executed. the page includes the main export settings, field mapping, package variables, and additional tabs for scripts and export options. users can define which source columns are exported, how they map to target columns, which package variables are available, and which options control the generated export package. edit export the edit export page is opened when users edit an existing export from the packages branch, double-click an export row in the exports list, or double-click an export marker on the dataflow diagram. it is the main page for maintaining an existing data export. access open the edit export page from the packages branch in the navigation tree, from the exports list, or from the dataflow diagram. use edit export when maintaining an existing export, or double-click the export where the interface supports direct opening. how to access navigation tree etl -> packages -> export toolbar no direct toolbar command. open the export from the package navigation tree, the exports list, or the dataflow diagram. diagram double-click the export marker or ep icon on the dataflow diagram to open the export. exports list double-click an export row in the exports list to open the edit export page. screen overview screen overview: the edit export page is used to maintain a data export, map source fields to target fields, configure variables, and save the export definition. id property description 1 export read-only relationship label showing the table-to-target export being edited. 2 package export package that owns and executes the export mapping. 3 description optional description for the export definition. 4 truncate statement sql statement used when the target is truncated before the export runs. 5 filter optional filter applied to the data selected for export. 6 manually created marks the export package as manually maintained. 7 truncate target controls whether the target is cleared before the export writes data. 8 externally launched marks the export package as launched outside the standard package run flow. 9 main tab contains the field mapping grid and package-variable grid. 10 scripts tab stores sql that runs before or after the export process. 11 options tab contains package loading and performance settings for the export. 12 source name source table column selected for export. 13 target name target column that receives the exported value. 14 description optional field-level description for the export mapping. 15 ssis statement optional package statement for the selected field mapping. 16 variable variable name available to the generated export package. 17 type variable data type used by the export package. 18 description optional description for the package variable. 19 expression optional expression assigned to the package variable. 20 initial value initial value assigned to the package variable. 21 cancel closes the page without continuing the current edit. 22 save validates and stores the export mapping, variables, scripts, and options. related topics exports list page packages navigation tree export on the dataflow diagram create export wizard previous connector next olap hierarchy"}
,{"id":386694025454,"name":"OLAP Hierarchy","type":"topic","path":"/docs/reference/user-interface/pages/pages-olap-hierarchy","breadcrumb":"Reference › User Interface › Pages › OLAP Hierarchy","description":"","searchText":"reference user interface pages olap hierarchy overview the olap hierarchy page is used to add or edit hierarchy definitions for analytical tables. a hierarchy groups selected table columns into ordered levels so they can be used consistently in olap and data mart analysis. function use this page to select the schema and table, define the hierarchy name, add an optional description, and maintain the ordered hierarchy levels. schema defines the data mart schema. table defines the analytical table that provides the available columns for the hierarchy. hierarchy name is required and identifies the hierarchy in the navigation tree and hierarchy lists. description explains the purpose of the hierarchy. the hierarchy columns area defines the levels of the hierarchy. each row selects a table column, assigns a sequence number, and provides a readable level name and description. save stores the new or changed hierarchy definition. cancel closes the page without continuing the current edit. hierarchy levels hierarchy levels are defined in sequence. the first level represents the highest level of the hierarchy, and the following rows define the lower levels. the seqnr value controls this order. when a new hierarchy column is added, analyticscreator assigns the next sequence number. users can adjust the sequence if the hierarchy level order must be changed. access open this page when you need to add a new olap hierarchy or edit an existing one. existing hierarchies can be opened from the hierarchies branch or from the hierarchies list. new hierarchies can be created from the same hierarchy entry points. how to access navigation tree data warehouse -> hierarchies -> add hierarchy, or data warehouse -> hierarchies -> [hierarchy] -> edit hierarchy. toolbar data mart -> hierarchies, then choose new to add a hierarchy or double-click an existing hierarchy to edit it. diagram the olap hierarchy page is not opened directly from the diagram. use the navigation tree or the data mart toolbar. screen overview the screen contains the hierarchy header fields, the hierarchy level columns, and the action buttons used to save or cancel the edit. . id property description 1 hierarchy details main editor area for adding or editing the olap hierarchy definition. 2 schema data mart schema that contains the table used by the hierarchy. 3 table analytical table used by the hierarchy. the selected table controls the available hierarchy columns. 4 hierarchy name required name of the hierarchy, shown in hierarchy lists and the navigation tree. 5 description optional description that documents the purpose of the hierarchy. 6 column column from the selected table used as a hierarchy level. 7 seqnr. sequence number that defines the order of the hierarchy levels. 8 name readable name for the hierarchy level. 9 description optional description for the hierarchy level. 10 cancel closes the page without continuing the current edit. 11 save saves the new or changed hierarchy definition and refreshes the related hierarchy information. related topics hierarchies list page data mart toolbar olap partition olap role previous export next historization"}
,{"id":386694025447,"name":"Historization","type":"topic","path":"/docs/reference/user-interface/pages/pages-historization","breadcrumb":"Reference › User Interface › Pages › Historization","description":"","searchText":"reference user interface pages historization overview the historization page is used to add or edit a historization definition. a historization defines how a source table is loaded into a historized table and how changes are tracked over time. function use this page to assign the historization package, configure scd behavior, define validity-period logic, control empty-source and missing-source behavior, maintain column rules, add calculated columns, define variables, and review the generated or manually maintained procedure settings. the page is organized into a top configuration area, behavior options, validity-period settings, the tabbed editor area, calculated columns, variables, and the page action buttons. save stores the new or changed historization settings. cancel closes the page without continuing the current edit. historization context the historization wizard captures source, target, and package settings including paradigm-specific options like scd (kimball) or vault id (data vault) before loading this configuration page. existing configurations bypass the wizard and open directly in the editor.. access open this page when you need to add a new historization or edit an existing historization. existing historizations can be opened from the packages branch, from the historizations list, or from a historization connection in the diagram. how to access navigation tree data warehouse -> packages -> historization -> [package] -> [historization] -> edit historization, or use add historization from a package or table context. toolbar etl -> historizations, then use new to add a historization or double-click an existing row to edit it. diagram double-click a historization connection, or use add -> historization from a table context. screen overview the historization page contains several configuration areas. the screen overview is documented in separate groups so the large editor remains readable. a. general historization setup id property description a.1 historicize shows the source-to-target historization relationship being edited. a.2 package historization package that owns the definition. a typed package name can be used when creating a new historization package. a.3 update statistics updates table statistics as part of the historization package flow. a.4 use vault id as pk uses the vault id value as the primary-key basis for the historization. a.5 insert only (no pk) uses insert-only historization when no primary key is available. a.6 source is historized uses existing history from the source side. a.7 truncate historized table clears the historized table before loading when this behavior is selected. a.8 persist source persists the source side when persistence is available for the source object. a.9 check source for duplicates checks incoming source data for duplicate business keys before loading history. a.10 delete future history if exists allows the load to remove later-dated history rows when they conflict with the current run. b. empty source behavior id property description b.1 continue continues the package when the source returns no rows. b.2 stop with error stops the package and returns an error when the source is empty. b.3 stop without error stops the package without returning an error when the source is empty. c. tabbed editor area area c contains the tabbed editor used to configure the detailed historization rules. each tab is documented in a separate table. c.1 definition id property description c.1 definition tab used to define the column historization rules. c.1.1 column name column selected for the historization rule. c.1.2 scd type defines the column behavior, such as no tracking, scd1 current-value handling, or scd2 full historization. c.1.3 empty value fallback value used when an empty record must be created. c.1.4 last value as empty value uses the previous value as the fallback value for an empty record. c.2 filters id property description c.2 filters tab used to define change-detection and delete-detection filters. c.2.1 detect new and changed data - source table filter for incoming source rows used to detect new or changed data. c.2.2 detect new and changed data - historized table filter for existing historized rows used to detect new or changed data. c.2.3 detect deleted data - source table filter for incoming source rows used to detect deleted data. c.2.4 detect deleted data - historized table filter for existing historized rows used to detect deleted data. c.3 scripts id property description c.3 scripts tab used to maintain sql that runs before or after the historization step. c.3.1 prescript sql executed before the historization step. the script can be viewed as original, showing the text entered by the user, or parsed, showing the script after analyticscreator resolves macros and generated expressions. c.3.2 postscript sql executed after the historization step. the script can be viewed as original, showing the text entered by the user, or parsed, showing the script after analyticscreator resolves macros and generated expressions. c.3.3 original / parsed switches script display between the entered script and the parsed script after macro resolution. c.4 procedure if you want to check this full example click here procedure [cfg].[hist_stg_categories] id property description c.4 procedure tab containing the stored-procedure text. c.4.1 procedure editor shows the stored-procedure text. it is read-only for automatically created procedures and editable for manually created procedures. c.5 special columns id property description c.5 special columns tab used to maintain technical history-column names. c.5.1 technical valid from date column that stores the technical valid-from timestamp. c.5.2 technical valid to date column that stores the technical valid-to timestamp. c.5.3 root surrogate key column that stores the root surrogate key for the history chain. c.5.4 previous surrogate key column that stores the previous surrogate key in the history chain. c.5.5 next surrogate key column that stores the next surrogate key in the history chain. c.6 options id property description c.6 options tab used to maintain package loading and performance settings. c.6.1 defaultbuffermaxrows maximum rows allowed in a data-flow buffer before the package uses a new buffer. c.6.2 defaultbuffersize buffer size used by the generated package data flow. c.6.3 max insert commit size maximum number of inserted rows committed in one operation. c.6.4 keep nulls preserves incoming null values instead of applying target defaults. c.6.5 keep identity keeps identity values from the incoming data when supported. c.6.6 table lock requests a table lock while rows are inserted into the historized target. c.6.7 check constraints controls whether target constraints are checked during load. c.6.8 rows per batch batch size used when writing rows to the historized target. c.6.9 use hash join controls whether generated historization sql should use hash-join behavior when available. c.6.10 default restores the repository default value for the selected option row. d. stored procedure type id property description d.1 automatically created analyticscreator generates the historization procedure from the stored settings. d.2 manually created the procedure is maintained manually instead of being generated automatically. e. validity-period statements id property description e.1 validfrom new keys statement used to calculate the valid-from value for newly detected keys. e.2 validfrom existing keys statement used to calculate the valid-from value for keys that already have history. e.3 validto statement used to calculate the valid-to value for closed history rows. f. missing sources behavior id property description f.1 close closes existing history rows when their source rows are missing. f.2 do not close keeps existing history rows open even when their source rows are missing. f.3 add empty record adds an empty record for missing source rows, using configured empty values where required. g. calculated columns id property description g.1 column name name of the calculated column. g.2 statement expression used to calculate the derived value. g.3 data type data type assigned to the calculated column. g.4 maxlength maximum character length when relevant for the selected data type. g.5 numscale numeric scale when relevant for the selected data type. g.6 numprec numeric precision when relevant for the selected data type. g.7 empty value fallback value for the calculated column when an empty record is created. h. variables id property description h.1 variable variable name available to the generated package. h.2 type variable data type. h.3 description optional description of the package variable. h.4 expression optional expression assigned to the package variable. h.5 initial value initial value assigned to the variable. i. page actions id action description i.1 cancel closes the page without continuing the current edit. i.2 save validates the package and stores the historization rules, filters, scripts, procedure settings, special columns, and options. related topics historizations list page packages navigation tree historization in the dataflow diagram import page previous olap hierarchy next import"}
,{"id":386694025448,"name":"Import","type":"topic","path":"/docs/reference/user-interface/pages/pages-import","breadcrumb":"Reference › User Interface › Pages › Import","description":"","searchText":"reference user interface pages import overview the import page is used to add or edit a data import from a source. an import defines how source data is mapped into an analyticscreator import table and how the generated import package handles the load. function use this page to maintain the import package, description, optional import sql, filter or query options, package flags, field mappings, package variables, scripts, and package loading options. the main import configuration defines the source-to-target import relationship and package behavior. the tabbed editor contains field mappings, variables, scripts, and performance-related options. save validates the import package and stores the import definition. cancel closes the page without continuing the current edit. import context when a new import is created, the import wizard collects the source, target schema, target table name, and package before opening the import page for detailed editing. existing imports open directly in the editor. access open this page when you need to add a new data import from a source or edit an existing import. existing imports can be opened from the import branch under packages, from the imports list, or from an import connection in the diagram. how to access navigation tree packages -> import -> [package] -> [import] -> edit import. diagram double-click an import connection in the diagram. imports list open the imports list and double-click an import. screen overview the import page contains the general import setup, the main tab for fields and variables, the scripts tab, the options tab, and the page action buttons. a. general import setup id property description a.1 import read-only relationship label showing the source-to-target import being edited. a.2 package import package that owns the mapping. a typed package name can create a new import package on save. a.3 description optional description for the import mapping. a.4 impsql optional sql or query text used for the import source selection. a.5 filter / query options optional import filter. for odata-style sources, this area can be presented as query options. a.6 update statistics updates table statistics as part of the import package flow. a.7 use logging enables logging for the import package step. a.8 externally launched marks the owning package as launched outside the standard package run flow. a.9 manually created marks the owning package as manually maintained. a.10 use variable to store query stores the source query in a package variable when the connector supports this behavior. b. main tab the main tab contains field mappings and package variables used by the import package. b.1 fields id property description b.1 fields grid that maps source columns to target import-table columns. b.1.1 source name source column selected for the import mapping. b.1.2 target name target import-table column that receives the source value. b.1.3 description optional description for the field mapping. b.1.4 ssis statement optional package statement for the field mapping. b.2 variables id property description b.2 variables grid for package variables used by the import package. b.2.1 variable variable name available to the generated package. b.2.2 type variable data type: string, integer, or boolean. b.2.3 description optional description for the package variable. b.2.4 expression optional expression assigned to the package variable. b.2.5 initial value initial value assigned to the package variable. c. scripts id property description c.1 scripts tab used to maintain sql that runs before or after the import package step. c.1.1 prescript sql executed before the import package step. the script can be viewed as original, showing the text entered by the user, or parsed, showing the script after analyticscreator resolves macros and generated expressions. c.1.2 postscript sql executed after the import package step. the script can be viewed as original, showing the text entered by the user, or parsed, showing the script after analyticscreator resolves macros and generated expressions. d. options id property description d.1 options tab used to maintain package loading and performance settings. d.1.1 defaultbuffermaxrows maximum rows allowed in a data-flow buffer before the package uses a new buffer. d.1.2 defaultbuffersize buffer size used by the generated package data flow. d.1.3 max insert commit size maximum number of inserted rows committed in one operation. d.1.4 keep nulls preserves incoming null values instead of applying target defaults. d.1.5 keep identity keeps identity values from the incoming data when supported. d.1.6 table lock requests a table lock while rows are inserted into the target. d.1.7 check constraints controls whether target constraints are checked during load. d.1.8 rows per batch batch size used when writing rows to the target. d.1.9 command timeout timeout for import commands. empty value falls back to the repository default. d.1.10 default restores the repository default value for the option on the same row. e. page actions id action description e.1 save validates the package and stores the import mapping, field mappings, scripts, package flags, and options. e.2 cancel closes the page without continuing the current edit. related topics imports list page packages navigation tree import in the dataflow diagram historization page previous historization next index"}
,{"id":386694025449,"name":"Index","type":"topic","path":"/docs/reference/user-interface/pages/pages-index","breadcrumb":"Reference › User Interface › Pages › Index","description":"","searchText":"reference user interface pages index overview the index page is used to add or edit a table index in analyticscreator. use it to select the table, define the index name, configure index properties, and maintain the ordered index columns. function use this page to create or maintain indexes for warehouse tables. the index definition combines the owning table, index name, compression setting, index behaviour flags, and the list of columns included in the index. the index details area defines the table that owns the index. schema filters the available tables, and table controls which columns can be selected in the index-columns grid. index name is required. description documents the purpose of the index. compression type defines the compression option assigned to the index. the index flags control how the index is generated. is unique marks the index as unique, is clustered marks it as clustered, is primary key marks it as the table primary key, and is columnstore marks it as a columnstore index. the lower grid defines the index columns. column selects the table column, position controls the index column order, is descending sets descending sort order for the selected column, and include only keeps the column as an included column instead of a key column. save validates and stores the index definition. cancel closes the page without continuing the current edit. index rules analyticscreator validates index settings before saving. a table can have only one primary-key index and only one clustered index. columnstore indexes cannot be saved as unique or primary-key indexes. access open this page when you need to add a new table index or edit an existing one. existing indexes can be opened from the indexes branch in the navigation tree, from a table's indexes branch, or from the indexes list. how to access navigation tree data warehouse -> indexes -> [index] -> edit index, or data warehouse -> [schema] -> [table] -> indexes -> [index] -> edit index. toolbar dwh -> indexes, then use new to add an index or double-click an existing row to edit it. diagram the index page is not opened directly from the diagram. use the navigation tree, toolbar, or indexes list. screen overview the index page contains the index details fields, index behaviour flags, index-column grid, and page action buttons. the table below follows the numbered markers in the screenshot. id property description 1 schema schema that contains the table for the index. changing the schema filters the table list. 2 table table that owns the index. changing the table refreshes the available index columns. 3 index name required name for the index. 4 description optional description for the index. 5 compression type compression option assigned to the index. 6 is unique marks the index as unique when selected. 7 is clustered marks the index as clustered when selected. only one clustered index is allowed per table. 8 is primary key marks the index as the table primary key. only one primary-key index is allowed per table. 9 is columnstore marks the index as a columnstore index. columnstore indexes cannot be saved as unique or primary-key indexes. 10 column table column included in the index definition. 11 position order of the column inside the index. 12 is descending uses descending sort order for the selected index column. 13 include only includes the column in the index without using it as a key column. 14 cancel closes the page without continuing the current edit. 15 save validates and stores the index definition, then refreshes the related navigation information. related topics indexes list page indexes navigation tree import page macro page previous import next macro"}
,{"id":386694025450,"name":"Macro","type":"topic","path":"/docs/reference/user-interface/pages/pages-macro","breadcrumb":"Reference › User Interface › Pages › Macro","description":"","searchText":"reference user interface pages macro overview the macro page is used to add or edit reusable macro statements in analyticscreator. use it to name and describe a macro, choose its language, optionally bind it to a table context, and maintain the statement that other design objects can reuse. function use this page to create or maintain reusable macro logic. a macro stores a reusable statement that can be referenced by other analyticscreator objects. macro name identifies the macro when it is referenced elsewhere. description documents the purpose of the macro. language controls how the macro statement is interpreted. referenced table can attach the macro to a table context. the list includes a no-table option and tables that can provide a key-based context for the macro. statement contains the reusable macro statement body. save validates the required fields, stores the macro, refreshes affected transformation views that reference the macro directly or through another macro, and refreshes the navigation tree. cancel closes the page without continuing the current edit. access open this page when you need to add a new macro or edit an existing macro. existing macros can be opened from the macros branch in the navigation tree or from the macros list. how to access navigation tree data warehouse -> macros -> add macro, or data warehouse -> macros -> [macro] -> edit macro. toolbar dwh -> macros, then use new to add a macro or double-click an existing row to edit it. diagram the macro page is not opened directly from the diagram. use the navigation tree, toolbar, or macros list. screen overview the macro page contains the macro details fields, the statement editor, and the page action buttons. the table below follows the numbered markers in the screenshot. id property description 1 macro name required macro name used when the macro is referenced by other objects. 2 description optional description for the macro. 3 language required language used to interpret the macro statement. 4 referenced table optional table context for the macro. the list includes a no-table option and tables that can provide a key-based context. 5 statement required reusable statement body for the macro. 6 cancel closes the page without continuing the current edit. 7 save validates required fields, stores the macro, refreshes affected transformation views, and refreshes the navigation tree. related topics macros list page macros navigation tree index page model dimension page previous index next model dimension"}
,{"id":386694025451,"name":"Model Dimension","type":"topic","path":"/docs/reference/user-interface/pages/pages-model-dimension","breadcrumb":"Reference › User Interface › Pages › Model Dimension","description":"","searchText":"reference user interface pages model dimension overview the model fact page is used to add or edit a fact inside a data mart model. use it to assign the fact to a model, define its technical and friendly names, describe it, maintain its measures, and connect it to model dimensions. function model selects the data mart model that owns the fact. when the page is opened from a model's facts branch, the model is preselected for new facts. name is the required technical fact name. friendly name provides the business-facing name. description documents the purpose of the fact. the first editable grid defines the fact measures. each measure row contains a name, friendly name, and description. the second editable grid connects the fact to model dimensions. each relationship row selects a dimension and can define a relationship name, friendly name, and description. when a dimension row is added and a dimension is selected, analyticscreator can fill the row name from the selected dimension when the row name is still blank. save validates the required model and name, stores the fact, refreshes the navigation tree, and reloads the page. cancel closes the page without continuing the current edit. access open this page when you need to add a new model fact or edit an existing one. existing facts can be opened from the facts branch under a model in the navigation tree. new facts can be created from the same facts branch. how to access navigation tree models -> [model] -> facts -> add fact, or models -> [model] -> facts -> [fact] -> edit fact. toolbar data mart -> models, then use the model's facts branch in the navigation tree. diagram the model fact page is not opened directly from the diagram. use the models navigation tree. screen overview the model fact page contains the model and fact fields, the measures grid, the dimensions grid, and the page action buttons. the table below follows the numbered markers in the screenshot. id property description 1 model required model that owns the fact. it is preselected when the page is opened from a model's facts branch. 2 name required technical fact name. 3 friendly name business-facing name for the fact. 4 description optional description for the fact. 5 name measure name in the measures grid. 6 friendly name business-facing measure name in the measures grid. 7 description measure description column in the measures grid. 8 dimension model dimension selected for the fact relationship. 9 name dimension relationship name. a blank row name can be filled from the selected dimension. 10 friendly name business-facing relationship name in the dimensions grid. 11 description dimension relationship description column in the dimensions grid. 12 cancel closes the page without continuing the current edit. 13 save validates the required model and name, stores the fact, refreshes the navigation tree, and reloads the page. related topics models list page models navigation tree model dimension page data mart toolbar previous model dimension next table"}
,{"id":386694025452,"name":"Model Fact","type":"topic","path":"/docs/reference/user-interface/pages/pages-model-fact","breadcrumb":"Reference › User Interface › Pages › Model Fact","description":"","searchText":"reference user interface pages model fact overview the model fact page maintains fact definitions inside a data mart model. use it to assign the fact to a model, describe its business purpose, maintain its measures, and connect it to model dimensions. function model selects the data mart model that owns the fact. when the page is opened from a model's facts branch, the model is preselected for new facts. name is the required fact name. friendly name and description document the business-facing purpose of the fact. the first editable grid defines the fact measures with a name, friendly name, and description. the second editable grid links the fact to model dimensions. when a dimension row is added and a dimension is selected, analyticscreator can fill the row name from the selected dimension when the row name is still blank. save requires a model and name, stores the fact, refreshes the navigation tree, and reloads the page. cancel closes the page without continuing the current edit. access open an existing fact from the facts branch under a model in the navigation tree. use add fact from the same facts branch to create a new fact for that model. how to access navigation tree models -> [model] -> facts -> [fact] -> edit fact, or models -> [model] -> facts -> add fact. toolbar data mart -> models, then use the model's facts branch in the navigation tree. diagram not opened directly from the diagram. use the models navigation tree. visual element model fact page screen overview id property description 1 model required model that owns the fact. it is preselected when the page is opened from a model's facts branch. 2 name required fact name. 3 friendly name business-facing name for the fact. 4 description optional description for the fact. 5 measures grid editable grid for the fact's measures. 6 name measure name in the measures grid. 7 friendly name business-facing measure name in the measures grid. 8 description measure description column in the measures grid. 9 dimensions grid editable grid for dimensions connected to the fact. 10 dimension model dimension selected for the fact relationship. 11 name dimension relationship name. a blank row name can be filled from the selected dimension. 12 friendly name business-facing relationship name in the dimensions grid. 13 description dimension relationship description column in the dimensions grid. 14 save validates the required model and name, stores the fact, refreshes the navigation tree, and reloads the page. 15 cancel closes the page without continuing the current edit. related topics models list page models navigation tree model dimension page data mart toolbar previous model dimension nexttable"}
,{"id":386694026426,"name":"Table","type":"topic","path":"/docs/reference/user-interface/pages/pages-table","breadcrumb":"Reference › User Interface › Pages › Table","description":"","searchText":"reference user interface pages table overview the table page is used to add or edit a data warehouse table definition in analyticscreator. use it to define the table metadata, table relationships, inheritance behaviour, columns, calculated columns, scripts, dependencies, measures, physical table definition, identity-column settings, and data warehouse creation action. function use this page to maintain the technical and business definition of a data warehouse table. the top areas define the table name, schema, table type, friendly name, compression type, description, anonymization check statement, related table links, primary-key settings, and inheritance settings. the tabbed editor maintains the detailed table structure. the columns tab defines physical columns and semantic metadata. other tabs maintain calculated columns, scripts, dependencies, measures, and the physical table definition. the identity column area defines identity-column behaviour when an identity key is required. create in dwh creates the table in the data warehouse. save stores the table definition. cancel closes the page without continuing the current edit. access open this page when you need to add a new table or edit an existing table. existing tables can be opened from the navigation tree, from the tables list, or by double-clicking a table object in the diagram. how to access navigation tree data warehouse -> layers -> [layer] -> [schema] -> tables -> add table, or data warehouse -> layers -> [layer] -> [schema] -> tables -> [table] -> edit table. toolbar dwh -> tables, then use new to add a table or double-click an existing row to edit it. diagram double-click a table object in the diagram. screen overview the table page contains several configuration areas. the screen overview is split into the same main areas shown in the screenshot, with the tabbed editor documented by tab. a. table details id property description a.1 table name technical table name used in the data warehouse model. a.2 table schema schema that contains the table. a.3 table type table category used by analyticscreator when generating and organising warehouse objects. a.4 friendly name business-facing table name used in semantic or documentation contexts. a.5 compression type compression option assigned to the table. a.6 description business description or notes for the table. a.7 anonymization check statement statement used to validate anonymization handling for the table. b. related table and primary-key settings id property description b.1 hist of table links the table to its historized table when applicable. b.2 persist of table links the table to its persisted table when applicable. b.3 hub of table links the table to a data vault hub table when applicable. b.4 satellite of table links the table to a data vault satellite table when applicable. b.5 link of table links the table to a data vault link table when applicable. b.6 has primary key shows whether the table has a primary key. b.7 pk clustered controls whether the primary key is clustered. b.8 primary key name name used for the primary-key definition. c. inheritance settings id property description c.1 inherit friendlyname controls whether the table inherits its friendly name from related metadata. c.2 inherit description controls whether the table inherits its description from related metadata. c.3 inherit display folder controls whether the table inherits its display folder from related metadata. c.4 inherit all references inherits reference metadata where supported. c.5 don't inherit pk prevents the primary-key definition from being inherited. d. tabbed editor area area d contains the table editor tabs. each tab is documented in a separate table. d.1 columns id property description d.1 columns tab used to maintain the physical and semantic properties of table columns. d.1.1 column name technical column name in the table. d.1.2 data type column data type. d.1.3 maxlength maximum character length when relevant for the selected data type. d.1.4 numprec numeric precision when relevant for the selected data type. d.1.5 numscale numeric scale when relevant for the selected data type. d.1.6 nullable shows whether the column allows empty values. d.1.7 pkordinalpos position of the column in the primary-key definition. d.1.8 default default value assigned to the column. d.1.9 friendlyname business-facing column name. d.1.10 displayfolder display folder used for semantic or olap output. d.1.11 sort by column used to define sort order for the selected column. d.1.12 referenced column referenced column used for relationship metadata. d.1.13 references reference metadata assigned to the column. d.1.14 description description for the column. d.1.15 anonymize controls whether anonymization is applied to the column. d.1.16 inherit friendlyname controls whether the column inherits its friendly name from related metadata. d.1.17 inherit description controls whether the column inherits its description from related metadata. d.1.18 collation collation setting used by the column when supported. d.2 calculated columns id property description d.2 calculated columns tab used to maintain calculated column definitions for the table. d.2.1 column name technical name of the calculated column. d.2.2 statement expression used to calculate the column value. d.2.3 data type data type assigned to the calculated column. d.2.4 persisted stores the calculated column physically where supported. d.3 scripts id property description d.3 scripts tab used to maintain sql that runs before or after table processing. d.3.1 prescript sql executed before table processing. the script can be viewed as original, showing the text entered by the user, or parsed, showing the script after analyticscreator resolves macros and generated expressions. d.3.2 postscript sql executed after table processing. the script can be viewed as original, showing the text entered by the user, or parsed, showing the script after analyticscreator resolves macros and generated expressions. d.4 dependencies id property description d.4 dependencies tab used to review table dependencies and related object relationships. d.5 measures id property description d.5 measures tab used to maintain measures exposed from the table. d.5.1 measure name business name of the measure. d.5.2 aggregate aggregate behaviour for the measure. d.6 table definition id property description d.6 table definition tab used to review or maintain the physical table definition. e. identity column id property description e.1 identity column area used to define identity-column settings for the table. e.1.1 name name of the identity column. e.1.2 type data type of the identity column. e.1.3 seed starting value for the identity sequence. e.1.4 increment increment value for the identity sequence. e.1.5 pk pos primary-key position assigned to the identity column. f. page actions id action description f.1 create in dwh creates the table in the data warehouse. f.2 cancel closes the page without continuing the current edit. f.3 save saves the current table definition and refreshes the relevant navigation or list state. related topics tables list page table reference page transformation page dwh toolbar previous model fact next object script"}
,{"id":386694025453,"name":"Object script","type":"topic","path":"/docs/reference/user-interface/pages/pages-object-script","breadcrumb":"Reference › User Interface › Pages › Object script","description":"","searchText":"reference user interface pages object script overview the object script page is used to add or edit reusable scripts for analyticscreator repository objects. a script can be associated with a supported object type or maintained as a table-independent script. function script name is the required name used to identify the script in the navigation tree and object scripts list. description documents the purpose of the script. object defines the repository object type associated with the script. when the page is opened with add script from an object context, the related object type is preselected. scripts without an object scope are listed under table-independent scripts. the parameters grid defines additional values accepted by the script. for object-related scripts, the first parameter is always the selected object id. paramnr shows the parameter sequence, parameter defines its name, and default value provides an optional value for checking or running the script. statement contains the script body. check validates the current statement using the available object context and parameter values. save requires a script name and statement, stores the script and its parameter definitions, refreshes the navigation tree, and reloads the page. cancel closes the page without continuing the current edit. object context menu supported repository objects provide list scripts, add script, and run script commands in their context menus. list scripts opens the object scripts list filtered for the selected object type. add script opens this page with the object field preselected. run script lists the scripts available for the selected object type and passes the selected object id to the script. access open an existing object script from the object scripts branch or from the object scripts list. add a new object-related script from the context menu of a supported repository object. how to access navigation tree data warehouse -> object scripts -> all scripts -> [script], then right-click the script and select edit object script. scripts can also appear under table-independent scripts or the relevant object-type branch. add from an object right-click a supported repository object and select add script. the object field is initialized from the selected object. edit from an object right-click a supported repository object and select list scripts, then double-click the required script in the object scripts list. screen overview the object script page contains the script details, object scope, parameter columns, statement editor, and page action buttons. the table follows the numbered markers in the screenshot. id property description 1 script name required name used to identify the script in the navigation tree and object scripts list. 2 description optional description of the script's purpose. 3 object repository object type associated with the script. the value can be preselected when the page is opened from an object context. 4 paramnr read-only sequence number for the parameter. for object-related scripts, the first parameter is always the selected object id. 5 parameter name of an additional parameter accepted by the script. 6 default value optional default value used when checking or running the script. 7 statement script body executed for the selected repository object. 8 check validates the current statement using the available object context and parameter values. 9 cancel closes the page without continuing the current edit. 10 save validates the required fields and stores the object script and parameter definitions. related topics object scripts navigation tree object scripts list page run object script wizard object script entity previous table next package"}
,{"id":386694025457,"name":"Package","type":"topic","path":"/docs/reference/user-interface/pages/pages-package","breadcrumb":"Reference › User Interface › Pages › Package","description":"","searchText":"reference user interface pages package overview the edit package page is used to review and maintain the package assignment and loading definition for an import entry. it shows the selected import, the package that contains it, and the detailed settings used when the package runs the import. function use this page to maintain the import package, description, optional import sql, filter or query options, package flags, field mappings, package variables, scripts, and package loading options. the main import configuration defines the source-to-target import relationship and package behaviour. the tabbed editor contains field mappings, scripts, and package loading options. the right-side editors maintain optional impsql, filter text, and package variables. save validates the import package and stores the import definition. cancel closes the page without continuing the current edit. import package context the displayed layout applies to an import entry inside a package. the available fields and tabs are used to control how the selected import is executed as part of the assigned package. access open this page from the packages list when you need to review or edit an existing import entry assigned to a package. how to access packages list etl -> packages, then double-click the required package entry. navigation tree data warehouse -> packages, then select the required package entry. screen overview the edit package page contains several configuration areas. the screen overview is split into the same highlighted areas shown in the screenshot. a. import package settings area a defines the selected import, its assigned package, description, and package execution flags. id property description a.1 import shows the source-to-target import relationship assigned to the package. a.2 package package that contains and runs the selected import entry. a.3 description optional description or note for the import package entry. a.4 update statistics controls whether statistics are updated as part of the package execution. a.5 externally launched marks the import package entry as launched outside the normal package sequence. a.6 use variable to store query stores the generated or entered query in a variable when this behaviour is required by the package. a.7 use logging enables logging for the package execution of the selected import. a.8 manually created indicates that the package entry is maintained manually. b. tabbed editor and field mappings area b contains the tabbed editor. the visible main tab lists the field mappings between the source and target columns. id property description b.1 main tab used to maintain the field mapping between source fields and target fields. b.2 scripts tab used to maintain scripts related to the package execution of the import. b.3 options tab used to maintain additional package loading options for the import. b.4 fields grid containing the source-to-target field mapping rows. b.4.1 source name source field used by the import. b.4.2 target name target field populated by the import. b.4.3 description optional description of the field mapping. b.4.4 ssis statement optional ssis expression or statement used for the mapped field. c. impsql area c contains the impsql editor for the selected import package entry. id property description c.1 impsql sql text associated with the import package entry. c.2 sql editor editor area used to enter or review the optional import sql. d. filter area d contains the filter editor for the selected import package entry. id property description d.1 filter filter applied to the import package entry. d.2 filter editor editor area used to enter or review the optional filter text. e. variables area e lists the variables available to the selected import package entry. id property description e.1 variables grid containing variables used by the package execution of the import. e.1.1 variable variable name. e.1.2 type variable data type. e.1.3 description optional description of the variable. e.1.4 expression expression assigned to the variable. e.1.5 initial value initial value used when the variable is created or reset. f. page actions area f contains the page action buttons. id action description f.1 cancel closes the page without continuing the current edit. f.2 save validates the import package and stores the import definition. related topics packages list page import page packages navigation tree etl toolbar previous object script next olap partition"}
,{"id":386694025455,"name":"OLAP Partition","type":"topic","path":"/docs/reference/user-interface/pages/pages-olap-partition","breadcrumb":"Reference › User Interface › Pages › OLAP Partition","description":"","searchText":"reference user interface pages olap partition overview the olap partition page is used to add or edit a partition definition for an analytical table. use it to name the partition, select the table, define the slice, and maintain the sql query statement used by the partition. function use this page to maintain the olap partition name, analytical table assignment, slice value, and partition sql statement. the partition definition identifies the portion of an analytical table that is handled by the partition. the sql editor contains the query statement used to populate or process that partition. save validates and stores the partition definition. cancel closes the page without continuing the current edit. olap partition context the same page layout is used when adding a new olap partition or editing an existing partition. when a table is selected or already assigned, the sql statement can be reviewed and adjusted for the required slice. access open this page from the partitions branch in the navigation tree or from the partitions list in the data mart toolbar area. how to access navigation tree data warehouse -> partitions -> add partition, or data warehouse -> partitions -> [partition] -> edit partition. toolbar data mart -> partitions, then use new to add a partition or double-click an existing partition to edit it. diagram not opened directly from the diagram. use the data mart toolbar or the partitions navigation-tree branch. screen overview the olap partition page contains the partition fields, sql editor, and page action buttons. id property description 1 partition name required name of the olap partition. the name is shown in the navigation tree and in the partitions list. 2 table analytical table that the partition belongs to. the selected table provides the context for the partition sql statement. 3 slice slice value or expression that identifies the portion of the selected table covered by the partition. 4 sql multi-line sql editor containing the query statement for the partition. the query defines which rows from the selected table are included in the partition. 5 cancel closes the olap partition page without continuing the current edit. 6 save validates and stores the olap partition definition. related topics partitions list page data mart toolbar olap hierarchy olap role previous package next persisting"}
,{"id":386694025458,"name":"Persisting","type":"topic","path":"/docs/reference/user-interface/pages/pages-persisting","breadcrumb":"Reference › User Interface › Pages › Persisting","description":"","searchText":"reference user interface pages persisting overview the persisting page is used to add or edit how a transformation result is persisted as a physical table and package step. use it to assign the persisting item to a package, review the persisting type, configure incremental loading, maintain execution options, and review the generated procedure and scripts. function use this page to maintain the transformation persisting definition, including the package assignment, persisting type, incremental column, statistics update option, partition switching, table renaming, transaction handling, logging, and duplicate removal. the procedure area shows the generated persisting logic. the scripts area contains pre-script and post-script statements and lets you review the original and parsed versions of the script text. save validates and stores the persisting definition. cancel closes the page without continuing the current edit. transformation persisting context a persisting package can contain one or more persisting items. this page edits the persisting item itself, not the package container. use the package page only when you need to edit the persisting package name, package type, package content, or manual dependencies. access open this page when you need to add or edit a persisting item for a transformation result. existing persisting items can be opened from the persisting package branch, from a persisting row in the package content, or by double-clicking a persisting object in the diagram. how to access navigation tree data warehouse -> packages -> persisting -> [persisting item] -> edit package. toolbar etl -> packages, open a persisting package, then double-click the persisting content row. diagram double-click the persisting object in the diagram. screen overview the persisting page contains the package and persisting settings, execution options, generated procedure, scripts, and page action buttons. id property description 1 package name name of the persisting package shown in the packages list and navigation tree. 2 package type package category. in this screen, the package type is persisting package. 3 manually created indicates whether the package is maintained manually. 4 external launched marks the package as launched outside the normal package execution sequence. 5 description optional description of the package purpose. 6 content grid containing the persisting content assigned to the package. 7 package package listed in the manual dependencies grid. 8 depends on indicates whether the current package depends on the listed package. 9 add marks the listed package to be added as a manual dependency. 10 remove marks the listed package to be removed from the manual dependency selection. 11 delete content removes the selected persisting content row from the package. 12 add content adds a new persisting content row to the package. 13 refresh refreshes the manual dependencies grid. 14 cancel closes the page without continuing the current edit. 15 save stores the current package definition. related topics packages list page package page transformation page persist transformation wizard previous olap partition next predefined transformation"}
,{"id":386694025459,"name":"Predefined transformation","type":"topic","path":"/docs/reference/user-interface/pages/pages-predefined-transformation","breadcrumb":"Reference › User Interface › Pages › Predefined transformation","description":"","searchText":"reference user interface pages predefined transformation overview the predefined transformation page is used to add or edit reusable transformation templates. use it to define the template name, description, validation statement, transformation statement, evaluated output, and allowed keywords. function use this page to maintain a reusable transformation pattern that can be applied in transformation logic. the check statement defines when the predefined transformation can be applied. the transformation statement contains the reusable expression or statement template. the evaluated statement shows the result after evaluation. evaluate refreshes the evaluated statement. save stores the predefined transformation definition. cancel closes the page without continuing the current edit. predefined transformation context predefined transformations are reusable templates. the allowed keywords area lists the fields that can be referenced inside the check statement or transformation statement. access open this page from the predefined transformations branch in the navigation tree or from the predefined transformations list. how to access navigation tree data warehouse -> predefined transformations -> [predefined transformation] -> edit predefined transformation. toolbar etl -> predefined transformations, then double-click a predefined transformation row. diagram not opened directly from the diagram. screen overview the predefined transformation page contains the template identification fields, validation statement, transformation statement, evaluated output, allowed keywords, and page action buttons. id property description 1 name name of the reusable predefined transformation template. 2 description optional description or notes for the predefined transformation. 3 check statement validation statement used to determine whether the predefined transformation can be applied. 4 transformation statement reusable transformation expression or statement stored by the template. 5 evaluated statement preview of the transformation statement after evaluation. 6 allowed keywords list of keywords that can be used inside the check statement and transformation statement. 7 evaluate evaluates the current transformation statement and refreshes the evaluated statement preview. 8 cancel closes the page without continuing the current edit. 9 save stores the current predefined transformation definition. related topics etl toolbar transformation page transformations list page predefined transformations navigation tree previous persisting next table reference"}
,{"id":386694026427,"name":"Table reference","type":"topic","path":"/docs/reference/user-interface/pages/pages-table-reference","breadcrumb":"Reference › User Interface › Pages › Table reference","description":"","searchText":"reference user interface pages table reference overview the reference page defines a relationship between two warehouse tables. it stores the cardinality, join type, table pair, inheritance options, aliases, reference statement, column mapping, and transformation usage for the selected table reference. function use cardinality, join, table 1, and table 2 to define the basic relationship between the two tables. use description, parentdescription, and reference statement to document or define the reference statement shown in the editor. use the inheritance options to control how metadata inheritance is applied to the reference. auto created indicates that the reference was created automatically, and inactive disables the reference without removing it. use the columns grid to map both sides of the reference. the used in transformations grid shows where the reference is used by transformations. access open the references list from the dwh toolbar, then open an existing reference record from the list. how to access toolbar dwh -> references. references list open an existing reference record from the references list. screen overview id property description 1 cardinality defines the relationship cardinality between the two selected tables. 2 join defines the join type used by the reference. 3 table 1 selects the first table in the reference. 4 table 2 selects the second table in the reference. 5 description contains the reference description. 6 parentdescription shows the parent description associated with the reference. 7 reference statement contains the reference statement shown for the selected relationship. 8 default uses the default inheritance behaviour. 9 not inherit prevents inheritance for the reference. 10 force inherit forces inheritance for the reference. 11 auto created indicates that the reference was created automatically. 12 inactive marks the reference as inactive. 13 alias alias field for the first table side of the reference. 14 alias alias field for the second table side of the reference. 15 column1 column from the first table side of the reference. 16 statement1 statement value for the first table side, when used. 17 column2 column from the second table side of the reference. 18 statement2 statement value for the second table side, when used. 19 schema schema of a transformation that uses the reference. 20 transformation transformation that uses the reference. related topics references list page table page transformation page dwh toolbar previous predefined transformation nextolap role"}
,{"id":386694025456,"name":"OLAP Role","type":"topic","path":"/docs/reference/user-interface/pages/pages-olap-role","breadcrumb":"Reference › User Interface › Pages › OLAP Role","description":"","searchText":"reference user interface pages olap role overview the olap role page maintains analysis services security roles. use it to name the role, describe its purpose, assign users, and configure tabular or multidimensional cube permissions. function name is the role name shown in the navigation tree and olap roles list. description documents the business purpose of the role. the users grid assigns logins to the role. add one login per row so the role can be granted to the correct users or groups. the tabular cube tab defines tabular-model access. use rights for the overall tabular permission setting, and use the table grid to disable individual tables or add a dax filter for row-level filtering. the multidimensional cube tab defines cube, dimension, and cube-dimension permissions. use the top checkboxes for database-level rights, then maintain cube, dimension, and cube-dimension rows for read, write, process, member-set, and default-member permissions. save stores the role definition, refreshes the navigation tree, and reloads the page. cancel closes the page without continuing the current edit. access open an existing role from the roles branch in the navigation tree, or double-click it in the olap roles list. use add role from the roles branch, or new from the list, to create a role. how to access navigation tree data warehouse -> roles -> [role] -> edit role, or data warehouse -> roles -> add role. toolbar data mart -> roles, then double-click a role or choose new. diagram not opened directly from the diagram. use the data mart toolbar or the roles navigation-tree branch. visual element olap role page. screen overview id property description 1 name role name shown in the navigation tree and olap roles list. 2 users grid for the users or groups assigned to the role. 3 description business description for the role. 4 rights overall permission setting for tabular-model access. 5 dax filter sample example line showing the expected dax filter syntax. 6 filter column example example column used in the dax filter sample. 7 filter values example example list of allowed values used in the dax filter sample. 8 cancel closes the page without continuing the current edit. 9 save saves the role definition. related topics olap roles list page roles navigation tree data mart toolbar olap partition previous table reference nextsql script"}
,{"id":386694025464,"name":"SQL Script","type":"topic","path":"/docs/reference/user-interface/pages/pages-sql-script","breadcrumb":"Reference › User Interface › Pages › SQL Script","description":"","searchText":"reference user interface pages sql script overview the sql script page maintains a script that can be grouped by script category, assigned a run order, and optionally linked to a package. function use script type, name, description, sequence number, and inactive to classify and control the script. the script editor shows the original statement and the parsed result so generated values can be reviewed. package links the script to package execution where applicable, and run executes the script from the page. access open an existing script from a scripts branch or from the sql script list. how to access navigation tree scripts -> [script category] -> [script] -> edit script. toolbar etl -> scripts, then double-click a script row. diagram not opened directly from the diagram. visual element sql script page screen overview id property description 1 name business name shown in lists and navigation. 2 description business description or notes for the object. 3 sequence number run order within the selected script category. 4 inactive disables the script without deleting it. 5 original original script statement. 6 parsed parsed script after variables and expressions are resolved. 7 package package linked to the script when package execution applies. 8 run runs the script from the page. 9 save saves the current definition, refreshes the relevant navigation or list, and keeps the page consistent with the saved state. 10 cancel leaves the page without continuing the current edit. related topics sql script list page etl toolbar package page run object script wizard previous olap role nextsnapshot group"}
,{"id":386694025461,"name":"Snapshot group","type":"topic","path":"/docs/reference/user-interface/pages/pages-snapshot-group","breadcrumb":"Reference › User Interface › Pages › Snapshot group","description":"","searchText":"reference user interface pages snapshot group overview the snapshot group page maintains a group of snapshots that should be managed together. function use group name and description to identify the group and explain how it is used. the snapshot grid lists the snapshots assigned to the group. save stores the group definition and cancel leaves the page without continuing the current edit. access open an existing snapshot group from the snapshots branch or from the snapshot groups list. how to access navigation tree snapshots -> snapshot groups -> [snapshot group] -> edit snapshot group. toolbar dwh -> snapshots, then use the snapshot group list and double-click a group. diagram not opened directly from the diagram. visual element snapshot group page screen overview id property description 1 group name name shown for the snapshot group in lists and navigation. 2 description business description or notes for the object. 3 snapshot grid of snapshots assigned to the group. 4 save saves the current definition, refreshes the relevant navigation or list, and keeps the page consistent with the saved state. 5 cancel leaves the page without continuing the current edit. related topics snapshot page snapshot groups list page snapshots navigation tree dwh toolbar previous sql script nextsnapshot"}
,{"id":386694025460,"name":"Snapshot","type":"topic","path":"/docs/reference/user-interface/pages/pages-snapshot","breadcrumb":"Reference › User Interface › Pages › Snapshot","description":"","searchText":"reference user interface pages snapshot overview the snapshot page maintains a snapshot definition used to create and refresh snapshot-based data structures. function use snapshot name and description to identify the snapshot and document its purpose. the sql area contains the statement used for the snapshot logic. save stores the definition and cancel leaves the page without continuing the edit. access open an existing snapshot from the snapshots branch or from the snapshots list. how to access navigation tree snapshots -> [snapshot] -> edit snapshot. toolbar dwh -> snapshots, then double-click a snapshot row. diagram not opened directly from the diagram. visual element snapshot page screen overview id property description 1 snapshot name name shown for the snapshot in lists and navigation. 2 description business description or notes for the object. 3 sql statement used to define the snapshot logic. 4 save saves the current definition, refreshes the relevant navigation or list, and keeps the page consistent with the saved state. 5 cancel leaves the page without continuing the current edit. related topics snapshots list page snapshot group page create snapshot dimension wizard dwh toolbar previous snapshot group nextsource"}
,{"id":386694025462,"name":"Source","type":"topic","path":"/docs/reference/user-interface/pages/pages-source","breadcrumb":"Reference › User Interface › Pages › Source","description":"","searchText":"reference user interface pages source overview the source page maintains a source object inside a connector, including its schema, query or file settings, columns, references, and semantic metadata. function the main fields identify the source name, source schema, connector, group, type, friendly name, description, and optional path or query settings. the definition grid maintains source columns, data types, precision, nullability, key position, anonymization, friendly names, display folders, and reference metadata. additional areas cover file and blob options, csv parsing settings, sap deltaq or odp options, semantic capabilities, and source constraints. access open an existing source from a connector, from the sources list, or by double-clicking a source object in the diagram. how to access navigation tree connectors -> [connector] -> sources -> [source] -> edit source. toolbar dwh -> sources, then double-click a source row. diagram source object -> double-click. visual element source page screen overview id property description 1 source name name of the source object. 2 source schema schema or namespace for the source object. 3 connector connector that owns the source. 4 group optional source group. 5 blob type blob or file handling type when file-based data is used. 6 type source category used by the connector. 7 friendly name business-friendly source name. 8 anonymization check statement statement used to validate anonymization handling. 9 path path used for file- or folder-based sources. 10 process files in directory processes files from a directory rather than a single file. 11 directory directory path for file-based processing. 12 file extension file extension included by the source. 13 include subdirectories includes files from subdirectories. 14 resourcepath resource path used by supported connector types. 15 queryoptions additional query options passed to the connector. 16 definition grid of source column definitions. 17 column name source column name. 18 data type column data type. 19 nullable shows whether the source column can be empty. 20 pk ordinal position primary-key order for the source column. 21 anonymize marks the source column for anonymization handling. 22 display folder display folder used by semantic output. 23 referenced column referenced column used by source references. 24 references reference metadata for the selected column. 25 query source query statement. 26 csv properties csv parsing settings for text files. 27 column names first row uses the first row as column names. 28 code page code page used to read text files. 29 text qualifier text qualifier used by the file parser. 30 column delimiter delimiter used to split columns. 31 sap deltaq/odp sap-specific extraction settings. 32 extractor sap extractor name. 33 mode extraction mode. 34 auto sync. automatic synchronization option. 35 supports full indicates full-load support. 36 supports delta indicates delta-load support. 37 get csv structure reads column structure from a csv file. 38 constraints opens or maintains source constraints. 39 save saves the current definition, refreshes the relevant navigation or list, and keeps the page consistent with the saved state. 40 cancel leaves the page without continuing the current edit. related topics sources list page source references list page source reference page create source wizard previous snapshot nextstar"}
,{"id":386694025465,"name":"Star","type":"topic","path":"/docs/reference/user-interface/pages/pages-star","breadcrumb":"Reference › User Interface › Pages › Star","description":"","searchText":"reference user interface pages star overview the star page maintains a datamart star, including its galaxy, schema, diagram order, description, and olap availability. function use star name, galaxy, schema, and order in diagram to position the star in datamart navigation and diagrams. description and mdx document analytical behavior. multidimensional and tabular control whether the star participates in those semantic model outputs. access open an existing star from the stars list or by double-clicking a star object in the diagram. how to access navigation tree datamart -> stars, then open the star from the list. toolbar datamart -> stars, then double-click a star row. diagram star object -> double-click. visual element star page screen overview id property description 1 star main editor for datamart star settings. 2 star name name shown for the star in lists, navigation, and diagrams. 3 galaxy galaxy that contains the star. 4 schema schema associated with the star. 5 order in diagram ordering value used when the star is shown in diagrams. 6 description business description or notes for the object. 7 mdx mdx-related setting for multidimensional output. 8 multidimensional enables multidimensional output for the star. 9 tabular enables tabular output for the star. 10 save saves the current definition, refreshes the relevant navigation or list, and keeps the page consistent with the saved state. 11 cancel leaves the page without continuing the current edit. related topics datamart toolbar datamart stars list page olap hierarchy page olap partition page previous source nextdeployment"}
,{"id":386694025445,"name":"Deployment","type":"topic","path":"/docs/reference/user-interface/pages/pages-deployment","breadcrumb":"Reference › User Interface › Pages › Deployment","description":"","searchText":"reference user interface pages deployment overview the deployment page is used to define and run a deployment package for the active analyticscreator repository. use it to name the deployment, choose the output directory, configure deployment options, select generated deployment artifacts, maintain sqlcmd variables, and review deployment progress in the log. function use this page to maintain the deployment name, output directory, data warehouse deployment settings, ssis settings, optional output files, tabular olap deployment settings, multidimensional olap deployment settings, deployment artifacts, and sqlcmd variables. the options tab contains the deployment configuration. it controls database deployment, package output, bi output, olap deployment scripts, generated package selection, and deployment variables. deploy starts the deployment run and writes progress to the log. interrupt stops an active run. save stores the deployment definition. cancel closes the page without continuing the current edit. deployment context a deployment definition controls which analyticscreator artifacts are generated or deployed. the same page is used to create a new deployment definition, edit an existing deployment definition, or run a saved deployment. access open this page from the deployments branch in the navigation tree, from the deployment toolbar, or from the deployments list. how to access navigation tree data warehouse -> deployments -> add deployment, list deployments, or [deployment] -> edit/run deployment. toolbar deployment -> deployment package. diagram not opened directly from the diagram. use the deployments branch or the deployment toolbar. screen overview the deployment page is split into three main areas: deployment identity and page actions, deployment options, and deployment run controls. the deployment options area is documented in separate tables because it contains multiple configuration sections. a. deployment identity and page actions area a contains the deployment name, output directory, and page-level actions. id property / action description a.1 name deployment name shown in the deployments list and navigation tree. a.2 directory output directory used for generated deployment files. the directory can use the {login} alias. a.3 cancel closes the page without continuing the current edit. a.4 save stores the current deployment definition. b. deployment options area b contains the deployment configuration sections, deployment artifact selection, and sqlcmd variables. b.1 data warehouse id property description b.1 data warehouse section used to configure dacpac generation, target database connection, deployment safety options, and layer-database handling. b.1.1 create dacpac generates a dacpac for the selected repository objects. b.1.2 object group limits the deployment to a selected object group or keeps all groups selected. b.1.3 dacpac compatibility compatibility level used when generating the dacpac. b.1.4 database to deploy and to use as source in generated files target database connection used by the deployment and generated output files. b.1.5 manual con. string uses a manual connection string instead of the individual connection fields. b.1.6 server target database server. b.1.7 db name target database name. b.1.8 authentication options selects the database authentication mode: integrated, standard, or azure ad. b.1.9 trust server certificate allows the connection to trust the server certificate. b.1.10 login login used when the selected authentication mode requires credentials. b.1.11 password password used when the selected authentication mode requires credentials. b.1.12 deploy dacpac deploys the generated dacpac to the configured target database. b.1.13 allow data loss allows deployment changes that may cause data loss. b.1.14 drop objects not in source drops target objects that are not present in the generated source model. b.1.15 backup db before changes creates a database backup before applying deployment changes. b.1.16 block when drift detected blocks deployment when target drift is detected. b.1.17 deploy in single user mode runs deployment in single-user mode. b.1.18 allow incompatible platform allows deployment when the target platform is marked as incompatible. b.1.19 deploy test cases includes test-case deployment output. b.1.20 allow using separate databases to store layers enables layer-specific database handling for deployments that store layers in separate databases. b.2 ssis settings id property description b.2 ssis settings section used to configure generated ssis package settings. b.2.1 connection string to ssis_configuration stored as defines how the ssis_configuration connection string is stored. b.2.2 storage mode options available storage options include none, environment variable, configuration file, package parameter, and project parameter. b.2.3 all connection strings stored as defines how all generated package connection strings are stored. b.2.4 project reference uses project-reference behaviour with the integration services catalog. b.2.5 package compatibility level sql server package compatibility level used for generated ssis output. b.2.6 environment variable environment variable name used when environment-variable storage is selected. b.2.7 deploy ssis_configurations includes ssis_configurations deployment output. b.2.8 set environment variable sets the configured environment variable during deployment generation. b.3 other files id property description b.3 other files section used to select additional bi and script output files. b.3.1 create powerbi project generates power bi project output. b.3.2 create tableau model generates tableau model output. b.3.3 create qlik script generates qlik script output. b.4 tabular olap deployment id property description b.4 tabular olap deployment section used to configure tabular olap deployment output. b.4.1 create xmla script generates an xmla script for the tabular olap model. b.4.2 server tabular olap server. b.4.3 db name tabular olap database name. b.4.4 login login used for the tabular olap deployment target when credentials are required. b.4.5 password password used for the tabular olap deployment target when credentials are required. b.4.6 use the service account uses the service account for the tabular olap deployment connection. b.4.7 use the credentials of current user uses the current user credentials for the tabular olap deployment connection. b.4.8 process cube in workflow package includes cube processing in the workflow package. b.4.9 create cube during deployment creates the tabular cube during deployment. b.4.10 compatibility level compatibility level for the tabular olap model. b.4.11 facts from star star context used for fact generation in the tabular model. b.4.12 connector name connector name used by the tabular model output. b.4.13 model name model name used for the tabular olap output. b.4.14 create partitions includes tabular partition creation. b.4.15 create perspectives includes tabular perspective creation. b.5 multidimensional olap deployment id property description b.5 multidimensional olap deployment section used to configure multidimensional olap deployment output. b.5.1 create xmla script generates an xmla script for the multidimensional olap model. b.5.2 server multidimensional olap server. b.5.3 db name multidimensional olap database name. b.5.4 login login used for the multidimensional olap deployment target when credentials are required. b.5.5 password password used for the multidimensional olap deployment target when credentials are required. b.5.6 use the service account uses the service account for the multidimensional olap deployment connection. b.5.7 use the credentials of current user uses the current user credentials for the multidimensional olap deployment connection. b.5.8 process cube in workflow package includes cube processing in the workflow package. b.5.9 create cube during deployment creates the multidimensional cube during deployment. b.5.10 compatibility level compatibility level for the multidimensional olap model. b.5.11 create perspectives includes multidimensional perspective creation. b.5.12 create partitions includes multidimensional partition creation. b.6 deployment packages id property description b.6 deployment artifacts grid used to select generated packages for deployment output. b.6.1 ssis includes the package in ssis output. b.6.2 adf2 includes the package in azure data factory v2 output. b.6.3 packagename generated package name. b.6.4 packagetype generated package type. b.6.5 description description of the generated package. b.7 sqlcmd variables id property description b.7 sqlcmd variables grid used to maintain deployment variables. b.7.1 variable sqlcmd variable name. b.7.2 value value assigned to the sqlcmd variable. c. log and run controls area c contains the log tab and deployment run controls. id property / action description c.1 log tab used to display deployment progress and run messages after deployment starts. c.2 deploy starts the deployment run and writes progress to the log. c.3 interrupt stops an active deployment run. related topics deployments list page deployments navigation tree deployment toolbar export page previous star next source reference"}
,{"id":386694025463,"name":"Source reference","type":"topic","path":"/docs/reference/user-interface/pages/pages-source-reference","breadcrumb":"Reference › User Interface › Pages › Source reference","description":"","searchText":"reference user interface pages source reference overview the source reference page maintains relationships between two source objects before they are imported or transformed. function use source 1, source 2, cardinality, join, and description to define the relationship between source objects. the reference statement and alias fields describe how the relationship is expressed. the column mapping grid connects source columns or statements on each side of the relationship, and the inheritance options control whether metadata is inherited by default, blocked, or forced. access open an existing source reference from a source's references branch or from the source references list. how to access navigation tree connectors -> [connector] -> sources -> [source] -> references -> [reference] -> edit source reference. toolbar dwh -> references, then open a source reference row from the source references list. diagram not opened directly from the diagram. visual element source reference page screen overview id property description 1 cardinality relationship cardinality between the two sources. 2 join join type used by the relationship. 3 source 1 first source in the relationship. 4 source 2 second source in the relationship. 5 description business description or notes for the object. 6 reference statement statement used to express the relationship. 7 alias alias used for a source side in the relationship. 8 inheritance controls metadata inheritance for the reference. 9 default uses the default inheritance behavior. 10 column1 column or expression from the first source. 11 statement1 statement side for the first source. 12 column2 column or expression from the second source. 13 statement2 statement side for the second source. 14 save saves the current definition, refreshes the relevant navigation or list, and keeps the page consistent with the saved state. 15 cancel leaves the page without continuing the current edit. related topics source page source references list page sources list page dwh toolbar previous deployment nexttransformation"}
,{"id":386694026428,"name":"Transformation","type":"topic","path":"/docs/reference/user-interface/pages/pages-transformation","breadcrumb":"Reference › User Interface › Pages › Transformation","description":"","searchText":"reference user interface pages transformation overview the transformation page is used to add or edit a transformation definition. use it to define the transformation metadata, configure the output columns, select source tables and joins, apply filters, assign stars, and apply predefined transformations. function use this page to maintain the transformation name, schema, transformation type, historization type, persisting links, source behaviour, friendly name, description, inheritance settings, snapshot settings, output columns, source tables, references, filters, stars, and predefined transformations. the definition tab contains the editable transformation structure. it combines the column list, table and join definition, reference mapping, filter and having statements, star assignments, and predefined transformation assignments. the view tab is used to review the generated view statement. create in dwh creates the transformation view in the data warehouse. save stores the transformation definition. cancel closes the page without continuing the current edit. transformation context the visible screen shows a regular transformation on the definition tab. the transformation reads from the selected source table, defines output columns, and can be linked to stars, predefined transformations, references, filters, and generated data warehouse output. access open an existing transformation from the navigation tree, from the transformations list, or by double-clicking a transformation object in the diagram. how to access navigation tree data warehouse -> layers -> [layer] -> [schema] -> transformations -> [transformation] -> edit transformation. toolbar etl -> transformations, then double-click a transformation row. diagram double-click a transformation object in the diagram. screen overview the transformation page is split into five main areas: general transformation settings, column definition, source-table and reference logic, star assignments, and predefined transformations. a. transformation settings area a contains the general transformation metadata, source behaviour, persistence links, inheritance options, and snapshot assignment. id property description a.1 name transformation name shown in the transformations list and navigation tree. a.2 schema schema that contains the transformation. a.3 transtype transformation type selected for the definition. a.4 hist type historization behaviour used by the transformation. a.5 friendly name business-facing name for the transformation. a.6 description business description or notes for the transformation. a.7 create unknown member creates an unknown member when supported by the transformation scenario. a.8 fact transformation marks the transformation as fact-oriented. a.9 distinct uses distinct rows in the transformation output. a.10 persist table persisted table linked to the transformation. a.11 persist package persisting package linked to the transformation. a.12 hub of table hub table relationship used where applicable. a.13 satellite of table satellite table relationship used where applicable. a.14 link of table link table relationship used where applicable. a.15 direct source direct source assigned to the transformation when applicable. a.16 inherit friendlyname controls friendly-name inheritance. a.17 inherit description controls description inheritance. a.18 inherit displayfolder controls display-folder inheritance. a.19 snapshot group snapshot group assigned to the transformation. a.20 snapshot snapshot assigned to the transformation. b. definition and columns area b contains the definition tab and the transformation output column grid. id property description b.1 definition main editable definition tab for the transformation. b.2 view tab used to review the generated view statement. b.3 columns grid containing the transformation output columns. b.3.1 column name transformation output column name. b.3.2 tableseqnr sequence number of the table used by the column reference. b.3.3 reference source reference used by the output column. b.3.4 statement expression used to calculate or populate the output column. b.3.5 isaggr. marks the column as aggregated. b.3.6 defaultvalue default value assigned to the output column. b.3.7 seqnr output sequence number of the column. b.3.8 pk position primary-key position assigned to the output column. b.3.9 friendly name business-facing name of the output column. b.3.10 description description of the output column. b.3.11 inherit friendlyname controls friendly-name inheritance for the output column. b.3.12 inherit description controls description inheritance for the output column. b.4 fill columns fills the column grid from the current transformation definition. c. source tables, references, filters, and actions area c contains the source table definition, join logic, reference mapping, filter and having statements, and page action buttons. id property / action description c.1 tables grid containing the source tables and join configuration used by the transformation. c.1.1 seqnr. sequence number of the table row in the transformation definition. c.1.2 table source table used by the transformation. c.1.3 table alias alias assigned to the source table. c.1.4 joinhisttype historization join behaviour for the table row. c.1.5 jointype join type used for the table row. c.1.6 force join forces join generation for the table row. c.1.7 reference statement statement used for the reference join. c.1.8 filter statement filter statement assigned to the table row. c.1.9 subselect subselect statement for the table row when required. c.1.10 resulting join preview or result of the generated join logic. c.2 references grid containing reference mappings between table sequence numbers. c.2.1 seqnr1 first table sequence number used by the reference. c.2.2 seqnr2 second table sequence number used by the reference. c.2.3 reference reference expression or relationship between the selected table rows. c.3 filter filter statement applied to the transformation. c.4 having having statement used for aggregate logic. c.5 create in dwh creates the transformation view in the data warehouse. c.6 cancel closes the page without continuing the current edit. c.7 save stores the current transformation definition. d. stars area d assigns the transformation to one or more stars and controls fact-related star behaviour. id property description d.1 stars grid containing the stars assigned to the transformation. d.1.1 star star assigned to the transformation. d.1.2 view name view name used for the star assignment. d.1.3 isfact marks the star assignment as fact-related. d.1.4 filter filter used for the star assignment. e. predefined transformations area e assigns reusable predefined transformations to the current transformation definition. id property description e.1 predefined transformations grid containing predefined transformations assigned to the current transformation. e.1.1 predefined transformation reusable transformation template assigned to the current transformation. e.1.2 useonvault controls whether the predefined transformation is used in the vault-related scenario. related topics transformations list page create transformation wizard persisting page etl toolbar previous source reference next users in user group"}
,{"id":386694026429,"name":"Users in user group","type":"topic","path":"/docs/reference/user-interface/pages/pages-users-in-user-group","breadcrumb":"Reference › User Interface › Pages › Users in user group","description":"","searchText":"reference user interface pages users in user group overview the users in user group page maintains group membership and rights for an analyticscreator user group. function use group name to identify the user group. the group members grid lists assigned users and their rights. save stores the membership and rights changes, while cancel leaves the page without continuing the edit. access open an existing user group from the user group list. how to access navigation tree options -> user groups, then double-click a user group. toolbar options -> user groups. diagram not opened directly from the diagram. visual element users in user group page screen overview id property description 1 group name name of the user group. 2 group members grid of users assigned to the group. 3 user user assigned to the group. 4 rights rights assigned to the selected user in the group. 5 save saves the current definition, refreshes the relevant navigation or list, and keeps the page consistent with the saved state. 6 cancel leaves the page without continuing the current edit. related topics options toolbar user groups list page interface settings dialog dwh settings dialog previous transformation nextlists"}
,{"id":383509396683,"name":"Lists","type":"subsection","path":"/docs/reference/user-interface/lists","breadcrumb":"Reference › User Interface › Lists","description":"","searchText":"reference user interface lists the lists section groups the list views and registry-style pages used to browse, compare, and manage collections of analyticscreator objects. use these topics when you need a whole-of-category view, want to navigate quickly to a specific definition, or need to review many related objects from one place. available topics connectors the connectors page is used to list connectors. open connectors datamart stars the datamart stars page is used to list datamart stars. open datamart stars deployments the deployments page is used to list deployments. open deployments encrypted strings the encrypted strings page is used to list and edit encrypted strings. open encrypted strings exports the exports page is used to list data exports. open exports galaxies the galaxies page is used to list and edit galaxies. open galaxies hierarchies the hierarchies page is used to list hierarchies. open hierarchies historizations the historizations page is used to list historizations. open historizations imports the imports page is used to list data imports. open imports indexes the indexes page is used to list table indexes. open indexes layers the layers page is used to list and edit layers. open layers macros the macros page is used to list macros. open macros models the models page is used to list and edit models. open models object group content the object group content page is used to list and edit objects in object groups. open object group content object scripts the object scripts page is used to list object scripts. open object scripts olap roles the olap roles page is used to list olap roles. open olap roles packages the packages page is used to list packages. open packages parameters the parameters page is used to list and edit analyticscreator parameters. open parameters partitions the partitions page is used to list partitions. open partitions predefined transformations the predefined transformations page is used to list predefined transformations. open predefined transformations schemas the schemas page is used to list and edit schemas. open schemas snapshot groups the snapshot groups page is used to list snapshot groups. open snapshot groups snapshots the snapshots page is used to list snapshots. open snapshots source references the source references page is used to list source references. open source references sources the sources page is used to list sources. open sources sql script the sql script page is used to list sql scripts. open sql script table references the table references page is used to list table references. open table references tables the tables page is used to list tables. open tables transformations the transformations page is used to list transformations. open transformations user groups the user groups page is used to list user groups. open user groups how to use this section start with structural lists such as connectors, layers, sources, tables, and transformations when you need a repository-wide overview. use governance and metadata lists such as parameters, indexes, schemas, source references, and table references when validating relationships or implementation rules. use analytical lists such as datamart stars, galaxies, hierarchies, models, olap roles, and partitions when working on semantic structures. use operational lists such as deployments, packages, snapshots, snapshot groups, and user groups when managing runtime and organizational objects in bulk. key takeaway the lists section shows where analyticscreator exposes grouped object inventories for bulk browsing, comparison, and fast navigation across large repositories. previous users in user group nextconnectors"}
,{"id":386688842958,"name":"Connectors","type":"topic","path":"/docs/reference/user-interface/lists/lists-connectors","breadcrumb":"Reference › User Interface › Lists › Connectors","description":"","searchText":"reference user interface lists connectors overview connectors is the searchable list page for connection definitions used by source objects. use it to find existing connectors, open a connector for editing, or start a new connector. function the page combines a search filter with a read-only connector grid. the search field narrows the list, the clear-filter button resets the filter, and the grid shows the matching connector records. double-click a connector row to open it for editing. use new to create a connector, or delete to remove the selected connector after confirmation. access open the connector list from the sources toolbar or from the connectors node in the navigation tree. how to access navigation tree connectors -> list connectors toolbar sources -> connectors diagram not direct. use the list page from the toolbar or navigation tree. visual element connectors list page screen overview id property description 1 search criteria filter area at the top of the page. 2 search field text field used to filter connector records. 3 search runs the filter and refreshes the connector grid. 4 clear filter clears the search field and reloads the full connector list. 5 connector name grid column that identifies each connector by name. 6 connector type grid column that shows the connector technology or connection category. 7 connection string grid column that shows the stored connection information for the connector. 8 connector grid read-only result list. double-click a row to open the selected connector for editing. 9 delete removes the selected connector after the user confirms the action. 10 new opens the connector editor for a new connector. related topics sources toolbar connector page sources list source references previous lists nextdatamart stars"}
,{"id":386688842959,"name":"Datamart stars","type":"topic","path":"/docs/reference/user-interface/lists/lists-datamart-stars","breadcrumb":"Reference › User Interface › Lists › Datamart stars","description":"","searchText":"reference user interface lists datamart stars overview datamart stars is the searchable list page for star-schema groupings used in data mart modeling. use it to find existing stars, open a star for editing, or start a new star. function the page combines a search filter with a read-only star grid. the search field narrows the list by star details such as name, description, schema, galaxy, or diagram order. double-click a star row to open it for editing. use new to create a star, or delete to remove the selected star after confirmation. access open the star list from the data mart toolbar or from the stars node in the navigation tree. how to access navigation tree galaxies -> stars toolbar data mart -> stars diagram not direct. use the list page from the toolbar or navigation tree. visual element datamart stars list page screen overview id property description 1 search criteria filter area at the top of the page. 2 search field text field used to filter star records. 3 search runs the filter and refreshes the star grid. 4 clear filter clears the search field and reloads the full star list. 5 name grid column that identifies each star by name. 6 galaxy grid column that shows the galaxy associated with the star. 7 schema grid column that shows the schema associated with the star. 8 order in diagram grid column that displays the star order in the diagram. 9 description grid column that describes the star. 10 star grid read-only result list. double-click a row to open the selected star for editing. 11 delete removes the selected star after the user confirms the action. 12 new opens the star editor for a new star. related topics data mart toolbar star page galaxies schemas previous connectors nextdeployments"}
,{"id":386688842960,"name":"Deployments","type":"topic","path":"/docs/reference/user-interface/lists/lists-deployments","breadcrumb":"Reference › User Interface › Lists › Deployments","description":"","searchText":"reference user interface lists deployments overview the deployments list page is the searchable list for deployment definitions. use it to find existing deployments, open a deployment for editing or running, or start a new deployment. function the page combines a search filter with a read-only deployment grid. the search field narrows the list by deployment name or description, and the clear-filter button reloads the full list. double-click a deployment row to open it. use new to create a deployment, or delete to remove the selected deployment after confirmation. access open the deployment list from the deployments node in the navigation tree. how to access navigation tree deployments -> list deployments toolbar deployment diagram not direct. use the list page from the navigation tree. visual element deployments list page screen overview id property description 1 search criteria filter area at the top of the page. 2 search field text field used to filter deployment records. 3 search runs the filter and refreshes the deployment grid. 4 clear filter clears the search field and reloads the full deployment list. 5 name grid column that identifies each deployment by name. 6 description grid column that describes the deployment. 7 deployment grid read-only result list. double-click a row to open the selected deployment. 8 new opens the deployment editor for a new deployment. 9 delete removes the selected deployment after the user confirms the action. related topics deployment toolbar deployment page exports packages previousdatamart stars nextencrypted strings"}
,{"id":386688842961,"name":"Encrypted strings","type":"topic","path":"/docs/reference/user-interface/lists/lists-encrypted-strings","breadcrumb":"Reference › User Interface › Lists › Encrypted strings","description":"","searchText":"reference user interface lists encrypted strings overview the encrypted strings list maintains protected string values used by repository configuration and connection settings. function use the search area to filter encrypted strings and the grid to maintain names, protected values, and protection state. decrypt exposes a selected value for review when the user has the required rights, while save and cancel control the edit session. access open encrypted string management from the options toolbar tab. how to access navigation tree not opened from the navigation tree. toolbar options -> encrypted strings. diagram not opened directly from the diagram. visual element encrypted strings list screen overview id property description 1 search criteria area used to filter encrypted string rows. 2 search applies the current search criteria. 3 name business name shown in lists and navigation. 4 encrypted string protected value stored for the named entry. 5 protected shows whether the value is protected. 6 decrypt decrypts the selected value for authorized review. 7 save saves the current definition, refreshes the relevant navigation or list, and keeps the page consistent with the saved state. 8 cancel leaves the page without continuing the current edit. related topics options toolbar dwh settings dialog interface settings dialog connectors list page previous deployments nextexports"}
,{"id":386688842962,"name":"Exports","type":"topic","path":"/docs/reference/user-interface/lists/lists-exports","breadcrumb":"Reference › User Interface › Lists › Exports","description":"","searchText":"reference user interface lists exports overview exports is the searchable list page for data exports. use it to find export mappings by table, source, package, or description, and then open an export for maintenance. function the page combines a search filter with a read-only exports grid. the search field narrows the list by export details such as description, filter text, package, table, or source. double-click an export row to open the selected export in the export page. use new to start the export definition flow, or delete to remove the selected export after confirmation. access open the exports list from the etl toolbar. individual export definitions can also be reached from export entries in the model and package workflows. how to access navigation tree not direct for the list. use export entries under package or table workflows to open individual exports. toolbar etl -> exports diagram not direct for the list. use the export icon to open an existing export from the diagram. visual element exports list page screen overview id property description 1 search criteria filter area at the top of the page. 2 search field text field used to filter export records. 3 search runs the filter and refreshes the exports grid. 4 clear filter clears the search field and reloads the full exports list. 5 table grid column that shows the table used by the export mapping. 6 source grid column that shows the source connected to the export mapping. 7 package grid column that shows the package assigned to the export. 8 description grid column that describes the export. 9 updatestatistics grid checkbox that shows whether statistics are updated for the export. 10 uselogging grid checkbox that shows whether logging is enabled for the export. 11 exports grid read-only result list. double-click a row to open the selected export. 12 new starts the export definition flow. 13 delete removes the selected export after the user confirms the action. related topics etl toolbar export page packages table page previous encrypted strings nextgalaxies"}
,{"id":386688842963,"name":"Galaxies","type":"topic","path":"/docs/reference/user-interface/lists/lists-galaxies","breadcrumb":"Reference › User Interface › Lists › Galaxies","description":"","searchText":"reference user interface lists galaxies overview galaxies is the list and maintenance page for galaxy records in the data mart area. use it to find, review, add, or edit the galaxy containers that group related stars. function the page combines a search filter with an editable galaxies grid. the search field narrows the list by galaxy name or description, and the clear-filter button reloads the full list. edit galaxy names and descriptions directly in the grid, then use save to commit the changes. when opened from an existing galaxy in the navigation tree, the page focuses that galaxy row. access open the galaxies list from the data mart toolbar or from the galaxies node in the navigation tree. how to access navigation tree galaxies -> list galaxies. from an existing galaxy, use edit galaxy. toolbar data mart -> galaxies diagram not direct. use the data mart toolbar or the galaxies navigation-tree node. visual element galaxies list page screen overview id property description 1 search criteria filter area at the top of the page. 2 search field text field used to filter galaxy records by name or description. 3 search runs the filter and refreshes the galaxies grid. 4 clear filter clears the search field and reloads the full galaxies list. 5 name grid column for the galaxy name. 6 description grid column for the galaxy description or business context. 7 galaxies grid editable result list for adding or maintaining galaxy records. 8 save saves grid changes and refreshes the page. 9 cancel returns to the previous page without saving new edits. related topics data mart toolbar galaxies navigation tree datamart stars hierarchies previous exports nexthierarchies"}
,{"id":386688842964,"name":"Hierarchies","type":"topic","path":"/docs/reference/user-interface/lists/lists-hierarchies","breadcrumb":"Reference › User Interface › Lists › Hierarchies","description":"","searchText":"reference user interface lists hierarchies overview hierarchies is the searchable list page for data mart hierarchies. use it to find hierarchy definitions by schema, table, or hierarchy name, and then open a hierarchy for maintenance. function the page combines a search filter with a read-only hierarchies grid. the search field narrows the list by hierarchy name, schema, or table. double-click a hierarchy row to open the selected hierarchy in the olap hierarchy page. use new to create a hierarchy, or delete to remove the selected hierarchy after confirmation. access open the hierarchies list from the data mart toolbar or from the hierarchies node in the navigation tree. when opened from a table context, the list can focus the hierarchy records related to that table. how to access navigation tree hierarchies -> list hierarchies. from a table hierarchy, use edit hierarchy. toolbar data mart -> hierarchies diagram not direct. use the data mart toolbar or the hierarchies navigation-tree node. visual element hierarchies list page screen overview id property description 1 search criteria filter area at the top of the page. 2 search field text field used to filter hierarchy records by hierarchy name, schema, or table. 3 search runs the filter and refreshes the hierarchies grid. 4 clear filter clears the search field and reloads the full hierarchies list. 5 schema grid column that shows the schema for the hierarchy table. 6 table grid column that shows the table connected to the hierarchy. 7 hierarchy grid column that shows the hierarchy name. 8 clustered grid column that shows the clustered hierarchy setting. 9 hierarchies grid read-only result list. double-click a row to open the selected hierarchy. 10 new opens the olap hierarchy page for a new hierarchy. 11 delete removes the selected hierarchy after confirmation. related topics data mart toolbar olap hierarchy page galaxies datamart stars previous galaxies nexthistorizations"}
,{"id":386688842965,"name":"Historizations","type":"topic","path":"/docs/reference/user-interface/lists/lists-historizations","breadcrumb":"Reference › User Interface › Lists › Historizations","description":"","searchText":"reference user interface lists historizations overview the historizations list shows historization package items and their load behavior. function use the list to review the historized table, owning package, historization type, close behavior, generated statements, statistics updates, and logging. new starts a historization creation flow and delete removes the selected historization item. access open historizations from the etl toolbar tab. how to access navigation tree not opened directly from the navigation tree. toolbar etl -> historizations. diagram not opened directly from the diagram. visual element historizations list screen overview id property description 1 search criteria area used to filter historization rows. 2 search applies the current search criteria. 3 hist table historized target table. 4 package package selected for the current operation. 5 hist type historization behavior used by the item. 6 do not close shows whether existing rows remain open. 7 inssql insert statement used by the historization item. 8 delsql delete or close statement used by the item. 9 updatestatistics shows whether statistics are updated. 10 uselogging shows whether logging is enabled. 11 new starts creation of a historization item. 12 delete deletes the selected historization item. related topics etl toolbar historization page create historization wizard packages list page previous hierarchies nextimports"}
,{"id":386688842966,"name":"Imports","type":"topic","path":"/docs/reference/user-interface/lists/lists-imports","breadcrumb":"Reference › User Interface › Lists › Imports","description":"","searchText":"reference user interface lists imports overview the imports list shows import package items that load source data into target tables. function use the list to review the target table, source, package, description, statistics update setting, and logging setting. new starts an import creation flow and delete removes the selected import item. access open imports from the etl toolbar tab. how to access navigation tree not opened directly from the navigation tree. toolbar etl -> imports. diagram not opened directly from the diagram. visual element imports list screen overview id property description 1 search criteria area used to filter import rows. 2 search applies the current search criteria. 3 table table selected or produced by the current operation. 4 source source object used by the current page or wizard. 5 package package selected for the current operation. 6 description business description or notes for the object. 7 updatestatistics shows whether statistics are updated after import. 8 uselogging shows whether logging is enabled. 9 new starts creation of an import item. 10 delete deletes the selected import item. related topics etl toolbar import page create import wizard sources list page previous historizations nextindexes"}
,{"id":386688842967,"name":"Indexes","type":"topic","path":"/docs/reference/user-interface/lists/lists-indexes","breadcrumb":"Reference › User Interface › Lists › Indexes","description":"","searchText":"reference user interface lists indexes overview indexes is the searchable list page for table indexes in the warehouse area. use it to find index definitions by schema, table, or index name, and then open an index for maintenance. function the page combines a search filter with a read-only indexes grid. the search field narrows the list by index name, schema, or table. the grid shows where each index belongs and whether it is clustered, unique, or marked as the primary key. double-click an index row to open the selected index in the index page. use new to create an index, or delete to remove the selected index after confirmation. access open the indexes list from the dwh toolbar or from the indexes node in the navigation tree. when opened from a table context, the list can focus the index records related to that table. how to access navigation tree indexes -> list indexes. from a table index, use edit index. toolbar dwh -> indexes diagram not direct. use the dwh toolbar or the indexes navigation-tree node. visual element indexes list page screen overview id property description 1 search criteria filter area at the top of the page. 2 search field text field used to filter index records by index name, schema, or table. 3 search runs the filter and refreshes the indexes grid. 4 clear filter clears the search field and reloads the full indexes list. 5 schema grid column that shows the schema for the indexed table. 6 table grid column that shows the table connected to the index. 7 index grid column that shows the index name. 8 clustered grid column that shows whether the index is clustered. 9 unique grid column that shows whether the index enforces unique values. 10 primary key grid column that shows whether the index is the primary key for the table. 11 indexes grid read-only result list. double-click a row to open the selected index. 12 new opens the index page for a new index. 13 delete removes the selected index after confirmation. related topics dwh toolbar index page tables table references previous imports nextlayers"}
,{"id":386688842968,"name":"Layers","type":"topic","path":"/docs/reference/user-interface/lists/lists-layers","breadcrumb":"Reference › User Interface › Lists › Layers","description":"","searchText":"reference user interface lists layers overview layers is the editable list page for warehouse layers. use it to review, filter, and maintain the layers that organize warehouse objects. function the page combines a search filter with an editable layers grid. the search field narrows the list by layer name or description, and the clear-filter button reloads the full list. edit layer names, sequence numbers, and descriptions directly in the grid. save validates that sequence numbers are unique, stores the changes, and refreshes the warehouse view. cancel leaves the page without saving new edits. access open the layers list from the dwh toolbar. from an existing layer in the navigation tree, use edit layer to open the same list with that layer selected. how to access navigation tree layers -> edit layer toolbar dwh -> layers diagram not direct. use the dwh toolbar or the layers navigation-tree entry. visual element layers list page screen overview id property description 1 search criteria filter area at the top of the page. 2 search field text field used to filter layer records by layer name or description. 3 search runs the filter and refreshes the layers grid. 4 clear filter clears the search field and reloads the full layers list. 5 name grid column for the layer name. 6 seqnr grid column that controls the display order for layers. 7 description grid column for the layer description or business context. 8 layers grid editable result list for maintaining layer records. 9 save validates sequence numbers, saves grid changes, and refreshes the warehouse view. 10 cancel returns to the previous page without saving new edits. related topics dwh toolbar layers navigation tree schemas tables previous indexes nextmacros"}
,{"id":386688842969,"name":"Macros","type":"topic","path":"/docs/reference/user-interface/lists/lists-macros","breadcrumb":"Reference › User Interface › Lists › Macros","description":"","searchText":"reference user interface lists macros overview macros is the searchable list page for reusable macro definitions. use it to find macros by name, review their language, and open a macro for maintenance. function the page combines a search filter with a read-only macros grid. the search field narrows the list by macro name, and the clear-filter button reloads the full list. the grid shows each macro name and language. double-click a macro row to open the selected macro in the macro page. use new to create a macro, or delete to remove the selected macro after confirmation. access open the macros list from the dwh toolbar or from the macros node in the navigation tree. how to access navigation tree macros -> list macros toolbar dwh -> macros diagram not direct. use the dwh toolbar or the macros navigation-tree node. visual element macros list page screen overview id property description 1 search criteria filter area at the top of the page. 2 search field text field used to filter macro records by macro name. 3 search runs the filter and refreshes the macros grid. 4 clear filter clears the search field and reloads the full macros list. 5 name grid column that shows the macro name. 6 language grid column that shows the macro language. 7 macros grid read-only result list. double-click a row to open the selected macro. 8 delete removes the selected macro after confirmation. 9 new opens the macro page for a new macro. related topics dwh toolbar macros navigation tree macro page object scripts previous layers nextmodels"}
,{"id":386688842970,"name":"Models","type":"topic","path":"/docs/reference/user-interface/lists/lists-models","breadcrumb":"Reference › User Interface › Lists › Models","description":"","searchText":"reference user interface lists models overview models is the editable list page for data mart models. use it to review, filter, add, and maintain the model records used for dimensions and facts. function the page combines a search filter with an editable models grid. the search field narrows the list by model name or description, and the clear-filter button reloads the full list. edit model names and descriptions directly in the grid. new model rows start with a calendar dimension, so the model has a standard time context available for later dimensional design. save stores the grid changes, and cancel leaves the page without saving new edits. access open the models list from the data mart toolbar or from the models node in the navigation tree. from an existing model in the navigation tree, use edit model to open the same list with that model selected. how to access navigation tree models -> list models. from an existing model, use edit model. toolbar data mart -> models diagram not direct. use the data mart toolbar or the models navigation-tree node. visual element models list page screen overview id property description 1 search criteria filter area at the top of the page. 2 search field text field used to filter model records by name or description. 3 search runs the filter and refreshes the models grid. 4 clear filter clears the search field and reloads the full models list. 5 name grid column for the model name. 6 description grid column for the model description or business context. 7 models grid editable result list for maintaining model records. new model rows start with a calendar dimension. 8 save saves grid changes and refreshes the page. 9 cancel returns to the previous page without saving new edits. related topics data mart toolbar models navigation tree model dimension page model fact page previous macros nextobject group content"}
,{"id":386688842971,"name":"Object group content","type":"topic","path":"/docs/reference/user-interface/lists/lists-object-group-content","breadcrumb":"Reference › User Interface › Lists › Object group content","description":"","searchText":"reference user interface lists object group content overview object group content is the list page used to review and maintain which repository objects belong to a selected object group. use it when a group already exists and you need to manage the objects included in that group. function the page combines a search filter with an editable membership grid. the search field narrows the list by group name or object name, and the clear-filter button reloads the full list for the selected group context. when the page is opened from a specific group, new rows are assigned to that group automatically. use the object column to add or change group membership, then choose whether related predecessor or successor objects should be included. inherited rows can be excluded when they should not participate in the group. save validates the inheritance choices and stores the changes; cancel returns to the previous page without saving new edits. access open the page from an existing group in the navigation tree. it is not a direct toolbar command; it is a focused list for the selected group. how to access navigation tree groups -> selected group -> list objects toolbar not direct. use the selected group in the navigation tree. diagram not direct. use the group navigation-tree command to review all objects in a group. visual element object group content list page screen overview id property description 1 search criteria filter area at the top of the page. 2 search field text field used to filter group membership rows by group name or object name. 3 search runs the filter and refreshes the membership grid. 4 clear filter clears the search field and reloads the visible membership rows. 5 group shows the group for each membership row. when the page is opened from a selected group, the group is fixed for new rows. 6 object object assigned to the group membership row. 7 inherit predecessors includes predecessor objects related to the selected membership row. 8 inherit successors includes successor objects related to the selected membership row. 9 inherited identifies membership that came from inheritance instead of direct assignment. 10 exclude excludes an inherited object from the group while preserving the inheritance rule that brought it into view. 11 inherited from objects shows which related objects caused an inherited membership entry. 12 object group content grid editable list of group-object membership rows for the selected group context. 13 save validates the inheritance and exclusion choices, stores grid changes, and refreshes the page. 14 cancel returns to the previous page without saving new edits. related topics object groups dialog object groups in the dataflow diagram groups navigation tree object group entity previous models nextobject scripts"}
,{"id":386688842972,"name":"Object scripts","type":"topic","path":"/docs/reference/user-interface/lists/lists-object-scripts","breadcrumb":"Reference › User Interface › Lists › Object scripts","description":"","searchText":"reference user interface lists object scripts overview object scripts is the searchable list page for object script definitions. use it to find scripts, review their object scope, create a new script, delete an obsolete script, or open an existing script for editing. function the page combines a search filter with a read-only result grid. the search field narrows the list by script name or description, and the clear-filter button reloads the visible script list. when the page is opened from an object or table context, the list is limited to scripts for that context. double-click a script row to open the object script page. use new to create a script, or delete to remove the selected script after confirmation. access open the list from the object scripts node in the navigation tree. supported object contexts can also open the same list already filtered to scripts for that object. how to access navigation tree object scripts -> list object scripts. from a supported object, use list scripts. toolbar not direct. use the object scripts node or an object context command. diagram not direct. use the navigation tree to manage object scripts. visual element object scripts list page screen overview id property description 1 search criteria filter area at the top of the page. 2 search field text field used to filter object scripts by name or description. 3 search runs the filter and refreshes the object scripts grid. 4 clear filter clears the search field and reloads the visible script list. 5 object shows the object or table scope for the script. blank scope indicates a script that is not tied to a specific object. 6 name grid column for the object script name. 7 description grid column for the object script description or purpose. 8 object scripts grid read-only result list for reviewing script records. double-click a row to open it on the object script page. 9 delete deletes the selected object script after user confirmation, then refreshes the page. 10 new opens the object script page to create a new script. related topics object scripts navigation tree object script page run object script wizard object script entity previous object group content nextolap roles"}
,{"id":386688842973,"name":"OLAP roles","type":"topic","path":"/docs/reference/user-interface/lists/lists-olap-roles","breadcrumb":"Reference › User Interface › Lists › OLAP roles","description":"","searchText":"reference user interface lists olap roles overview olap roles is the searchable list page for analysis services security roles. use it to find roles by name or description, review the role list, open an existing role for editing, create a new role, duplicate a role, or delete an obsolete role. function the page combines a search filter with a read-only result grid. the search field narrows the list by role name or description, and the clear-filter button reloads the full role list. double-click a role row to open the olap role page. use new to create a role, duplicate to create a copy of the selected role, or delete to remove the selected role after confirmation. access open the list from the roles node in the navigation tree or from the roles command in the data mart toolbar. how to access navigation tree roles -> list roles. from an existing role, use edit role. toolbar data mart -> roles diagram not direct. use the roles list or role editor to manage security roles. visual element olap roles list page screen overview id property description 1 search criteria filter area at the top of the page. 2 search field text field used to filter roles by name or description. press enter to run the same filter as the search button. 3 search runs the filter and refreshes the olap roles grid. 4 clear filter clears the search field and reloads the full role list. 5 name grid column for the role name. 6 description grid column for the role description. 7 olap roles grid read-only result list sorted by role name. double-click a row to open it on the olap role page. 8 delete deletes the selected role after user confirmation, then refreshes the list. 9 duplicate creates a copy of the selected role with a unique copy name, then refreshes the list. 10 new opens the olap role page to create a new role. related topics roles navigation tree olap role page data mart toolbar partitions previous object scripts nextpackages"}
,{"id":386688842974,"name":"Packages","type":"topic","path":"/docs/reference/user-interface/lists/lists-packages","breadcrumb":"Reference › User Interface › Lists › Packages","description":"","searchText":"reference user interface lists packages overview packages is the searchable list page for load, workflow, and processing packages. use it to find packages by name or description, review package type and run flags, open an existing package for editing, create a new package, or delete an obsolete package. function the page combines a search filter with a read-only result grid. the search field narrows the list by package name or description, and the clear-filter button reloads the visible package list. when the page is opened from a package-type branch or schema context in the navigation tree, the list is limited to that context. double-click a package row to open the package page. use new to create a package, or delete to remove the selected package after confirmation. access open the list from the packages node in the navigation tree, from a package-type branch under packages, or from the packages command in the etl toolbar. how to access navigation tree packages -> list packages. from a package-type branch, use list packages to open the list already scoped to that type. toolbar etl -> packages diagram not direct. use the package list or package editor to manage packages. visual element packages list page screen overview id property description 1 search criteria filter area at the top of the page. 2 search field text field used to filter packages by package name or description. press enter to run the same filter as the search button. 3 search runs the filter and refreshes the packages grid. 4 clear filter clears the search field and reloads the visible package list. 5 package name grid column for the package name. 6 package type grid column showing whether the package is an import, historization, persisting, workflow, script, export, or external package. 7 manually created shows whether the package was created manually instead of generated from a guided flow. 8 externally launched shows whether the package is intended to be launched outside the normal package run sequence. 9 description grid column for the package description or purpose. 10 packages grid read-only result list for reviewing packages. double-click a row to open it on the package page. 11 delete deletes the selected package after user confirmation, then refreshes the page. 12 new opens the package page to create a new package. related topics packages navigation tree package page etl toolbar package entity previous olap roles nextparameters"}
,{"id":386688842975,"name":"Parameters","type":"topic","path":"/docs/reference/user-interface/lists/lists-parameters","breadcrumb":"Reference › User Interface › Lists › Parameters","description":"","searchText":"reference user interface lists parameters overview the parameters list shows analyticscreator parameters that can be reviewed or maintained for the current project. function use this list to find parameter entries, review their current values, and open a parameter for editing when project behavior or generated output needs to be adjusted. access the parameters list is opened from the analyticscreator navigation tree. how to access navigation tree parameters -> list parameters toolbar not opened directly from the toolbar. diagram not opened from a diagram. visual element searchparameter screen overview the parameters list is represented by the searchparameter visual element and is used to list or edit analyticscreator parameters. related topics parameters options parameters reference previous packages nextpartitions"}
,{"id":386688842976,"name":"Partitions","type":"topic","path":"/docs/reference/user-interface/lists/lists-partitions","breadcrumb":"Reference › User Interface › Lists › Partitions","description":"","searchText":"reference user interface lists partitions overview partitions is the searchable list page for olap partitions assigned to fact tables. use it to find partitions by name, review the fact table each partition belongs to, open an existing partition for editing, duplicate a partition, create a new partition, or delete an obsolete partition. function the page combines a search filter with a read-only result grid. the search field narrows the list by partition name, and the clear-filter button reloads the full partition list. double-click a partition row to open the olap partition page. use duplicate to create a copy of the selected partition, new to create a partition, or delete to remove the selected partition after confirmation. access open the list from the partitions node in the navigation tree or from the partitions command in the data mart toolbar. how to access navigation tree partitions -> list partitions toolbar data mart -> partitions diagram not direct. use the partition list or partition editor to manage partitions. visual element partitions list page screen overview id property description 1 search criteria filter area at the top of the page. 2 search field text field used to filter partitions by partition name. press enter to run the same filter as the search button. 3 search runs the filter and refreshes the partitions grid. 4 clear filter clears the search field and reloads the full partition list. 5 fact table grid column showing the fact table that owns the partition. 6 name grid column for the partition name. 7 partitions grid read-only result list for reviewing partitions. double-click a row to open it on the olap partition page. 8 delete deletes the selected partition after user confirmation, then refreshes the page. 9 duplicate creates a copy of the selected partition with the same fact table, slice, and partition definition. 10 new opens the olap partition page to create a new partition. related topics partitions navigation tree olap partition page data mart toolbar models previous parameters nextpredefined transformations"}
,{"id":386688842977,"name":"Predefined transformations","type":"topic","path":"/docs/reference/user-interface/lists/lists-predefined-transformations","breadcrumb":"Reference › User Interface › Lists › Predefined transformations","description":"","searchText":"reference user interface lists predefined transformations overview predefined transformations is the searchable list page for reusable transformation rules. use it to find a predefined transformation by name or description, review the available entries, open an existing entry for editing, create a new entry, or delete an obsolete one. function the page combines a search filter with a read-only result grid. the search field narrows the list by predefined transformation name or description, and the clear-filter button reloads the full list. double-click a row to open the predefined transformation page. use new to start a new predefined transformation from the list, or delete to remove the selected entry after confirmation. access open the list from the predefined transformations node in the navigation tree or from the predefined trans. command in the dwh toolbar. the navigation tree also provides add predefined transformation when you want to open the editor directly for a new entry. how to access navigation tree predefined transformations -> list predefined transformations toolbar dwh -> predefined trans. diagram not direct. use the predefined transformations list or editor to manage entries. visual element predefined transformations list page screen overview id property description 1 search criteria filter area at the top of the page. 2 search field text field used to filter predefined transformations by name or description. press enter to run the same filter as the search button. 3 search runs the filter and refreshes the predefined transformations grid. 4 clear filter clears the search field and reloads the full predefined transformation list. 5 name grid column for the predefined transformation name. 6 description grid column describing the purpose of the predefined transformation. 7 predefined transformations grid read-only result list for reviewing predefined transformations. double-click a row to open it on the predefined transformation page. 8 delete deletes the selected predefined transformation after user confirmation, then refreshes the page. 9 new starts the create action from the list page. the navigation tree also offers add predefined transformation for opening the editor directly. related topics predefined transformations navigation tree predefined transformation page dwh toolbar transformations previous partitions nextschemas"}
,{"id":386688842978,"name":"Schemas","type":"topic","path":"/docs/reference/user-interface/lists/lists-schemas","breadcrumb":"Reference › User Interface › Lists › Schemas","description":"","searchText":"reference user interface lists schemas overview the schemas list maintains schema definitions and their layer assignment. function use the list to maintain schema name, schema type, layer, and description. save stores schema edits and cancel leaves the list without continuing the edit session. access open schemas from the dwh toolbar tab or from a schema branch in the navigation tree. how to access navigation tree layers -> [layer] -> [schema] -> edit schema. toolbar dwh -> schemas. diagram not opened directly from the diagram. visual element schemas list screen overview id property description 1 search criteria area used to filter schema rows. 2 search applies the current search criteria. 3 name business name shown in lists and navigation. 4 schematype schema category assigned to the row. 5 layer maintains the layer setting on the screen. 6 description business description or notes for the object. 7 save saves the current definition, refreshes the relevant navigation or list, and keeps the page consistent with the saved state. 8 cancel leaves the page without continuing the current edit. related topics dwh toolbar layers navigation tree tables list page schema type reference previous predefined transformations nextsnapshot groups"}
,{"id":386688842979,"name":"Snapshot groups","type":"topic","path":"/docs/reference/user-interface/lists/lists-snapshot-groups","breadcrumb":"Reference › User Interface › Lists › Snapshot groups","description":"","searchText":"reference user interface lists snapshot groups overview snapshot groups is the searchable list page for named collections of snapshots. use it to find a group by name or description, review the available groups, open an existing group for editing, create a new group, or delete an obsolete one. function the page combines a search filter with a read-only result grid. the search field narrows the list by group name or description, and the clear-filter button reloads the full list. double-click a row to open the snapshot group page, where the group name, description, and assigned snapshots can be maintained. use new to start a new snapshot group from the list, or delete to remove the selected group after confirmation. access open the list from the snapshot groups branch under snapshots in the navigation tree. the same branch also provides add snapshot group, and each existing snapshot group provides edit snapshot group. how to access navigation tree snapshots -> snapshot groups -> list snapshot groups toolbar no direct toolbar command. use the snapshots navigation tree branch. diagram not direct. manage snapshot groups from the navigation tree; transformations can later use a snapshot group. visual element snapshot groups list page screen overview id property description 1 search criteria filter area at the top of the page. 2 search field text field used to filter snapshot groups by group name or description. press enter to run the same filter as the search button. 3 search runs the filter and refreshes the snapshot groups grid. 4 clear filter clears the search field and reloads the full snapshot group list. 5 name grid column for the snapshot group name. 6 description grid column describing the purpose or contents of the snapshot group. 7 snapshot groups grid read-only result list for reviewing snapshot groups. double-click a row to open it on the snapshot group page. 8 delete deletes the selected snapshot group after user confirmation. if the group is used by transformations, the confirmation message calls that out before deletion. 9 new starts a new snapshot group from the list page. the navigation tree also offers add snapshot group for opening the editor directly. related topics snapshots navigation tree snapshot group page snapshots transformations previous schemas nextsnapshots"}
,{"id":386688842980,"name":"Snapshots","type":"topic","path":"/docs/reference/user-interface/lists/lists-snapshots","breadcrumb":"Reference › User Interface › Lists › Snapshots","description":"","searchText":"reference user interface lists snapshots overview snapshots is the searchable list page for named snapshot definitions. use it to find a snapshot by name, update sql, or description, review the available entries, open an existing snapshot for editing, create a new snapshot, or delete one that is no longer needed. function the page combines a search filter with a read-only result grid. the search field narrows the list by snapshot name, update sql, or description, and the clear-filter button reloads the full list. double-click a row to open the snapshot page, where the snapshot name, description, and sql expression can be maintained. use new to start a new snapshot from the list, or delete to remove the selected snapshot after confirmation. access open the list from the snapshots node in the navigation tree or from the snapshots command in the dwh toolbar. the navigation tree also provides add snapshot, and each existing snapshot provides edit snapshot. how to access navigation tree snapshots -> list snapshots toolbar dwh -> snapshots diagram not direct. manage snapshots from the list; transformations can later reference a snapshot. visual element snapshots list page screen overview id property description 1 search criteria filter area at the top of the page. 2 search field text field used to filter snapshots by name, update sql, or description. press enter to run the same filter as the search button. 3 search runs the filter and refreshes the snapshots grid. 4 clear filter clears the search field and reloads the full snapshot list. 5 name grid column for the snapshot name. 6 update sql grid column showing the sql expression used by the snapshot definition. 7 description grid column describing the purpose of the snapshot. 8 snapshots grid read-only result list for reviewing snapshots. double-click a row to open it on the snapshot page. 9 delete deletes the selected snapshot after user confirmation, then refreshes the page. 10 new starts a new snapshot from the list page. the navigation tree also offers add snapshot for opening the editor directly. related topics snapshots navigation tree snapshot page snapshot groups dwh toolbar previous snapshot groups nextsource references"}
,{"id":386688842981,"name":"Source references","type":"topic","path":"/docs/reference/user-interface/lists/lists-source-references","breadcrumb":"Reference › User Interface › Lists › Source references","description":"","searchText":"reference user interface lists source references overview source references is the searchable list page for relationships between source objects. use it to review how two source-side objects are connected, open an existing reference for editing, create a new reference, or remove a reference that is no longer needed. function the page combines a search filter with a read-only result grid. the search field can narrow the list by description, source names, schemas, aliases, join type, cardinality, or reference statement, and the clear-filter button reloads the matching references. each result shows the two sides of the relationship, the cardinality, the description, and the reference expression used to connect the sources. double-clicking a row opens that reference for editing. use new to start a new source reference, or delete to remove the selected reference after confirmation. access open the list from the sources toolbar or from a connector or source branch in the navigation tree. when it is opened from a connector or a source, the list is scoped to that context so the user starts with the most relevant references. how to access navigation tree connectors -> [connector] -> source references -> list source references; or connectors -> [connector] -> sources -> [source] -> references -> list source references. toolbar sources -> references diagram not opened directly from the diagram. use the navigation tree or sources toolbar to open the list. visual element source references list page screen overview id property description 1 search criteria area that contains the text filter and search actions for narrowing the reference list. 2 search field text field for searching by description, source names, schemas, aliases, join type, cardinality, or reference statement. 3 search applies the current search text to the source-reference list. 4 clear filter clears the search text and reloads the matching references for the current connector or source context. 5 connector1 grid column for the connector on the first source side of the reference. 6 schema1 grid column for the schema on the first source side. 7 source1 grid column for the first source in the relationship. 8 connector1 grid column for the connector on the second source side of the reference. 9 schema1 grid column for the schema on the second source side. 10 source1 grid column for the second source in the relationship. 11 cardinality shows how records on the first side relate to records on the second side. 12 description business description used to identify the reference. 13 references shows the reference expression that connects the two source sides. 14 source references grid read-only list of matching source references. double-click a row to open it for editing. 15 new starts a new source reference. 16 delete deletes the selected source reference after confirmation. related topics source reference sources sources toolbar connectors navigation tree previous snapshots nextsources"}
,{"id":386688842982,"name":"Sources","type":"topic","path":"/docs/reference/user-interface/lists/lists-sources","breadcrumb":"Reference › User Interface › Lists › Sources","description":"","searchText":"reference user interface lists sources overview sources is the searchable list page for source definitions under analyticscreator connectors. use it to find sources by schema, name, connector, type, path, friendly name, or description, then open the selected source for review or maintenance. function the page combines a search filter with a read-only result grid. when the list is opened from a connector branch, it is scoped to that connector. when it is opened from the sources toolbar, it lists sources across the project. the search field filters by description, connector name, source schema, or source name. press enter or use search to apply the filter, and use the clear-filter button to reset the list. double-click a row to open the source page for that entry. use delete to remove the selected source after confirmation. access open the list from a connector branch in the navigation tree or from the sources command in the sources toolbar. the connector branch also offers create new source and read source from connector, but those commands open separate creation flows rather than adding a row from this list. how to access navigation tree connectors -> [connector] -> sources -> list sources toolbar sources -> sources diagram not opened directly from the diagram. use the navigation tree or sources toolbar to open the list. visual element sources list page screen overview id property description 1 search criteria filter area at the top of the page. 2 search field text field used to search sources by description, connector name, source schema, or source name. press enter to run the same filter as the search button. 3 search applies the current search text and refreshes the sources grid. 4 clear filter clears the search field and reloads sources for the current connector context or the full project list. 5 source schema grid column showing the schema assigned to the source. 6 source name grid column showing the source name. 7 connector grid column showing the connector that owns the source. 8 type grid column showing the source type. 9 path grid column for the source path when a path is configured. 10 friendly name grid column for the business-friendly source name. 11 description grid column describing the source. 12 sources grid read-only result list for reviewing sources. double-click a row to open it on the source page. 13 delete deletes the selected source after user confirmation, then refreshes the list. related topics source page source references sources toolbar connectors navigation tree previous source references nextsql script"}
,{"id":386688842983,"name":"SQL Script","type":"topic","path":"/docs/reference/user-interface/lists/lists-sql-script","breadcrumb":"Reference › User Interface › Lists › SQL Script","description":"","searchText":"reference user interface lists sql script overview sql script is the searchable list page for sql scripts used by analyticscreator workflows, deployment steps, and repository operations. use it to find scripts by name, review their category and description, open an existing script for editing, adjust script order inside a category, create a new script, or delete a script that is no longer needed. function the page combines a search filter with a read-only result grid. the search field narrows the list by script name. the list can be opened across all script categories from the etl toolbar, or from a specific script category in the navigation tree. each row shows the script name, script category, and description. double-click a row to open the sql script page for that entry. use the move up and move down buttons to change the selected script's order within its current category. use new to create a script and delete to remove the selected script after confirmation. access open the list from the scripts area in the navigation tree or from the scripts command in the etl toolbar. script category branches provide list and add commands for pre-creation, post-creation, pre-deployment, post-deployment, pre-workflow, post-workflow, and repository extension scripts. how to access navigation tree scripts -> [script category] -> list [category] scripts toolbar etl -> scripts diagram not opened directly from the diagram. use the scripts navigation tree or etl toolbar to open the list. visual element sql script list page screen overview id property description 1 search criteria filter area at the top of the page. 2 search field text field used to filter sql scripts by script name. press enter to run the same filter as the search button. 3 search applies the current search text and refreshes the sql scripts grid. 4 clear filter clears the search field and reloads scripts for the current category context or the full project list. 5 status indicator indicator column for the row status icon. 6 name grid column showing the script name. 7 type grid column showing the script category, such as post-creation or pre-deployment. 8 description grid column describing the purpose of the script. 9 sql scripts grid read-only result list for reviewing scripts. double-click a row to open it on the sql script page. 10 move up moves the selected script earlier within the same script category, then refreshes the list. 11 move down moves the selected script later within the same script category, then refreshes the list. 12 delete deletes the selected script after user confirmation, then refreshes the list. 13 new opens the sql script page to create a new script. related topics sql script page etl toolbar post-creation scripts repository extension scripts previous sources nexttable references"}
,{"id":386688842984,"name":"Table references","type":"topic","path":"/docs/reference/user-interface/lists/lists-table-references","breadcrumb":"Reference › User Interface › Lists › Table references","description":"","searchText":"reference user interface lists table references overview table references is the searchable list page for relationships between warehouse tables. use it to find references by table, schema, cardinality, relationship condition, description, or inheritance state, then open the selected reference for detailed maintenance. function the page combines a search filter with a result grid. the dwh toolbar opens the full reference list. when the list is opened from a schema, table, or diagram context, the results are scoped to that schema, table, or table pair. the search field filters by description, parent description, both table names, both schema names, table aliases, join type, cardinality, and reference statement text. double-click a row to open the table reference page. use new to create a reference and delete to remove the selected reference after confirmation. the list also supports quick maintenance of inactive, force inheritance, and don't inherit. change those values in the grid, then use save to persist the list-level changes. access open the list from a table's references node in the navigation tree, from the references command in the dwh toolbar, or from the reference commands on the diagram context menu. how to access navigation tree layers -> [layer] -> [schema] -> tables -> [table] -> references -> list references toolbar dwh -> references diagram references -> list references from a diagram object. a relationship with multiple matching references can also open this list. visual element table references list page screen overview id property description 1 search criteria filter area at the top of the page. 2 search field text field used to filter table references by table, schema, alias, cardinality, join type, reference statement, description, or parent description. press enter to run the same filter as the search button. 3 search applies the current search text and refreshes the table references grid. 4 clear filter clears the search field and reloads references for the current context or the full project list. 5 autcreated checkbox column indicating whether the reference was created automatically. 6 used checkbox column indicating whether the reference is used by a transformation. 7 schema1 grid column showing the schema for the first table in the reference. 8 table1 grid column showing the first table in the reference. 9 schema2 grid column showing the schema for the second table in the reference. 10 table2 grid column showing the second table in the reference. 11 doublesided checkbox column for two-sided reference handling when that state is available. 12 inactive editable checkbox for deactivating or reactivating the reference. use save to persist changes. 13 force inheritance editable checkbox for forcing inheritance behavior on the reference. use save to persist changes. 14 don't inherit editable checkbox for preventing inherited behavior on the reference. use save to persist changes. 15 cardinality grid column showing the relationship cardinality. 16 references grid column showing the relationship condition between the two tables. 17 description grid column describing the table reference. 18 parentdescription grid column showing the parent reference description when one exists. 19 table references grid result list for reviewing table references. double-click a row to open it on the table reference page. 20 new opens the table reference page to create a new reference. 21 save saves list-level changes to inactive and inheritance settings, then refreshes the list. 22 delete deletes the selected table reference after user confirmation, then refreshes the page. related topics table reference page dwh toolbar tables table page previous sql script nexttables"}
,{"id":386688842985,"name":"Tables","type":"topic","path":"/docs/reference/user-interface/lists/lists-tables","breadcrumb":"Reference › User Interface › Lists › Tables","description":"","searchText":"reference user interface lists tables overview the tables list shows table definitions with schema, historization, persisting, type, friendly name, and description information. function use the list to review table metadata and identify how tables relate to historization or persisting output. delete removes the selected table when the current context and permissions allow it. access open tables from the dwh toolbar tab or from a schema branch in the navigation tree. how to access navigation tree model -> layers -> [layer] -> [schema] -> tables -> list tables. toolbar dwh -> tables. diagram not opened directly from the diagram. visual element tables list screen overview id property description 1 search criteria area used to filter table rows. 2 search applies the current search criteria. 3 table schema schema that contains the table. 4 table name name of the table. 5 historization of table historization relationship for the table. 6 persistence of table persisting relationship for the table. 7 table type business type assigned to the table. 8 friendly name business-friendly display name. 9 description business description or notes for the object. 10 delete deletes the selected table. related topics dwh toolbar table page schemas list page indexes list page previous table references nexttransformations"}
,{"id":386688842986,"name":"Transformations","type":"topic","path":"/docs/reference/user-interface/lists/lists-transformations","breadcrumb":"Reference › User Interface › Lists › Transformations","description":"","searchText":"reference user interface lists transformations overview transformations is the searchable list page for transformation definitions in the warehouse model. use it to find transformations by schema, name, transformation type, historization type, or dummy-entry setting, then open the selected transformation for detailed maintenance. function the page combines a search filter with a read-only result grid. the etl toolbar opens the full transformation list. when the list is opened from a schema in the navigation tree, the results are scoped to that schema. the search field filters by schema name, transformation name, and historization type. press enter or use search to refresh the list, and use the clear-filter action to return to the current context's full result set. each row shows the schema, transformation name, transformation type, historization type, and whether dummy-entry creation is enabled. double-click a row to open the transformation page. use new to start the transformation creation assistant, duplicate to copy a supported selected transformation, and delete to remove the selected transformation after confirmation. access open the list from a schema's transformations node in the navigation tree or from the transformations command in the etl toolbar. how to access navigation tree layers -> [layer] -> [schema] -> transformations -> list transformations toolbar etl -> transformations diagram not opened directly from the diagram. use the navigation tree or etl toolbar to open the list. visual element transformations list page screen overview id property description 1 search criteria filter area at the top of the page. 2 search field text field used to filter transformations by schema name, transformation name, or historization type. press enter to run the same filter as the search button. 3 search applies the current search text and refreshes the transformations grid. 4 clear filter clears the search field and reloads transformations for the current schema context or the full project list. 5 schema grid column showing the schema that contains the transformation. 6 name grid column showing the transformation name. 7 type grid column showing the transformation category. 8 hist type grid column showing the historization behavior assigned to the transformation. 9 createdummyentry checkbox column indicating whether dummy-entry creation is enabled for the transformation. 10 transformations grid read-only result list for reviewing transformations. double-click a row to open it on the transformation page. 11 new starts the transformation creation assistant. depending on the selection, the flow can continue to the transformation page or the related table page. 12 duplicate creates a copy of the selected transformation when that transformation can be duplicated, then refreshes the list. 13 delete deletes the selected transformation after user confirmation, then refreshes the page. related topics transformation page etl toolbar transformations navigation tree transformation diagram object previous tables nextuser groups"}
,{"id":386688842987,"name":"User groups","type":"topic","path":"/docs/reference/user-interface/lists/lists-user-groups","breadcrumb":"Reference › User Interface › Lists › User groups","description":"","searchText":"reference user interface lists user groups overview the user groups list maintains user group names and rights. function use the list to search groups, review or change rights, add new groups, leave a group, or delete a selected group. rights values control the level of access assigned to each group. access open user groups from the options toolbar tab. how to access navigation tree not opened from the navigation tree. toolbar options -> user groups. diagram not opened directly from the diagram. visual element user groups list screen overview id property description 1 search criteria area used to filter user group rows. 2 search applies the current search criteria. 3 name business name shown in lists and navigation. 4 rights rights assigned to the group. 5 delete deletes the selected group. 6 leave leaves the selected group. 7 new creates a new group row. related topics options toolbar object groups dialog login dialog interface settings dialog previous transformations nextdialogs"}
,{"id":383509396684,"name":"Dialogs","type":"subsection","path":"/docs/reference/user-interface/dialogs","breadcrumb":"Reference › User Interface › Dialogs","description":"","searchText":"reference user interface dialogs the dialogs section covers the focused pop-up workflows that support configuration, validation, search, preview, synchronization, and repository maintenance in analyticscreator. use these topics to understand when a dialog appears, which decision it supports, and how it fits into broader activities such as metadata refresh, cloud operations, upgrades, and day-to-day authoring. available topics about the about dialog shows information about analyticscreator, including the installed version. open about dwh settings the dwh settings dialog is used for common dwh settings. open dwh settings error description the error description dialog is a common dialog containing errors, warnings and messages. open error description eula the eula dialog displays the end user licence agreement. open eula input dialog the input dialog is the common text-entry prompt used by analyticscreator. open input dialog input dialog with drop-down the input dialog with drop-down is used when the user must choose one value from a prepared list. open input dialog with drop-down open/save in cloud the open/save in cloud dialog is used to load or store data in the cloud. open open/save in cloud preview source data the preview source data dialog is used to preview source data. open preview source data upgrade repository the upgrade repository dialog shows the progress of a repository upgrade. open upgrade repository refresh source metadata the refresh source metadata dialog is used for dialog to update source metadata. open refresh source metadata search the search dialog is the common search dialog used across the application. open search thumbnail diagram the thumbnail diagram dialog is used in the analyticscreator user interface. open thumbnail diagram source constraints the source constraints dialog is used for information about source constraints. open source constraints synchronize dwh the synchronize dwh dialog is used to synchronize the dwh. open synchronize dwh interface settings the interface settings dialog is used for analyticscreator interface settings. open interface settings login the login dialog is shown at the start of analyticscreator to sign the user in. open login object groups the object groups dialog shows information about the groups of a specific object. open object groups how to use this section start with about, eula, login, and interface settings for environment, access, and application-level context. use input dialog and input dialog with drop-down when a workflow depends on guided data entry or assisted selection. use preview source data, refresh source metadata, search, and source constraints when inspecting or troubleshooting source-side behavior. use synchronize dwh, upgrade repository, and open/save in cloud when the task affects repository lifecycle, synchronization, or environment operations. key takeaway the dialogs section explains the short, decision-oriented interaction surfaces that support guided work across the analyticscreator interface. previous user groups nextabout"}
,{"id":386707108084,"name":"About","type":"topic","path":"/docs/reference/user-interface/dialogs/dialogs-about","breadcrumb":"Reference › User Interface › Dialogs › About","description":"","searchText":"reference user interface dialogs about overview the about dialog shows product, company, version, web, mail, and support details for analyticscreator. function use the dialog to confirm the installed application version and product identity. the contact rows provide the vendor, website, mail, and support information shown by the application. access open the about dialog from the help toolbar tab. how to access navigation tree not opened from the navigation tree. toolbar help -> about. diagram not opened directly from the diagram. visual element about dialog screen overview id property description 1 company company name shown in the dialog. 2 program application name shown in the dialog. 3 version installed application version. 4 web website link for product information. 5 mail contact email shown by the application. 6 support support contact shown by the application. 7 close closes the dialog. related topics help toolbar eula dialog interface settings dialog dwh settings dialog previous dialogs nextdwh settings"}
,{"id":386707108085,"name":"DWH settings","type":"topic","path":"/docs/reference/user-interface/dialogs/dialogs-dwh-settings","breadcrumb":"Reference › User Interface › Dialogs › DWH settings","description":"","searchText":"reference user interface dialogs dwh settings overview the dwh settings dialog maintains common data warehouse naming fields used by generated structures. function use the standard fields to define repository ownership, surrogate key naming, validity fields, hash key naming, and empty-record handling. optional historization fields let teams define technical validity and relationship key names used in historized structures. access open the dialog from the options toolbar tab. how to access navigation tree not opened from the navigation tree. toolbar options -> dwh settings. diagram not opened directly from the diagram. visual element dwh settings dialog screen overview id property description 1 repository owner owner name used for repository-level ownership metadata. 2 surrogate key field default surrogate key field name. 3 valid from field default valid-from field name. 4 valid to field default valid-to field name. 5 hashkey field default hash key field name. 6 empty record field field used to identify empty-record handling. 7 optional historization fields section for historization-specific technical field names. 8 technical valid from date field technical valid-from date field name. 9 technical valid to date field technical valid-to date field name. 10 root surrogate key field root surrogate key field name for historized relationships. 11 previous surrogate key field previous surrogate key field name. 12 next surrogate key field next surrogate key field name. 13 default restores the default naming values. 14 cancel leaves the page without continuing the current edit. 15 save saves the current definition, refreshes the relevant navigation or list, and keeps the page consistent with the saved state. related topics options toolbar interface settings dialog hash keys wizard dwh toolbar previous about nexterror description"}
,{"id":386707108086,"name":"Error description","type":"topic","path":"/docs/reference/user-interface/dialogs/dialogs-error-description","breadcrumb":"Reference › User Interface › Dialogs › Error description","description":"","searchText":"reference user interface dialogs error description overview error description is the dialog analyticscreator uses to show an application error with optional troubleshooting detail. it presents the readable error message first and keeps the technical trace available when support or troubleshooting requires it. function when an error is reported, analyticscreator prepares a readable message, includes inner-error text when available, removes common database warning text that does not help the user, and opens the error dialog in front of the application. if the application is connected, the original message and stack trace can also be written to the application log. the dialog has two tabs: error message for the user-facing explanation and stack trace for the technical call path. both text areas are read-only and include scroll bars so longer messages can be reviewed without changing the content. access this dialog is not opened from a normal menu. it appears automatically when a workflow or background action reports an error that needs to be shown to the user. how to access navigation tree not direct. the dialog opens from error handling. toolbar not direct. it appears after an error in the current workflow. diagram not direct. diagram actions can trigger it when an error is reported. visual element error dialog screen overview id property description 1 error dialog modal window that appears above the application when analyticscreator needs to show an error. 2 error message tab that shows the cleaned, readable error message for the user. 3 message text area read-only text area for the error message. scroll bars are available for longer messages. 4 stack trace tab that shows the technical call path for troubleshooting. 5 stack trace text area read-only text area for technical detail. it can remain empty when no stack trace is available. 6 ok closes the dialog and returns to the application. related topics eula input dialog input dialog with drop-down login previous dwh settings nexteula"}
,{"id":386707108087,"name":"EULA","type":"topic","path":"/docs/reference/user-interface/dialogs/dialogs-eula","breadcrumb":"Reference › User Interface › Dialogs › EULA","description":"","searchText":"reference user interface dialogs eula overview eula is the end-user licence agreement dialog in analyticscreator. it displays the licence agreement so users can review the terms, accept them when acceptance is required, or close the agreement when it is opened for reference. function analyticscreator uses this dialog in two situations. during the agreement check, it can require the user to accept the licence agreement before continuing. from the help area, it can open the same agreement in review mode so the user can read it again later. the agreement text is displayed in the main reading area of the dialog. in acceptance mode, the dialog shows accept and decline. accepting records the agreement and returns to analyticscreator; declining closes the dialog without accepting. in review mode, the acceptance buttons are hidden and the dialog shows close. access open eula from the help toolbar when you need to review the licence agreement. analyticscreator can also show it automatically when a user has not yet accepted the agreement. how to access navigation tree not direct. the dialog opens from help or during the agreement check. toolbar help -> eula diagram not direct. use the help toolbar or the automatic agreement check. visual element end-user licence agreement dialog screen overview related topics error description input dialog input dialog with drop-down previous error description nextinput dialog"}
,{"id":386707108088,"name":"Input dialog","type":"topic","path":"/docs/reference/user-interface/dialogs/dialogs-input-dialog","breadcrumb":"Reference › User Interface › Dialogs › Input dialog","description":"","searchText":"reference user interface dialogs input dialog overview input dialog is the standard text-entry prompt used by analyticscreator when a workflow needs a short value from the user. it is used for values such as model names, filter names, repository names, renamed files, and changed descriptions. function the dialog opens with a workflow-specific title, prompt label, and optional existing value. the text field receives focus immediately so the user can type a new value or edit the prefilled value without selecting the field first. choose ok to return the text field value to the workflow. choose cancel to close the prompt without returning a value. any workflow-specific validation, such as checking whether a required name is empty or already used, is handled by the workflow that opened the prompt. access this dialog is not opened as a standalone page. it appears automatically from commands that need a typed value before they can continue. how to access navigation tree not direct. it appears when a selected workflow asks for a typed value. toolbar opened by toolbar commands that need a name or description. diagram opened by diagram workflows when they need a typed name. visual element input dialog screen overview id property description 1 dialog title workflow-specific title, such as model name, enter filter name, new repository, rename, or change description. 2 prompt label explains what value should be entered, such as enter name, filter name, repository name, new name, or new description. 3 text field editable input field. it can be prefilled with an existing value when the workflow provides one. 4 cancel closes the prompt without returning an entered value to the workflow. 5 ok confirms the text field value and returns it to the workflow that opened the prompt. related topics error description eula input dialog with drop-down interface settings previous eula nextinput dialog with drop-down"}
,{"id":386707108089,"name":"Input dialog with drop-down","type":"topic","path":"/docs/reference/user-interface/dialogs/dialogs-input-dialog-with-dropbox","breadcrumb":"Reference › User Interface › Dialogs › Input dialog with drop-down","description":"","searchText":"reference user interface dialogs input dialog with drop-down overview input dialog with dropbox is the standard drop-down selection prompt used by analyticscreator when a workflow needs the user to choose one value from a prepared list. it is used for choices such as selecting a model, star, repository, database, or table. function the dialog opens with a workflow-specific title, prompt label, and list of available values. when the workflow provides a default value and that value exists in the list, the dialog preselects it for the user. choose ok to return the selected value to the workflow. choose cancel to close the prompt without returning a value. any follow-up validation is handled by the workflow that opened the dialog. access this dialog is not opened as a standalone page. it appears automatically when a command needs the user to choose from a short list before the workflow can continue. how to access navigation tree not direct. it appears when a selected workflow asks for a listed value. toolbar opened by toolbar commands that need a selection from an available list. diagram opened by diagram workflows when they need a model or star selection. visual element input dialog with drop-down list screen overview id property description 1 dialog title workflow-specific title, such as select model, optional: select star, connect to repository, select database, or select table. 2 prompt label explains the type of value to select, such as model, star, enter name, database, or table. 3 drop-down list shows the available values supplied by the workflow. a matching default value can be preselected. 4 cancel closes the prompt without returning a selected value to the workflow. 5 ok confirms the selected value and returns it to the workflow that opened the prompt. related topics eula input dialog interface settings login previous input dialog nextopen/save in cloud"}
,{"id":386707109053,"name":"Open/save in cloud","type":"topic","path":"/docs/reference/user-interface/dialogs/dialogs-open-save-in-cloud","breadcrumb":"Reference › User Interface › Dialogs › Open/save in cloud","description":"","searchText":"reference user interface dialogs open/save in cloud overview open/save in cloud lets users load a repository backup from analyticscreator cloud storage or save the current repository back to cloud storage. function the same list repositories dialog supports both directions. in load mode, select a cloud repository entry, confirm with ok, and then provide the repository name that should be opened locally. in save mode, enter a cloud name and optional description, then choose ok to save the current repository to cloud storage. the repository list can group entries and shows each entry with its name, saved date, and description. a context menu on a repository entry can rename it, change its description, delete the selected entry, or delete the selected entry together with its change history. access open this dialog from the file toolbar. load from cloud starts the cloud restore workflow. save to cloud saves the connected repository to cloud storage. how to access navigation tree not direct. use the file toolbar. toolbar file -> load from cloud or file -> save to cloud diagram not direct. the diagram does not open this dialog. visual element list repositories dialog screen overview id property description 1 repository list displays cloud repository entries. entries can be grouped and each entry shows its name, saved date, and description. 2 selected repository selecting an entry marks the cloud repository that will be opened or managed. 3 name cloud repository name. in save mode, this field can be edited before saving. 4 description optional description stored with the cloud repository entry. 5 rename renames the selected cloud repository entry. 6 change description updates the description for the selected cloud repository entry. 7 delete deletes the selected cloud repository entry after confirmation. 8 delete all deletes the selected cloud repository entry and its change history after confirmation. 9 ok confirms the selected cloud repository in load mode or saves the current repository in save mode. 10 cancel closes the dialog without opening or saving a cloud repository. related topics file toolbar login previous input dialog with drop-down nextpreview source data"}
,{"id":386707109054,"name":"Preview source data","type":"topic","path":"/docs/reference/user-interface/dialogs/dialogs-preview-source-data","breadcrumb":"Reference › User Interface › Dialogs › Preview source data","description":"","searchText":"reference user interface dialogs preview source data overview preview source data shows a read-only sample of data returned by a selected source. use it to check source connectivity, inspect returned columns, and test a filter before building or refreshing downstream objects. function when the dialog opens, analyticscreator loads sample rows for the selected source and displays them in a grid. the grid creates columns from the returned source fields and supports scrolling through the preview result. use filter, num of rows, and timeout (sec) to control the next preview request. choose apply to rerun the preview with those settings. choose ok to close the dialog after reviewing the sample data. for file-based csv sources, the preview command opens the source file directly instead of showing the preview grid. access open preview source data from a source in the navigation tree or from a source object on the architecture diagram. how to access navigation tree sources -> source -> preview data toolbar not direct. use a source context menu in the navigation tree or diagram. diagram architecture source object -> preview data visual element preview dialog screen overview id property description 1 preview grid read-only grid that displays sample rows returned by the selected source. columns are created from the returned source fields. 2 filter filter text used for the next preview request. 3 num of rows maximum number of rows to request for the preview. the value must be numeric before the preview can run. 4 timeout (sec) maximum time, in seconds, allowed for the preview query before it times out. 5 apply reruns the preview with the current filter, row count, and timeout settings. 6 ok closes the preview dialog. related topics sources list source page source in the dataflow diagram refresh source metadata previous open/save in cloud nextupgrade repository"}
,{"id":386707109060,"name":"Upgrade repository","type":"topic","path":"/docs/reference/user-interface/dialogs/dialogs-upgrade-repository","breadcrumb":"Reference › User Interface › Dialogs › Upgrade repository","description":"","searchText":"reference user interface dialogs upgrade repository overview upgrade repository is the progress dialog shown when analyticscreator updates an existing repository so it can be opened with the current application version. function the dialog starts the repository update automatically, shows progress and update messages, and keeps the ok button unavailable until the update process has finished. analyticscreator can show this dialog when connecting to an existing repository or when loading a repository backup that requires an update before it can be used. access open a repository from the file toolbar. if the selected repository must be updated, analyticscreator opens the update progress dialog before loading the repository workspace. how to access navigation tree not direct. repository upgrades run before the repository tree is loaded. toolbar file -> repository -> connect, or file -> backup and restore -> load from file / load from cloud. diagram not direct. the dialog appears during repository connection or restore. visual element updating repository dialog screen overview id property description 1 updating repository window title used while analyticscreator updates an existing repository. 2 progress message initial message telling the user that the repository update is running and to wait. 3 update log read-only area that lists progress messages, validation messages, or errors from the update process. 4 scrollable output the output area can scroll when long messages or many update steps are shown. 5 ok button that remains disabled during the update and becomes available when the process finishes. 6 completion after completion, ok closes the dialog and continues opening the updated repository. related topics file toolbar input dialog with drop-down login synchronize dwh previous preview source data nextrefresh source metadata"}
,{"id":386707109055,"name":"Refresh source metadata","type":"topic","path":"/docs/reference/user-interface/dialogs/dialogs-refresh-source-metadata","breadcrumb":"Reference › User Interface › Dialogs › Refresh source metadata","description":"","searchText":"reference user interface dialogs refresh source metadata overview refresh source metadata updates analyticscreator source definitions from the connected source system. use it after source tables, columns, descriptions, primary keys, or source references have changed outside analyticscreator. function the dialog can refresh all sources for a connector, only the connector sources that are already used, or a single selected source. it can compare metadata without saving changes, update source descriptions and columns, remove missing metadata, refresh primary keys, and refresh source references. when you choose ok, analyticscreator runs the selected refresh options and shows a log when messages or errors are available. some connector types require a valid connection before metadata can be refreshed; file-based csv connections are not refreshed through this dialog. access open refresh source metadata from connector and source context menus in the navigation tree, or from a source object on the architecture diagram. how to access navigation tree connector -> refresh used sources or refresh all sources. source -> refresh structure. toolbar not direct. use the connector or source context menu. diagram architecture source object -> refresh source visual element refresh sources dialog screen overview id property description 1 detect differences without changing the repository runs the refresh as a comparison so differences can be reviewed without saving metadata changes. 2 delete missing sources removes source definitions that no longer exist in the connected source system when changes are applied. 3 refresh source descriptions updates source-level descriptions from the connected source metadata. 4 refresh existing source columns updates metadata for columns that already exist in the analyticscreator source definition. 5 refresh columns in imported tables updates imported table columns that depend on the refreshed source metadata. 6 delete missing columns in imported tables removes imported table columns that are no longer present in the source metadata when changes are applied. 7 refresh primary keys in imported tables updates imported table primary key metadata from the refreshed source definition. 8 refresh descriptions in imported tables updates imported table and column descriptions that come from source metadata. 9 refresh source references refreshes relationships between source objects after the metadata refresh. 10 progress bar shows progress while connector sources are being refreshed. 11 ok runs the refresh with the selected options and stores the option choices for future refreshes. 12 cancel closes the dialog without running the refresh. related topics sources list source page source in the dataflow diagram preview source data previous upgrade repository nextsearch"}
,{"id":386707109056,"name":"Search","type":"topic","path":"/docs/reference/user-interface/dialogs/dialogs-search","breadcrumb":"Reference › User Interface › Dialogs › Search","description":"","searchText":"reference user interface dialogs search overview search helps users find objects that are already visible on the active dataflow diagram. use it when a diagram contains many sources, tables, transformations, packages, or relationships and you need to jump directly to a known object. function the search dialog accepts a keyword, optional whole-word matching, and optional case-sensitive matching. it searches diagram object labels and moves through matching results with find next (f3) and find previous (shift+f3). when a match is found, analyticscreator scrolls the diagram to the matching object and highlights its label. the most recent keyword remains available for the next f3 or shift+f3 search. if no object matches the keyword, analyticscreator shows a message that the keyword was not found. access open search from the file toolbar while the dataflow diagram is active, or use the keyboard shortcuts while working in the diagram. how to access navigation tree not direct. use search while the dataflow diagram is active. toolbar file -> find on diagram diagram press ctrl+f, f3, or shift+f3 while the diagram is active. visual element search dialog and highlighted diagram label screen overview id property description 1 keyword search text used to match visible diagram object labels. 2 recent keyword list keeps previous search terms available so the latest keyword can be reused with f3 or shift+f3. 3 match whole word limits results to complete object-label matches instead of partial text matches. 4 match case requires the capitalization in the keyword to match the diagram label. 5 find next (f3) moves to the next matching object and brings it into view on the diagram. 6 find previous (shift+f3) moves to the previous matching object in the result list. 7 cancel closes the dialog without changing the current diagram focus. 8 highlighted diagram label shows the object currently selected by the search result. related topics search in the dataflow diagram filters object groups file toolbar previous refresh source metadata nextthumbnail diagram"}
,{"id":386707109059,"name":"Thumbnail diagram","type":"topic","path":"/docs/reference/user-interface/dialogs/dialogs-tumbnail-diagram","breadcrumb":"Reference › User Interface › Dialogs › Thumbnail diagram","description":"","searchText":"reference user interface dialogs thumbnail diagram overview thumbnail diagram is a small floating window that shows a scaled overview of the active architecture diagram. use it to navigate large diagrams without losing the overall layout. function the thumbnail diagram window displays a miniature image of the current diagram canvas. click a position in the thumbnail to scroll the main diagram so that the selected area moves into view. analyticscreator remembers the thumbnail window size, position, and whether it was visible when the architecture diagram was last closed. if the active diagram is too large to preview reliably, the thumbnail is not opened and a message explains that the diagram is too big. access open thumbnail diagram from the architecture diagram context menu. the window can also reopen automatically with the architecture diagram when it was left visible in the previous session. how to access navigation tree not direct. open the architecture diagram first. toolbar not direct. use the architecture diagram context menu. diagram architecture diagram -> show thumbnail visual element thumbnail diagram window screen overview id property description 1 thumbnail diagram floating tool window that previews the full architecture diagram in a compact view. 2 thumbnail image scaled image of the active diagram canvas. 3 click navigation clicking the thumbnail scrolls the main diagram toward the selected position. 4 main diagram target the clicked thumbnail position is centered in the visible area of the main diagram when possible. 5 remembered size the window reuses the last saved width and height when it is opened again. 6 remembered position the window reopens near its previous location or docked corner. 7 automatic reopen if the thumbnail was visible when the diagram was closed, it can reopen with the architecture diagram. 8 large diagram guard very large diagrams are blocked from thumbnail preview to avoid unreliable rendering. 9 keyboard handling keyboard commands continue to be handled by the main analyticscreator window while the thumbnail window has focus. related topics dataflow diagram filters search in the dataflow diagram interface settings previous search nextsource constraints"}
,{"id":386707109057,"name":"Source constraints","type":"topic","path":"/docs/reference/user-interface/dialogs/dialogs-source-constraints","breadcrumb":"Reference › User Interface › Dialogs › Source constraints","description":"","searchText":"reference user interface dialogs source constraints overview source constraints define validation or exclusion rules for rows that come from a selected source. use them when source data needs a documented condition before it is imported or used by downstream objects. function the source constraints dialog shows the constraints for one source in an editable grid. each row can be tied to a source column, marked so matching rows are not imported, and given a rule statement, message statement, and business description. when a new row is added, analyticscreator associates it with the selected source. choose save to store the grid changes and refresh the list. choose cancel to close the dialog without saving pending edits. access open source constraints from the source navigation tree commands or from the constraints button on the source page. a source must already be saved before constraints can be edited. how to access navigation tree sources -> source -> constraints -> list source constraints or add source constraint. existing constraint -> edit source constraint. toolbar not direct. open the source page or use the source navigation-tree commands. diagram not direct. edit constraints from the source record. visual element source page -> constraints screen overview id property description 1 source constraints editable list of validation or exclusion rules for the selected source. 2 column selects the source column that the constraint is related to. 3 do not import marks the rule as one that prevents matching source rows from being imported. 4 statement defines the rule expression used to evaluate source data. 5 messagestatement stores the message or message expression associated with the constraint. 6 description provides a business description so the purpose of the constraint is clear in the source tree. 7 save stores all grid changes and reloads the constraint list. 8 cancel closes the dialog without saving pending edits. related topics source page sources preview source data refresh source metadata previous thumbnail diagram nextsynchronize dwh"}
,{"id":386707109058,"name":"Synchronize DWH","type":"topic","path":"/docs/reference/user-interface/dialogs/dialogs-synchronize-dwh","breadcrumb":"Reference › User Interface › Dialogs › Synchronize DWH","description":"","searchText":"reference user interface dialogs synchronize dwh overview synchronize dwh updates the data warehouse structure and refreshes the diagram metadata that analyticscreator uses to show warehouse objects. use it after model changes, source changes, repository maintenance, or when the diagram needs to reflect newly created objects. function the synchronize and refresh dialog lets users choose the synchronization scope, the diagram refresh scope, and optional maintenance tasks. the templates at the top apply common combinations for a full run, a selected group, new objects only, all standard additional tasks, or no additional tasks. choose ok to save the selected options and start the operation. while synchronization is running, the toolbar command changes to stop sync, which requests cancellation. when the run finishes, analyticscreator refreshes the diagram and reports any returned errors in a log prompt. access open synchronize dwh from the file toolbar, from the data warehouse context menu, or from the architecture diagram context menu. how to access navigation tree dwh -> synchronize dwh toolbar file -> sync dwh diagram architecture diagram -> synchronize dwh visual element synchronize and refresh dialog screen overview id property description 1 templates preset buttons for common synchronization and refresh combinations. 2 full selects a full synchronization, a full diagram refresh, and the standard additional maintenance tasks. 3 selected group limits synchronization and diagram refresh to the active object group and clears the standard additional task selections. 4 new objects synchronizes and refreshes only objects that are new to the repository metadata. 5 all additional tasks turns on the standard maintenance tasks used with a full synchronization run. 6 no additional tasks clears the standard maintenance task selections so only synchronization and refresh choices are used. 7 synchronize defines how much data warehouse metadata is synchronized. 8 full synchronize synchronizes the complete data warehouse metadata set. 9 synchronize selected group only synchronizes only the active object group. 10 synchronize new objects only synchronizes only newly detected objects. 11 refresh diagram controls how much of the architecture diagram metadata is refreshed after synchronization. 12 full refresh refreshes the full diagram metadata set. 13 refresh selected group only refreshes diagram metadata for the active object group. 14 refresh new objects only refreshes diagram metadata only for newly detected objects. 15 no refresh runs synchronization without refreshing the architecture diagram metadata afterward. 16 additional tasks optional maintenance actions that can run after the selected synchronization scope. 17 repair repository runs repository repair and related package checks as part of the synchronization workflow. 18 update relations refreshes object relationships after the synchronized metadata is available. 19 update missing olap references adds missing analytical references when relation updates are included. 20 update friendly names refreshes readable names used in the repository and diagram. 21 update descriptions refreshes stored descriptions for synchronized objects. 22 update anonymizations refreshes anonymization metadata for objects that use it. 23 update column dependencies refreshes column-level dependency information. 24 update object groups refreshes object group membership metadata. 25 update test cases refreshes test case metadata used for validation workflows. 26 ok saves the selected options and starts the synchronization workflow. 27 cancel closes the dialog without starting synchronization. 28 stop sync appears on the file toolbar while synchronization is running and requests cancellation when selected. related topics dwh wizard dwh settings file toolbar dwh toolbar previous source constraints nextinterface settings"}
,{"id":386707109050,"name":"Interface settings","type":"topic","path":"/docs/reference/user-interface/dialogs/dialogs-interface-settings","breadcrumb":"Reference › User Interface › Dialogs › Interface settings","description":"","searchText":"reference user interface dialogs interface settings overview interface settings is the dialog for adjusting how analyticscreator displays the application interface. it controls colors, diagram sizing, navigation-tree spacing, and page layout preferences. function the dialog groups visual settings into four tabs: colors, diagram, navigation tree, and pages. use these settings to tune the appearance of diagrams, object boxes, connector lines, navigation-tree items, detail pages, and list pages. the dialog can also load one of three predefined visual profiles with default 1, default 2, or default 3. choose save to store the settings and refresh the architecture view. choose cancel to close the dialog without applying the current edits. access open interface settings from the options toolbar when you need to adjust the visual presentation of analyticscreator. how to access navigation tree not direct. use the options toolbar. toolbar options -> interface diagram not direct. diagram appearance is configured here after opening the dialog from options. visual element interface settings dialog screen overview id property description 1 colors tab for choosing background, foreground, border, line, and highlighted-label colors used in diagrams and interface elements. 2 background and foreground color pickers sets colors for arrows, text, dimensions, facts, sources, tables, views, packages, script transformations, external transformations, and data vault object types. 3 border and line colors controls diagram borders, package borders, object borders, table borders, standard line color, thin line color, and highlighted-label color. 4 diagram tab for numeric diagram layout settings such as arrow size, font size, cell size, header size, box size, scale, and minor connector-line opacity. 5 navigation tree tab for tree icon size, line space, scale, font size, and splitter position. 6 pages tab for detail-page and table-page alignment, maximum width, maximum height, and framescale. 7 default 1 loads the first predefined interface profile into the dialog fields. 8 default 2 loads the second predefined interface profile into the dialog fields. 9 default 3 loads the third predefined interface profile into the dialog fields. 10 cancel closes the dialog without saving the current edits. 11 save saves the interface settings, refreshes the architecture view, and closes the dialog. related topics input dialog input dialog with drop-down login object groups previous synchronize dwh nextlogin"}
,{"id":386707109051,"name":"Login","type":"topic","path":"/docs/reference/user-interface/dialogs/dialogs-login","breadcrumb":"Reference › User Interface › Dialogs › Login","description":"","searchText":"reference user interface dialogs login overview login is the dialog used to sign in to analyticscreator and prepare the connection settings required before a repository can be opened. the standard view collects the analyticscreator user name and password. the expanded settings view contains the sql server, storage path, database template, and proxy settings that support the connection. function the dialog can prefill saved values, focus the next required field, and expand the settings area when connection information is missing or invalid. choose ok to validate the repository sql server connection, proxy details, database templates, and sign-in credentials. when sign-in succeeds, analyticscreator stores the connection settings for the session and can save changed settings for the next session. choose cancel to close the dialog without completing sign-in. access open login from the connection workflow when analyticscreator needs a user session or repository connection. the dialog can also appear automatically when a server action needs a valid session. how to access navigation tree not direct. use the connection workflow or the automatic sign-in prompt. toolbar file -> connect diagram not direct. the dialog appears before connected diagram work can continue. visual element login dialog screen overview id property description 1 login user name used to sign in to analyticscreator. 2 password password for the selected analyticscreator user. 3 save password controls whether the password is remembered with the saved login settings. 4 settings expands or collapses the advanced connection settings. analyticscreator opens this area automatically when required connection information is missing. 5 sql server settings tab for the sql server that stores the repository and the authentication settings used for that server. 6 security chooses the sql server authentication method: integrated, standard, or azure ad. sql user and sql password fields are used when the selected method requires them. 7 trust server certificate allows the sql server connection test to trust the server certificate when the environment requires it. 8 paths tab for the local analyticscreator files path, the sql server database storage path, and the repository and dwh database templates. 9 try to get path attempts to read the sql server database storage path and fill the related path fields. 10 default restores the standard repository or dwh database template for the corresponding template field. 11 proxy settings tab for proxy address, port, user, and password when network access must go through a proxy. 12 cancel closes the dialog without completing sign-in. 13 ok validates the required settings, tests the repository connection, and signs in when the setup is valid. related topics input dialog input dialog with drop-down interface settings object groups previous interface settings nextobject groups"}
,{"id":386707109052,"name":"Object groups","type":"topic","path":"/docs/reference/user-interface/dialogs/dialogs-object-groups","breadcrumb":"Reference › User Interface › Dialogs › Object groups","description":"","searchText":"reference user interface dialogs object groups overview object groups is the dialog used to create, edit, lock, and save groups that organize repository objects. groups can be used for filtering, workflow organization, and inherited membership across related objects. function the dialog displays groups in an editable grid. when it is opened for general group maintenance, the grid focuses on group names, descriptions, workflow settings, script file names, and lock state. when it is opened for a selected object, the grid also shows membership and inheritance columns for that object. choose save to store group definitions and membership changes, then refresh the calculated group relationships. choose cancel to close the dialog without saving pending changes. use lock and unlock to control who can edit a group; unlocking is limited to the user who locked the group or a repository owner. access open object groups from the groups branch in the navigation tree, from an existing group, or from a supported object on the architecture diagram. how to access navigation tree groups -> list groups or groups -> add group. from an existing group, use edit group. toolbar not direct. use the group commands in the navigation tree. diagram architecture object -> object groups visual element groups dialog screen overview id property description 1 member includes the selected object in the group when the dialog is opened from an object context. this column is hidden during general group maintenance. 2 inherit predecessors extends group membership to predecessor objects so upstream dependencies can be included with the selected object. 3 inherit successors extends group membership to successor objects so downstream dependencies can be included with the selected object. 4 inherited shows membership that was inherited through predecessor or successor rules. this state is informational and cannot be activated manually. 5 exclude excludes an inherited object from the group without removing the inheritance rule that brought it into view. 6 name name of the object group shown in the repository navigation tree and group selectors. 7 description business description of the group and its purpose. 8 create workflow marks the group as a workflow group. when enabled, analyticscreator can fill the workflow script file names from the group name. 9 ssis configuration complete script script file used for the complete workflow configuration step. 10 ssis configuration enable script script file used when enabling the workflow configuration. 11 ssis configuration disable script script file used when disabling the workflow configuration. 12 inherited from objects read-only information that shows which related objects contributed inherited group membership. 13 locked by shows the user who currently locked the group, if the group is locked. 14 lock locks the selected group for the current repository user when it is not already locked. 15 unlock removes the selected group lock when the current user is allowed to unlock it. 16 cancel closes the dialog without saving pending group changes. 17 save saves group definitions and membership changes, then refreshes the calculated object-group relationships. related topics groups object groups in the dataflow diagram object group content filters previous login nextwizards"}
,{"id":383509340360,"name":"Wizards","type":"subsection","path":"/docs/reference/user-interface/wizards","breadcrumb":"Reference › User Interface › Wizards","description":"","searchText":"reference user interface wizards the wizards section documents the guided setup flows that help users create common analyticscreator objects and modeling patterns with structured input steps. use these topics when you want to accelerate object creation, standardize implementation choices, or understand which wizard best fits a given warehouse, transformation, snapshot, or scripting scenario. available topics create calendar dimension explains the guided flow for creating a calendar dimension and defining the date-related structures it needs. open create calendar dimension create datavault object covers the wizard that creates datavault components such as hubs, links, and satellites with guided setup. open create datavault object create export shows how the export wizard guides users through defining outbound data delivery objects. open create export create historization describes the wizard used to create historization objects for tracking changes over time. open create historization create import explains the guided setup used to create new import objects from source metadata. open create import create snapshot dimension covers the wizard used to generate snapshot-oriented dimension structures. open create snapshot dimension create source shows how the source wizard guides users through creating a new source object and its metadata. open create source create time dimension describes the wizard used to generate a reusable time dimension structure. open create time dimension create transformation explains the wizard used to create a new transformation and its initial metadata. open create transformation dwh wizard covers the guided warehouse setup flow for creating foundational dwh structures and decisions. open dwh wizard hash keys explains the wizard that creates or refreshes hash keys and their related relationships. open hash keys persist transformation shows how the persist transformation wizard converts transformation logic into persisted storage structures. open persist transformation run object script describes the guided flow for selecting and executing object scripts against repository objects. open run object script how to use this section start with the create-object wizards for source, import, export, historization, and transformation when building common data pipeline components. use the dimension and data vault wizards when you need guided support for established modeling patterns. use dwh wizard and hash keys when the task requires warehouse-wide setup decisions or key-generation behavior. use persist transformation and run object script for advanced guided actions that continue work after the initial object design stage. key takeaway the wizards section helps users choose the right guided workflow for creating recurring analyticscreator patterns with less manual setup and more consistent implementation. previous object groups nextcreate calendar dimension"}
,{"id":386707109062,"name":"Create calendar dimension","type":"topic","path":"/docs/reference/user-interface/wizards/wizards-create-calendar-dimension","breadcrumb":"Reference › User Interface › Wizards › Create calendar dimension","description":"","searchText":"reference user interface wizards create calendar dimension overview the create calendar dimension wizard creates a calendar transformation for a selected date range and star selection. function choose the schema, name, date range, and date-to-id function, then select the stars that should use the calendar transformation. access open the wizard from the listed navigation, toolbar, or diagram context. how to access navigation tree not direct from the navigation tree. toolbar etl -> calendar dimension. diagram diagram -> add -> calendar dimension. visual element create calendar dimension wizard screen overview id property description 1 schema schema for the calendar transformation. 2 name name of the calendar transformation. 3 date from start date for generated calendar rows. 4 date to end date for generated calendar rows. 5 date-to-id function function used to convert dates into identifiers. 6 stars stars that should use the calendar transformation. 7 >> adds the selected item to the active selection. 8 << removes the selected item from the active selection. 9 finish completes the wizard and creates or updates the selected object. 10 cancel leaves the page without continuing the current edit. related topics etl toolbar transformation page create time dimension wizard create snapshot dimension wizard previous wizards nextcreate datavault object"}
,{"id":386707109063,"name":"Create DataVault object","type":"topic","path":"/docs/reference/user-interface/wizards/wizards-create-datavault-object","breadcrumb":"Reference › User Interface › Wizards › Create DataVault object","description":"","searchText":"reference user interface wizards create datavault object overview the create datavault object wizard creates vault objects from a selected source table. function use the main step to select the source table and generated transformation names, then configure hub, link, satellite, historization, and package options as needed. access open the wizard from the listed navigation, toolbar, or diagram context. how to access navigation tree model -> layers -> [layer] -> [schema] -> tables -> [table] -> add vault. toolbar not direct. start from a table context. diagram table object -> add -> datavault object. visual element datavault wizard screen overview id property description 1 main main setup step for the vault object. 2 source table table used as the source for the vault object. 3 transformation schema schema for generated transformations. 4 transformation name name for the generated transformation. 5 add historization adds historization for the generated object. 6 hub schema schema for the hub object. 7 hub name name for the hub object. 8 hist package historization package used by generated logic. 9 link link setup area. 10 create linksat creates a link satellite when selected. 11 linksat name name for the link satellite. 12 linksat package package for the link satellite. 13 include includes the selected row in the generated set. 14 table table included in the generated vault set. 15 finish completes the wizard and creates or updates the selected object. 16 cancel leaves the page without continuing the current edit. related topics table page transformation page create historization wizard dwh toolbar previous create calendar dimension nextcreate export"}
,{"id":386707109064,"name":"Create export","type":"topic","path":"/docs/reference/user-interface/wizards/wizards-create-export","breadcrumb":"Reference › User Interface › Wizards › Create export","description":"","searchText":"reference user interface wizards create export overview the create export wizard creates an export package item that sends table or transformation output to a connector target. function choose the source object, connector target, and package, then finish the wizard to create the export definition. access open the wizard from the listed navigation, toolbar, or diagram context. how to access navigation tree packages -> export -> add export package. toolbar etl -> packages, open an export package, then add export content. diagram table or transformation object -> add -> export. visual element export wizard screen overview id property description 1 source table or transformation used as the export source. 2 connector connector used as the export target. 3 target target object or location for the export. 4 package export package that will contain the export item. 5 finish completes the wizard and creates or updates the selected object. 6 cancel leaves the page without continuing the current edit. related topics export page package page etl toolbar packages list page previous create datavault object nextcreate historization"}
,{"id":386707109065,"name":"Create historization","type":"topic","path":"/docs/reference/user-interface/wizards/wizards-create-historization","breadcrumb":"Reference › User Interface › Wizards › Create historization","description":"","searchText":"reference user interface wizards create historization overview the create historization wizard creates a historization package item for a selected source table or transformation. function choose the source table, target schema, target table name, package, slowly changing dimension behavior, empty-record handling, and primary-key option, then finish the wizard. access open the wizard from the listed navigation, toolbar, or diagram context. how to access navigation tree packages -> historization -> add historization package. toolbar etl -> packages, open a historization package, then add historization content. diagram table or transformation object -> add -> historization. visual element historization wizard screen overview id property description 1 source table table or transformation used as the historization source. 2 target schema schema for the historized target table. 3 target table name name of the historized target table. 4 package historization package that will contain the item. 5 scd type slowly changing dimension behavior. 6 empty record behaviour handling for empty records. 7 use vault id as pk uses the vault identifier as the primary key where supported. 8 scd 0 keeps values unchanged after initial load. 9 scd 1 overwrites values with the latest state. 10 scd 2 tracks historical value changes. 11 close closes historical rows according to the selected behavior. 12 do not close leaves historical rows open according to the selected behavior. 13 finish completes the wizard and creates or updates the selected object. 14 cancel leaves the page without continuing the current edit. related topics historization page package page etl toolbar historizations list page previous create export nextcreate import"}
,{"id":386707109066,"name":"Create import","type":"topic","path":"/docs/reference/user-interface/wizards/wizards-create-import","breadcrumb":"Reference › User Interface › Wizards › Create import","description":"","searchText":"reference user interface wizards create import overview the create import wizard creates an import package item from a source object into a target table. function choose the source, target schema, target table name, and package, then finish the wizard to create the import definition. access open the wizard from the listed navigation, toolbar, or diagram context. how to access navigation tree packages -> import -> add import package. toolbar etl -> packages, open an import package, then add import content. diagram source object -> add -> import. visual element import wizard screen overview id property description 1 source source object used for the import. 2 target schema schema for the imported target table. 3 target table name name of the imported target table. 4 package import package that will contain the import item. 5 finish completes the wizard and creates or updates the selected object. 6 cancel leaves the page without continuing the current edit. related topics import page source page package page etl toolbar previous create historization nextcreate snapshot dimension"}
,{"id":386707109067,"name":"Create snapshot dimension","type":"topic","path":"/docs/reference/user-interface/wizards/wizards-create-snapshot-dimension","breadcrumb":"Reference › User Interface › Wizards › Create snapshot dimension","description":"","searchText":"reference user interface wizards create snapshot dimension overview the create snapshot dimension wizard creates a snapshot dimension transformation and assigns it to selected stars. function choose the schema, name, star selection, and transformation setting, then finish the wizard to create the snapshot dimension. access open the wizard from the listed navigation, toolbar, or diagram context. how to access navigation tree not direct from the navigation tree. toolbar etl -> snapshot dimension. diagram diagram -> add -> snapshot dimension. visual element create snapshot dimension wizard screen overview id property description 1 schema schema for the snapshot dimension. 2 name name of the snapshot dimension. 3 stars stars that should use the snapshot dimension. 4 transformation transformation connected to the snapshot dimension. 5 >> adds the selected item to the active selection. 6 << removes the selected item from the active selection. 7 finish completes the wizard and creates or updates the selected object. 8 cancel leaves the page without continuing the current edit. related topics snapshot page snapshot group page etl toolbar transformation page previous create import nextcreate source"}
,{"id":386707109068,"name":"Create source","type":"topic","path":"/docs/reference/user-interface/wizards/wizards-create-source","breadcrumb":"Reference › User Interface › Wizards › Create source","description":"","searchText":"reference user interface wizards create source overview the create source wizard reads metadata from a connector and creates source objects, queries, relations, and connector-specific settings. function choose a connector, select tables or query settings, apply filters, retrieve relations, configure sap or csv options where needed, test the query, and finish the wizard to create source definitions. access open the wizard from the listed navigation, toolbar, or diagram context. how to access navigation tree connectors -> [connector] -> sources -> read source from connector. toolbar not direct. start from a connector context. diagram not opened directly from the diagram. visual element source wizard screen overview id property description 1 connector connector used to read source metadata. 2 table source table selection. 3 query source query setup. 4 filter schema schema filter for table discovery. 5 filter table table-name filter for discovery. 6 retrieve relations reads relationships from the source system where supported. 7 sap description language language used for sap descriptions. 8 tables table selection grid. 9 deltaq sap deltaq extraction settings. 10 odp sap odp extraction settings. 11 apply applies the current filter or selection. 12 exist shows whether the source already exists. 13 type source type. 14 schema source schema. 15 table name source table name. 16 query schema schema used for a query source. 17 query name name used for a query source. 18 mode extraction mode. 19 auto sync. automatic synchronization option. 20 log.destination logging destination for sap scenarios. 21 rfc destination rfc destination for sap scenarios. 22 transfer mode idoc uses idoc transfer mode. 23 transfer mode trfc uses trfc transfer mode. 24 column names first row uses the first row as csv column names. 25 code page code page used to read csv files. 26 text qualifier text qualifier used by the csv parser. 27 column delimiter delimiter used to split csv columns. 28 test query tests the query before finishing. 29 back returns to the previous wizard step. 30 next moves to the next wizard step after the current selections are valid. 31 finish completes the wizard and creates or updates the selected object. 32 cancel leaves the page without continuing the current edit. related topics source page sources list page connector page source wizard previous create snapshot dimension nextcreate time dimension"}
,{"id":386707109069,"name":"Create time dimension","type":"topic","path":"/docs/reference/user-interface/wizards/wizards-create-time-dimension","breadcrumb":"Reference › User Interface › Wizards › Create time dimension","description":"","searchText":"reference user interface wizards create time dimension overview the create time dimension wizard creates a time transformation using a configured time interval and star selection. function choose schema, name, period length, time-to-id function, and stars, then finish the wizard to create the time dimension transformation. access open the wizard from the listed navigation, toolbar, or diagram context. how to access navigation tree not direct from the navigation tree. toolbar etl -> time dimension. diagram diagram -> add -> time dimension. visual element create time dimension wizard screen overview id property description 1 schema schema for the time transformation. 2 name name of the time transformation. 3 period (minutes) minute interval used to generate time rows. 4 time-to-id function function used to convert time values into identifiers. 5 stars stars that should use the time transformation. 6 >> adds the selected item to the active selection. 7 << removes the selected item from the active selection. 8 finish completes the wizard and creates or updates the selected object. 9 cancel leaves the page without continuing the current edit. related topics etl toolbar create calendar dimension wizard transformation page create snapshot dimension wizard previous create source nextcreate transformation"}
,{"id":386707109070,"name":"Create transformation","type":"topic","path":"/docs/reference/user-interface/wizards/wizards-create-transformation","breadcrumb":"Reference › User Interface › Wizards › Create transformation","description":"","searchText":"reference user interface wizards create transformation overview the create transformation wizard creates a transformation by combining a type, schema, source tables, fields, stars, default transformations, and optional script logic. function use the main step for the transformation type, schema, name, historization, main table, unknown-member, and persisting settings. then choose tables, field-name behavior, calendar options, stars, defaults, and script or dependent-table options before finishing. access open the wizard from the listed navigation, toolbar, or diagram context. how to access navigation tree model -> layers -> [layer] -> [schema] -> transformations -> add transformation. toolbar etl -> new transformation. diagram diagram -> add -> transformation. visual element transformation wizard screen overview id property description 1 main main transformation setup step. 2 type transformation type. 3 schema schema for the transformation. 4 name name of the transformation. 5 historizing type historization behavior for the transformation. 6 main table main table used by the transformation. 7 create unknown member creates an unknown member where supported. 8 persist transformation creates persisting output for the transformation. 9 persist table persisted table name. 10 persist package persisting package name. 11 tables table selection step. 12 all direct related adds directly related tables. 13 all related adds all related tables. 14 use business key references if possible prefers business-key references when available. 15 use hash key references if possible prefers hash-key references when available. 16 fields field selection step. 17 field names field-name generation setting. 18 key field names key field naming setting. 19 use friendly names as column names uses business-friendly names for generated columns. 20 use calendar in facts adds calendar handling to fact transformations. 21 stars star selection step. 22 default transformations default transformation selection step. 23 script script setup step. 24 script type script category used by the wizard. 25 add dependent tables adds dependent tables to the transformation. 26 is output table marks a table as output. 27 add adds the selected item. 28 delete deletes the selected item. 29 delete all deletes all items from the current selection. 30 back returns to the previous wizard step. 31 next moves to the next wizard step after the current selections are valid. 32 finish completes the wizard and creates or updates the selected object. 33 cancel leaves the page without continuing the current edit. related topics transformation page transformations list page etl toolbar persist transformation wizard previous create time dimension nextdwh wizard"}
,{"id":386707109071,"name":"DWH Wizard","type":"topic","path":"/docs/reference/user-interface/wizards/wizards-dwh-wizard","breadcrumb":"Reference › User Interface › Wizards › DWH Wizard","description":"","searchText":"reference user interface wizards dwh wizard overview dwh wizard is the guided warehouse setup flow for turning source metadata into analyticscreator warehouse objects. it helps users choose the modeling approach, select source tables, classify generated objects, and set naming and generation options before creating the warehouse structure. function use the dwh wizard to read metadata from a connector or existing source definitions, filter the metadata scope, move selected objects into the generation list, and decide whether each object is imported, transformed, historized, or used as a dimension or fact. the wizard also stores the naming patterns, schema choices, relationship options, default transformations, and star assignments used during generation. access the wizard can be opened from the file ribbon tab, from several navigation-tree context menus, or from the diagram canvas context menu. opening it from a selected connector preselects that connector in the wizard. how to access navigation tree use the root, sources, data warehouse, or a selected connector context menu, then choose dwh wizard. toolbar use file -> dwh wizard. diagram right-click the diagram canvas and choose dwh wizard. visual element dwh wizard window with dwh, patterns, and options tabs. screen overview id property description a metadata source and filtering selects the connector, modeling type, metadata source, schema filter, table filters, and apply action used to load the source-object list. b source object selection shows retrieved source objects. select rows here and move them into the generation list. c object configuration and classification shows selected objects and lets users classify how each object should be generated. id property description 1 exist in dwh read-only indicator showing whether the source object is already represented in the warehouse model. 2 type source object type, such as table, view, deltaq, or odp. 3 schema source schema returned by the connector or stored source metadata. 4 table name source table or view name that can be selected for generation. 5 description source-object description returned with the metadata. id property description 1 exist in dwh read-only indicator showing whether the selected object already exists in the warehouse model. 2 connector connector associated with the selected source object. 3 type source object type. 4 schema source schema for the selected object. 5 table name source table or view name. 6 import creates an import object for the selected source object. 7 trans creates a transformation after the import step. 8 hist creates historized storage for tracking changes over time. 9 dimension classifies the generated output as a dimension. 10 fact classifies the generated output as a fact. id property description 1 tables per package maximum number of tables grouped into one generated load package. 2 import package names naming pattern for generated import packages. 3 historizing package names naming pattern for generated packages that load historized objects. 4 table names naming pattern for generated warehouse tables. 5 transformation names naming pattern for generated transformations. 6 dimension names naming pattern for generated dimensions. 7 fact names naming pattern for generated facts. 8 hub package name naming pattern for generated hub packages in data vault workflows. 9 sat package name naming pattern for generated satellite packages in data vault workflows. 10 link package name naming pattern for generated link packages in data vault workflows. 11 hub transformation name naming pattern for generated hub transformations. 12 sat transformation name naming pattern for generated satellite transformations. 13 link transformation name naming pattern for generated link transformations. 14 hub table name naming pattern for generated hub tables. 15 sat table name naming pattern for generated satellite tables. 16 link table name naming pattern for generated link tables. 17 linksat table name naming pattern for generated link-satellite tables. 18 key field name naming pattern for generated relationship key fields. 19 calendar in facts name naming pattern for generated calendar references in fact transformations. id property description 1 field names appearance keeps field names unchanged or converts generated names to upper case or lower case. 2 retrieve relations reads available source relationships and uses them during generated model setup. 3 create snapshot dimension creates a snapshot dimension when the project does not already contain one. 4 create calendar dimension creates a calendar dimension when enabled. 5 calendar dimension name name used for the generated calendar dimension. 6 calendar period start and end dates used for generated calendar records. 7 include tables in facts controls whether fact transformations include directly related, indirectly related, or all related tables. 8 sap deltaq transfer mode selects idoc or trfc transfer handling for sap deltaq sources. 9 sap description language language code used when retrieving sap descriptions. 10 use friendly names in transformations as column names uses available friendly names as generated transformation column names. 11 default transformations chooses whether no predefined transformations, all predefined transformations, or selected predefined transformations are applied. 12 default transformations list moves selected predefined transformations into or out of the generated transformation set. 13 stars assigns generated dimensions and facts to selected stars. 14 schemas for the generated objects sets target schemas for import tables, import transformations, historized tables, and facts and dimensions. 15 column names first row for file-based metadata, marks the first row as the source column-name row. 16 code page text encoding used when reading file-based metadata. 17 text qualifier character used to wrap text values in file-based metadata. 18 column delimiter delimiter used between columns in file-based metadata. related topics create source create transformation create historization create calendar dimension previous create transformation nexthash keys"}
,{"id":386707109072,"name":"Hash keys","type":"topic","path":"/docs/reference/user-interface/wizards/wizards-hash-keys","breadcrumb":"Reference › User Interface › Wizards › Hash keys","description":"","searchText":"reference user interface wizards hash keys overview the hash keys wizard adds or refreshes primary and referenced hash keys and can update transformations to use hash references. function choose whether to add or refresh primary hash keys, referenced hash keys, and transformation references, then finish the wizard. access open the wizard from the listed navigation, toolbar, or diagram context. how to access navigation tree not direct from the navigation tree. toolbar not direct. start from the diagram hash-key command. diagram diagram -> add/refresh hash keys. visual element hash keys wizard screen overview id property description 1 add or refresh hash keys in all tables runs hash-key maintenance across all tables. 2 add or refresh primary hash keys adds or refreshes primary hash keys. 3 add or refresh referenced hash keys adds or refreshes referenced hash keys. 4 replace references in transformations with hash references updates transformations to use hash references. 5 finish completes the wizard and creates or updates the selected object. 6 cancel leaves the page without continuing the current edit. related topics table page transformation page dataflow diagram create datavault object wizard previous dwh wizard nextpersist transformation"}
,{"id":386707109073,"name":"Persist transformation","type":"topic","path":"/docs/reference/user-interface/wizards/wizards-persist-transformation","breadcrumb":"Reference › User Interface › Wizards › Persist transformation","description":"","searchText":"reference user interface wizards persist transformation overview the persist transformation wizard creates persisting output for a transformation. function choose the transformation, persisted table, persisting package, and table-switching strategy, then finish the wizard to create the persisting definition. access open the wizard from the listed navigation, toolbar, or diagram context. how to access navigation tree packages -> persisting -> add persisting package. toolbar etl -> packages, open a persisting package, then add persisting content. diagram transformation object -> add -> persisting. visual element persisting wizard screen overview id property description 1 transformation transformation to persist. 2 persist table persisted table created by the wizard. 3 persist package persisting package that will contain the item. 4 no partition switching creates persisting without partition switching. 5 partition switching uses partition switching for persisting where supported. 6 renaming uses renaming strategy for persisting where supported. 7 finish completes the wizard and creates or updates the selected object. 8 cancel leaves the page without continuing the current edit. related topics persisting page transformation page package page etl toolbar previous hash keys nextrun object script"}
,{"id":386707109074,"name":"Run object script","type":"topic","path":"/docs/reference/user-interface/wizards/wizards-run-object-script","breadcrumb":"Reference › User Interface › Wizards › Run object script","description":"","searchText":"reference user interface wizards run object script overview the run object script wizard runs a selected object script with object context, timeout, and parameter values. function review the selected object, timeout, and parameter rows, enter required values, and run the script from the wizard. access open the wizard from the listed navigation, toolbar, or diagram context. how to access navigation tree any object -> run script -> [script], or object scripts -> table-independent scripts -> run object script. toolbar not direct. start from an object script context. diagram object context menu -> run script. visual element run object script wizard screen overview id property description 1 run object script wizard for executing an object script. 2 object object context used by the script. 3 object id selected object reference shown by the wizard. 4 timeout (sec) maximum run time in seconds. 5 paramnr parameter order. 6 parameter parameter name. 7 value value supplied for the parameter. 8 run script runs the script with the current parameter values. 9 cancel leaves the page without continuing the current edit. related topics object script page object scripts list page sql script page etl toolbar previous persist transformation nextentity types"}
,{"id":383461259455,"name":"Entity types","type":"section","path":"/docs/reference/entity-types","breadcrumb":"Reference › Entity types","description":"","searchText":"reference entity types entity types define the structural categories used by analyticscreator to classify connectors, sources, tables, transformations, packages, scripts, schemas, and historization behavior. use this section when you need to understand which type controls a modeling object, execution unit, or generated warehouse structure. entity type groups connector types define how analyticscreator connects to source systems and external data providers. database connectors file and cloud storage connectors service and enterprise system connectors open connector types source types define how source objects are read and how source data enters the loading process. table and view sources query-based sources sap source patterns open source types table types define the role a table plays in staging, historization, persistence, dimensional modeling, or data vault modeling. import and historized tables dimension and fact tables data vault hubs, links, and satellites open table types transformation types define how transformation logic is generated, maintained, or executed. generated transformations manual and script-based logic datamart and union transformations open transformation types join historization types define how joins behave when historized data and validity periods are involved. current-state joins full historical joins valid-from and valid-to alignment open join historization types package types define the execution units used for loading, historization, persisting, workflows, scripts, exports, and external processing. import and workflow packages historization and persisting packages script, export, and external packages open package types sql script types define when custom sql logic runs during creation, workflow execution, deployment, or repository extension. pre and post creation pre and post workflow pre and post deployment open sql script types schema types define the warehouse layers used to organize staging, transformation, core, and reporting-ready structures. staging and persisted staging transformation and core layers datamart layer open schema types transformation historization types transformation historization types define how a transformation handles time-dependent data and historical states. open transformation historization types how to use this section use connector types and source types when working with source system integration use table types, schema types, and transformation types when designing warehouse structures use join historization types when historized data must be joined with validity-aware behavior use package types and sql script types when reviewing execution and lifecycle behavior key takeaway entity types provide the classification model behind analyticscreator objects and execution behavior, helping you understand how each object is created, organized, processed, and used in the generated data warehouse. previous run object script nextconnector types"}
,{"id":383509396685,"name":"Connector types","type":"subsection","path":"/docs/reference/entity-types/connector-types","breadcrumb":"Reference › Entity types › Connector types","description":"","searchText":"reference entity types connector types connector types define how analyticscreator connects to source systems and external data providers. they determine how metadata is accessed and how source data can be integrated into the generated data warehouse flow. use this section to understand the available connector types and choose the appropriate connector for your source technology and integration scenario. available connector types mssql connector for microsoft sql server sources and metadata import. relational source access table and metadata import common warehouse source type open mssql oracle connector for oracle-based source systems. relational source integration metadata-driven access suitable for oracle source landscapes open oracle excel connector for excel-based source files. file-based source access structured spreadsheet input useful for departmental data sources open excel csv connector for delimited text file sources. flat file ingestion simple structured source format suitable for exchange files open csv access connector for microsoft access source files and databases. legacy source support file-based database access useful for smaller existing data stores open access oledb generic connector based on ole db provider access. flexible connectivity option useful for supported provider-based sources suitable for heterogeneous environments open oledb sap connector for sap metadata and source integration scenarios. sap metadata import relevant for erp integration supports sap-oriented modeling flows open sap odbc generic connector based on odbc driver access. broad compatibility useful for many relational systems driver-based connection model open odbc direct connector type for direct source access scenarios. direct integration pattern reduced abstraction layer useful for specific source access cases open direct oledb.net connector based on ole db .net provider access. .net-based provider model useful for provider-specific integrations extends connectivity options open oledb.net azure blob connector for file-based and object-based sources in azure blob storage. cloud storage integration useful for landing and exchange zones supports azure-based source scenarios open azure blob odata connector for odata-based service endpoints and api-style data access. service-oriented integration useful for api-style sources supports metadata-driven remote access open odata how to choose a connector type use mssql or oracle for direct relational database integration use excel, csv, or access for file-based and desktop data sources use sap for sap-oriented metadata and source integration use odbc, oledb, or oledb.net for generic provider-based connectivity use azure blob for cloud storage-based source scenarios use odata for service-based or api-style access use direct when a direct connector pattern is required for the source integration scenario key takeaway connector types define how analyticscreator accesses metadata and source data across relational databases, files, enterprise systems, cloud storage, and service-based interfaces. previous entity types nextmssql"}
,{"id":386708347109,"name":"MSSQL","type":"topic","path":"/docs/reference/entity-types/connector-types/connector-types-mssql","breadcrumb":"Reference › Entity types › Connector types › MSSQL","description":"","searchText":"reference entity types connector types mssql overview mssql is the connector type for microsoft sql server data sources. in the repository seed data it is stored as mssql with connectortypeid = 1, the description microsoft sql server, ole db behavior enabled, and the azure source type sqlserver. function use the mssql connector type when a connector should read from a sql server database through an ole db connection string. when mssql is selected in the connector detail page, analyticscreator shows the standard connection-string editor, the template action, and the test connection action. the template inserts a sql server ole db connection string with server and database placeholders. the provider in the template is resolved from the configured or installed sql server ole db provider. the default parameter is msoledbsql, and the application can also use sqlncli11 or sqlncli10 when those providers are available. access mssql connector type configuration is opened through the common connector editor. the connector type itself is selected in the connector type field. how to access navigation tree data warehouse -> connectors -> add connector, or data warehouse -> connectors -> connector -> edit connector toolbar sources -> new connector -> add, or sources -> list -> connectors diagram not direct. edit an mssql connector from the connectors list or connector node. visual element connector detail page, connectors list, and connectors navigation-tree node. screen overview the connector detail page contains the following visible fields and actions when the mssql connector type is selected. id property description 1 you can use the #encrypted_string# alias instead of plain-text passwords. you can add an encrypted string using options->encrypted strings help text shown at the top of the connector page. the connection-string context menu can insert an encrypted-string alias. 2 connector name connector name. saving requires a non-empty value. 3 connector type select mssql. 4 azure source type stores the azure source type associated with the connector. the seeded mssql connector type uses sqlserver. 5 do not store connection string in cfg.ssis__configurations controls whether the connector connection string is excluded from ssis configuration storage. 6 connection string ole db connection string for the sql server database. 7 template inserts provider={provider};data source=[server];initial catalog=[database];integrated security=sspi;, where {provider} is the configured sql server ole db provider. 8 test connection decrypts encrypted-string aliases if used, opens the connection through ole db, and shows a success message when the connection opens. 9 save saves the connector, detects the sql server quoted identifier from the ole db provider when a connection string is present, refreshes the navigation tree, and reloads the saved connector page. 10 cancel returns to the previous page. if there are unsaved changes, analyticscreator asks whether to save or cancel the navigation. list behavior the connectors list filters by connector name, connector type id, connection string, locale, code page, or format. the list grid shows connectorname, connectortype, and connectionstring. double-clicking a connector opens it in the connector detail page. new opens a new connector detail page. delete removes the selected connector after confirmation. connector actions the connectors branch provides refresh, list connectors, add connector, import connector from file, and import connector from cloud. a selected connector provides set diagram filter, add to diagram filter, edit connector, delete connector, dwh wizard, refresh used sources, refresh all sources, export connector to file, and export connector to cloud. the mssql connector type is displayed with the sql database connector icon when connector nodes are rendered. related topics connector types connector connectors list connector page previous connector types nextoracle"}
,{"id":386708347114,"name":"Oracle","type":"topic","path":"/docs/reference/entity-types/connector-types/connector-types-oracle","breadcrumb":"Reference › Entity types › Connector types › Oracle","description":"","searchText":"reference entity types connector types oracle overview oracle is the connector type for oracle database sources. in the repository seed data it is stored as oracle with connectortypeid = 2, the description oracle, ole db behavior enabled, and the azure source type oracle. function use the oracle connector type when a connector should read from an oracle database through an oracle ole db connection string. when oracle is selected in the connector detail page, analyticscreator shows the standard connection-string editor, the template action, and the test connection action. the template inserts an oracle ole db connection string with host, port, service name, user, and password placeholders. saving an oracle connector requires a connector name and connector type. if a connection string is present, analyticscreator uses ole db provider metadata to detect the quoted identifier, saves the connector, and refreshes the navigation tree. access oracle connector type configuration is opened through the common connector editor. the connector type itself is selected in the connector type field. how to access navigation tree data warehouse -> connectors -> add connector, or data warehouse -> connectors -> connector -> edit connector toolbar sources -> new connector -> add, or sources -> list -> connectors diagram not direct. edit an oracle connector from the connectors list or connector node. visual element connector detail page, connectors list, and connectors navigation-tree node. screen overview the connector detail page contains the following visible fields and actions when the oracle connector type is selected. id property description 1 you can use the #encrypted_string# alias instead of plain-text passwords. you can add an encrypted string using options->encrypted strings help text shown at the top of the connector page. the connection-string context menu can insert an encrypted-string alias. 2 connector name connector name. saving requires a non-empty value. 3 connector type select oracle. 4 azure source type stores the azure source type associated with the connector. the seeded oracle connector type uses oracle. 5 do not store connection string in cfg.ssis__configurations controls whether the connector connection string is excluded from ssis configuration storage. 6 connection string ole db connection string for the oracle database. 7 template inserts provider=oraoledb.oracle;data source=(description =(address =(protocol=tcp)(host=[host])(port=[port]))(connectdata=(server=dedicated)(servicename=[servicename])));user id=[user];password=[password];. 8 test connection decrypts encrypted-string aliases if used, opens the connection through ole db, and shows a success message when the connection opens. 9 save saves the connector, detects the quoted identifier from the ole db provider when a connection string is present, refreshes the navigation tree, and reloads the saved connector page. 10 cancel returns to the previous page. if there are unsaved changes, analyticscreator asks whether to save or cancel the navigation. list behavior the connectors list filters by connector name, connector type id, connection string, locale, code page, or format. the list grid shows connectorname, connectortype, and connectionstring. double-clicking a connector opens it in the connector detail page. new opens a new connector detail page. delete removes the selected connector after confirmation. connector actions the connectors branch provides refresh, list connectors, add connector, import connector from file, and import connector from cloud. a selected connector provides set diagram filter, add to diagram filter, edit connector, delete connector, dwh wizard, refresh used sources, refresh all sources, export connector to file, and export connector to cloud. the oracle connector type is displayed with the oracle connector icon when connector nodes are rendered. related topics connector types connector connectors list connector page previous mssql nextexcel"}
,{"id":386708347108,"name":"Excel","type":"topic","path":"/docs/reference/entity-types/connector-types/connector-types-excel","breadcrumb":"Reference › Entity types › Connector types › Excel","description":"","searchText":"reference entity types connector types excel overview excel is the connector type for microsoft excel files. in the repository seed data it is stored as excel with connectortypeid = 4, the description excel file, ole db behavior enabled, and the azure source type fileserver. function use the excel connector type when a connector should read from an excel workbook through an ole db connection string. when excel is selected in the connector detail page, analyticscreator shows the standard connection-string editor, the template action, and the test connection action. the template inserts a microsoft ace ole db connection string with an excel file path placeholder and excel-specific extended properties. saving an excel connector requires a connector name and connector type. if a connection string is present, analyticscreator stores the excel quoted identifier as a backtick, saves the connector, and refreshes the navigation tree. access excel connector type configuration is opened through the common connector editor. the connector type itself is selected in the connector type field. how to access navigation tree data warehouse -> connectors -> add connector, or data warehouse -> connectors -> connector -> edit connector toolbar sources -> new connector -> add, or sources -> list -> connectors diagram not direct. edit an excel connector from the connectors list or connector node. visual element connector detail page, connectors list, and connectors navigation-tree node. screen overview the connector detail page contains the following visible fields and actions when the excel connector type is selected. id property description 1 you can use the #encrypted_string# alias instead of plain-text passwords. you can add an encrypted string using options->encrypted strings help text shown at the top of the connector page. the connection-string context menu can insert an encrypted-string alias. 2 connector name connector name. saving requires a non-empty value. 3 connector type select excel. 4 azure source type stores the azure source type associated with the connector. the seeded excel connector type uses fileserver. 5 do not store connection string in cfg.ssis__configurations controls whether the connector connection string is excluded from ssis configuration storage. 6 connection string ole db connection string for the excel workbook. 7 template inserts provider=microsoft.ace.oledb.12.0;data source=[fullpath_to_file];extended properties=\"excel 12.0 xml;hdr=yes;imex=1\";. 8 test connection decrypts encrypted-string aliases if used, opens the connection through ole db, and shows a success message when the connection opens. 9 save saves the connector, stores the excel quoted identifier as a backtick when a connection string is present, refreshes the navigation tree, and reloads the saved connector page. 10 cancel returns to the previous page. if there are unsaved changes, analyticscreator asks whether to save or cancel the navigation. list behavior the connectors list filters by connector name, connector type id, connection string, locale, code page, or format. the list grid shows connectorname, connectortype, and connectionstring. double-clicking a connector opens it in the connector detail page. new opens a new connector detail page. delete removes the selected connector after confirmation. connector actions the connectors branch provides refresh, list connectors, add connector, import connector from file, and import connector from cloud. a selected connector provides set diagram filter, add to diagram filter, edit connector, delete connector, dwh wizard, refresh used sources, refresh all sources, export connector to file, and export connector to cloud. the excel connector type is displayed with the excel connector icon when connector nodes are rendered. related topics connector types connector connectors list connector page previous oracle nextcsv"}
,{"id":386708347106,"name":"CSV","type":"topic","path":"/docs/reference/entity-types/connector-types/connector-types-csv","breadcrumb":"Reference › Entity types › Connector types › CSV","description":"","searchText":"reference entity types connector types csv overview csv is the connector type for delimited text files. in the repository seed data it is stored as csv with connectortypeid = 3, the description csv file, ole db behavior disabled, and the azure source type fileserver. function use the csv connector type when a connector should read delimited text files and store the parsing settings on the connector record. when csv is selected in the connector detail page, analyticscreator hides the generic connection-string editor, the template action, and the test connection action. it shows the csv-specific fields for header handling, encoding, locale, format, and delimiters instead. saving a csv connector requires a connector name and connector type. analyticscreator leaves the generic connection string empty, saves the csv parsing options, saves the selected azure source type, and refreshes the navigation tree. access csv connector type configuration is opened through the common connector editor. the connector type itself is selected in the connector type field. how to access navigation tree data warehouse -> connectors -> add connector, or data warehouse -> connectors -> connector -> edit connector toolbar sources -> new connector -> add, or sources -> list -> connectors diagram not direct. edit a csv connector from the connectors list or connector node. visual element connector detail page, connectors list, and connectors navigation-tree node. screen overview the connector detail page contains the following visible fields and actions when the csv connector type is selected. id property description 1 you can use the #encrypted_string# alias instead of plain-text passwords. you can add an encrypted string using options->encrypted strings help text shown at the top of the connector page. for csv, the generic connection-string editor is hidden after this connector type is selected. 2 connector name connector name. saving requires a non-empty value. 3 connector type select csv. 4 azure source type stores the azure source type associated with the connector. the seeded csv connector type uses fileserver. 5 do not store connection string in cfg.ssis__configurations stores the connector's ssis-configuration flag. the csv connector keeps parsing settings in csv-specific fields rather than in the generic connection-string box. 6 column names first row indicates whether the first row contains column names. the new csv default is selected. 7 unicode indicates whether the file uses unicode encoding. the new csv default is cleared. 8 locale locale used for parsing. the new csv default is english. 9 code page code page used for parsing. if no code page item is selected, analyticscreator saves 1252. 10 format csv format value. the new csv default is 0. 11 text qualifier character used to qualify text values. the new csv default is empty. 12 header row delimiter (use {cr}, {lf} and {t}) delimiter used between header rows. the new csv default is {cr}{lf}. 13 header rows to skip number of header rows skipped before reading data. the new csv default is 0. 14 row delimiter (use {cr}, {lf} and {t}) delimiter used between data rows. the new csv default is {cr}{lf}. 15 column delimiter (use {cr}, {lf} and {t}) delimiter used between columns. the new csv default is ;. 16 save saves the connector, refreshes the navigation tree, and reloads the saved connector page. 17 cancel returns to the previous page. if there are unsaved changes, analyticscreator asks whether to save or cancel the navigation. list behavior the connectors list filters by connector name, connector type id, connection string, locale, code page, or format. the list grid shows connectorname, connectortype, and connectionstring. double-clicking a connector opens it in the connector detail page. new opens a new connector detail page. delete removes the selected connector after confirmation. connector actions the connectors branch provides refresh, list connectors, add connector, import connector from file, and import connector from cloud. a selected connector provides set diagram filter, add to diagram filter, edit connector, delete connector, dwh wizard, refresh used sources, refresh all sources, export connector to file, and export connector to cloud. when source reading is started from a csv connector, analyticscreator opens the source definition page directly. previewing a csv source opens the source path instead of the generic preview dialog. the csv connector type is displayed with the text-file connector icon when connector nodes are rendered. related topics connector types connector connectors list connector page previous excel nextaccess"}
,{"id":386708347104,"name":"Access","type":"topic","path":"/docs/reference/entity-types/connector-types/connector-types-access","breadcrumb":"Reference › Entity types › Connector types › Access","description":"","searchText":"reference entity types connector types access overview access is the connector type for microsoft access database files in analyticscreator. function use this connector type when a source system is delivered as an access database file. the connector editor stores the connector name, selected connector type, connection string, and optional connection-string template so analyticscreator can read metadata and data from the access database. access access is selected in the connector editor from the connector type dropdown. after it is selected, the editor uses the standard connection-string area and provides a template for a microsoft access file connection. how to access navigation tree use connectors -> add connector. for an existing connector, use connectors -> connector name -> edit connector. toolbar use sources -> new connector -> add. to edit, use sources -> list -> connectors and open the connector. diagram not opened directly from the diagram. access connectors can be used later by source and warehouse workflows. visual element new connector or edit connector page with the connector form. screen overview the access connector type is configured in the connector editor after selecting access in the connector-type dropdown. id property description 1 connector name enter a business name for the access connector. 2 connector type select access for a microsoft access database file. 3 connection string stores the connection details for the access database file. 4 template inserts the standard access connection-string pattern so the file path can be filled in. 5 test connection checks whether analyticscreator can open the configured access connection. 6 save saves the connector configuration. 7 cancel leaves the editor without saving the current changes. related topics azure blob csv direct excel previous csv nextoledb"}
,{"id":386708347112,"name":"OLEDB","type":"topic","path":"/docs/reference/entity-types/connector-types/connector-types-oledb","breadcrumb":"Reference › Entity types › Connector types › OLEDB","description":"","searchText":"reference entity types connector types oledb overview oledb is the connector type for generic ole db data sources. in the repository seed data it is stored as oledb with connectortypeid = 6, the description oledb driver, ole db behavior enabled, and the azure source type odbc. function use the oledb connector type when a connector should read from a data source through a manually entered ole db connection string. when oledb is selected in the connector detail page, analyticscreator shows the standard connection-string editor, the template action, and the test connection action. this connector type does not provide a predefined oledb-specific template, so enter the complete connection string for the required ole db provider. saving an oledb connector requires a connector name and connector type. if a connection string is present, analyticscreator uses ole db provider metadata to detect the quoted identifier, saves the connector, and refreshes the navigation tree. access oledb connector type configuration is opened through the common connector editor. the connector type itself is selected in the connector type field. how to access navigation tree data warehouse -> connectors -> add connector, or data warehouse -> connectors -> connector -> edit connector toolbar sources -> new connector -> add, or sources -> list -> connectors diagram not direct. edit an oledb connector from the connectors list or connector node. visual element connector detail page, connectors list, and connectors navigation-tree node. screen overview the connector detail page contains the following visible fields and actions when the oledb connector type is selected. id property description 1 you can use the #encrypted_string# alias instead of plain-text passwords. you can add an encrypted string using options->encrypted strings help text shown at the top of the connector page. the connection-string context menu can insert an encrypted-string alias. 2 connector name connector name. saving requires a non-empty value. 3 connector type select oledb. 4 azure source type stores the azure source type associated with the connector. the seeded oledb connector type uses odbc. 5 do not store connection string in cfg.ssis__configurations controls whether the connector connection string is excluded from ssis configuration storage. 6 connection string ole db connection string for the selected provider and data source. 7 template the action is available in the connector editor, but the oledb connector type does not insert a predefined template. 8 test connection decrypts encrypted-string aliases if used, opens the connection through ole db, and shows a success message when the connection opens. 9 save saves the connector, detects the quoted identifier from the ole db provider when a connection string is present, refreshes the navigation tree, and reloads the saved connector page. 10 cancel returns to the previous page. if there are unsaved changes, analyticscreator asks whether to save or cancel the navigation. list behavior the connectors list filters by connector name, connector type id, connection string, locale, code page, or format. the list grid shows connectorname, connectortype, and connectionstring. double-clicking a connector opens it in the connector detail page. new opens a new connector detail page. delete removes the selected connector after confirmation. connector actions the connectors branch provides refresh, list connectors, add connector, import connector from file, and import connector from cloud. a selected connector provides set diagram filter, add to diagram filter, edit connector, delete connector, dwh wizard, refresh used sources, refresh all sources, export connector to file, and export connector to cloud. the oledb connector type is displayed with the generic database source connector icon when connector nodes are rendered. related topics connector types connector connectors list connector page previous access nextsap"}
,{"id":386708347115,"name":"SAP","type":"topic","path":"/docs/reference/entity-types/connector-types/connector-types-sap","breadcrumb":"Reference › Entity types › Connector types › SAP","description":"","searchText":"reference entity types connector types sap overview sap is the connector type for sap data sources reached through the sap connector integration. in the repository seed data it is stored as sap with connectortypeid = 7, the description sap using theobald connector, sap-specific behavior enabled, and the azure source type saptable. function use the sap connector type when a connector should read sap tables or sap-related source structures through a sap connection string. when sap is selected in the connector detail page, analyticscreator shows the standard connection-string editor, the template action, and the test connection action. selecting the connector type inserts the sap connection-string template, and the template action can insert it again if needed. testing a sap connector decrypts encrypted-string aliases, opens the sap connection, and closes it again after the connection check succeeds. saving a sap connector requires a connector name and connector type, stores the connection string, keeps the quoted identifier unset, saves the connector, and refreshes the navigation tree. access sap connector type configuration is opened through the common connector editor. the connector type itself is selected in the connector type field. how to access navigation tree data warehouse -> connectors -> add connector, or data warehouse -> connectors -> connector -> edit connector toolbar sources -> new connector -> add, or sources -> list -> connectors diagram not direct. edit a sap connector from the connectors list or connector node. visual element connector detail page, connectors list, and connectors navigation-tree node. screen overview the connector detail page contains the following visible fields and actions when the sap connector type is selected. id property description 1 you can use the #encrypted_string# alias instead of plain-text passwords. you can add an encrypted string using options->encrypted strings help text shown at the top of the connector page. the connection-string context menu can insert an encrypted-string alias. 2 connector name connector name. saving requires a non-empty value. 3 connector type select sap. 4 azure source type stores the azure source type associated with the connector. the seeded sap connector type uses saptable. 5 do not store connection string in cfg.ssis__configurations controls whether the connector connection string is excluded from ssis configuration storage. 6 connection string sap connection string used by the connector. the template format is ashost=[hostname] sysnr=[system_number] client=[mandant] lang=[language] user=[user] passwd=[password]. 7 template inserts the sap connection-string template into the connection string field. 8 test connection decrypts encrypted-string aliases if used, opens the sap connection, closes it, and shows a success message when the connection opens. 9 save saves the connector, stores the sap connection string, keeps the quoted identifier unset, refreshes the navigation tree, and reloads the saved connector page. 10 cancel returns to the previous page. if there are unsaved changes, analyticscreator asks whether to save or cancel the navigation. list behavior the connectors list filters by connector name, connector type id, connection string, locale, code page, or format. the list grid shows connectorname, connectortype, and connectionstring. double-clicking a connector opens it in the connector detail page. new opens a new connector detail page. delete removes the selected connector after confirmation. connector actions the connectors branch provides refresh, list connectors, add connector, import connector from file, and import connector from cloud. a selected connector provides set diagram filter, add to diagram filter, edit connector, delete connector, dwh wizard, refresh used sources, refresh all sources, export connector to file, and export connector to cloud. the sap connector type is displayed with the sap connector icon when connector nodes are rendered. related topics connector types connector connectors list connector page previous oledb nextodbc"}
,{"id":386708347111,"name":"ODBC","type":"topic","path":"/docs/reference/entity-types/connector-types/connector-types-odbc","breadcrumb":"Reference › Entity types › Connector types › ODBC","description":"","searchText":"reference entity types connector types odbc overview odbc is the connector type for data sources reached through an odbc connection string. in the repository seed data it is stored as odbc with connectortypeid = 8, the description odbc driver, ole db behavior disabled, and the azure source type odbc. function use the odbc connector type when a connector should read from a data source through an odbc data source name or odbc connection string. when odbc is selected in the connector detail page, analyticscreator shows the standard connection-string editor, the template action, and the test connection action. selecting the connector type inserts the odbc connection-string template, and the template action can insert it again if needed. saving an odbc connector requires a connector name and connector type. if a connection string is present, analyticscreator opens the odbc connection, reads the data-source information schema, uses the quoted-identifier pattern when it is available, saves the connector, and refreshes the navigation tree. access odbc connector type configuration is opened through the common connector editor. the connector type itself is selected in the connector type field. how to access navigation tree data warehouse -> connectors -> add connector, or data warehouse -> connectors -> connector -> edit connector toolbar sources -> new connector -> add, or sources -> list -> connectors diagram not direct. edit an odbc connector from the connectors list or connector node. visual element connector detail page, connectors list, and connectors navigation-tree node. screen overview the connector detail page contains the following visible fields and actions when the odbc connector type is selected. id property description 1 you can use the #encrypted_string# alias instead of plain-text passwords. you can add an encrypted string using options->encrypted strings help text shown at the top of the connector page. the connection-string context menu can insert an encrypted-string alias. 2 connector name connector name. saving requires a non-empty value. 3 connector type select odbc. 4 azure source type stores the azure source type associated with the connector. the seeded odbc connector type uses odbc. 5 do not store connection string in cfg.ssis__configurations controls whether the connector connection string is excluded from ssis configuration storage. 6 connection string odbc connection string used by the connector. the template format is dsn=[dsn];uid=[user];pwd=[password]. 7 template inserts the odbc connection-string template into the connection string field. 8 test connection decrypts encrypted-string aliases if used, opens the connection through odbc, closes it, and shows a success message when the connection opens. 9 save saves the connector, detects the quoted identifier from odbc data-source metadata when the schema exposes it, refreshes the navigation tree, and reloads the saved connector page. 10 cancel returns to the previous page. if there are unsaved changes, analyticscreator asks whether to save or cancel the navigation. list behavior the connectors list filters by connector name, connector type id, connection string, locale, code page, or format. the list grid shows connectorname, connectortype, and connectionstring. double-clicking a connector opens it in the connector detail page. new opens a new connector detail page. delete removes the selected connector after confirmation. connector actions the connectors branch provides refresh, list connectors, add connector, import connector from file, and import connector from cloud. a selected connector provides set diagram filter, add to diagram filter, edit connector, delete connector, dwh wizard, refresh used sources, refresh all sources, export connector to file, and export connector to cloud. the odbc connector type is displayed with the generic database source connector icon when connector nodes are rendered. related topics connector types connector connectors list connector page previous sap nextdirect"}
,{"id":386708347107,"name":"Direct","type":"topic","path":"/docs/reference/entity-types/connector-types/connector-types-direct","breadcrumb":"Reference › Entity types › Connector types › Direct","description":"","searchText":"reference entity types connector types direct overview direct is the connector type for direct database access. in the repository seed data it is stored as direct with connectortypeid = 9, the description direct access, ole db behavior disabled, and the azure source type azuresqldatabase. function use the direct connector type when a connector should reference an existing sql database directly through server and database metadata instead of a generic connection string. when direct is selected in the connector detail page, analyticscreator hides the generic connection-string editor and the template action. it shows the direct-specific fields server name, database name, server sqlcmd variable, and database sqlcmd variable. saving a direct connector requires a connector name, connector type, and database name. analyticscreator validates the sqlcmd variable fields, stores the server and database values on the connector record, leaves the generic connection string empty, saves the selected azure source type, and refreshes the navigation tree. access direct connector type configuration is opened through the common connector editor. the connector type itself is selected in the connector type field. how to access navigation tree data warehouse -> connectors -> add connector, or data warehouse -> connectors -> connector -> edit connector toolbar sources -> new connector -> add, or sources -> list -> connectors diagram not direct. edit a direct connector from the connectors list or connector node. visual element connector detail page, connectors list, and connectors navigation-tree node. screen overview the connector detail page contains the following visible fields and actions when the direct connector type is selected. id property description 1 you can use the #encrypted_string# alias instead of plain-text passwords. you can add an encrypted string using options->encrypted strings help text shown at the top of the connector page. for direct, the generic connection-string editor is hidden after this connector type is selected. 2 connector name connector name. saving requires a non-empty value. 3 connector type select direct. 4 azure source type stores the azure source type associated with the connector. the seeded direct connector type uses azuresqldatabase. 5 do not store connection string in cfg.ssis__configurations stores the connector's ssis-configuration flag. the direct connector keeps server and database settings in direct-specific fields rather than in the generic connection-string box. 6 server name optional sql server name. the connection test prefixes the database reference with this server when the value is present. 7 database name target database name. saving a direct connector requires this field. 8 server sqlcmd variable sqlcmd variable for the server name. analyticscreator validates the variable text before saving. 9 database sqlcmd variable sqlcmd variable for the database name. analyticscreator validates the variable text before saving. 10 test connection runs a simple query against the configured database reference, using the server name when present, and shows a success message when the query completes. 11 save saves the connector, refreshes the navigation tree, and reloads the saved connector page. 12 cancel returns to the previous page. if there are unsaved changes, analyticscreator asks whether to save or cancel the navigation. list behavior the connectors list filters by connector name, connector type id, connection string, locale, code page, or format. the list grid shows connectorname, connectortype, and connectionstring. double-clicking a connector opens it in the connector detail page. new opens a new connector detail page. delete removes the selected connector after confirmation. connector actions the connectors branch provides refresh, list connectors, add connector, import connector from file, and import connector from cloud. a selected connector provides set diagram filter, add to diagram filter, edit connector, delete connector, dwh wizard, refresh used sources, refresh all sources, export connector to file, and export connector to cloud. the direct connector type is displayed with the direct-link connector icon when connector nodes are rendered. related topics connector types connector connectors list connector page previous odbc nextoledb.net"}
,{"id":386708347113,"name":"OLEDB.NET","type":"topic","path":"/docs/reference/entity-types/connector-types/connector-types-oledb-net","breadcrumb":"Reference › Entity types › Connector types › OLEDB.NET","description":"","searchText":"reference entity types connector types oledb.net overview oledb.net is the connector type for ole db data sources handled through the .net connector path. in the repository seed data it is stored as oledb.net with connectortypeid = 10, the description oledb using .net, ole db behavior enabled, and the azure source type odbc. function use the oledb.net connector type when a connector should read from a data source through a manually entered ole db connection string in the .net connector category. when oledb.net is selected in the connector detail page, analyticscreator shows the standard connection-string editor, the template action, and the test connection action. this connector type does not provide a predefined oledb.net-specific template, so enter the complete connection string for the required ole db provider. saving an oledb.net connector requires a connector name and connector type. if a connection string is present, analyticscreator uses ole db provider metadata to detect the quoted identifier, defaults it to a double quote when no provider value is returned, saves the connector, and refreshes the navigation tree. access oledb.net connector type configuration is opened through the common connector editor. the connector type itself is selected in the connector type field. how to access navigation tree data warehouse -> connectors -> add connector, or data warehouse -> connectors -> connector -> edit connector toolbar sources -> new connector -> add, or sources -> list -> connectors diagram not direct. edit an oledb.net connector from the connectors list or connector node. visual element connector detail page, connectors list, and connectors navigation-tree node. screen overview the connector detail page contains the following visible fields and actions when the oledb.net connector type is selected. id property description 1 you can use the #encrypted_string# alias instead of plain-text passwords. you can add an encrypted string using options->encrypted strings help text shown at the top of the connector page. the connection-string context menu can insert an encrypted-string alias. 2 connector name connector name. saving requires a non-empty value. 3 connector type select oledb.net. 4 azure source type stores the azure source type associated with the connector. the seeded oledb.net connector type uses odbc. 5 do not store connection string in cfg.ssis__configurations controls whether the connector connection string is excluded from ssis configuration storage. 6 connection string ole db connection string for the selected provider and data source. 7 template the action is available in the connector editor, but the oledb.net connector type does not insert a predefined template. 8 test connection decrypts encrypted-string aliases if used, opens the connection through ole db, and shows a success message when the connection opens. 9 save saves the connector, detects the quoted identifier from the ole db provider when a connection string is present, refreshes the navigation tree, and reloads the saved connector page. 10 cancel returns to the previous page. if there are unsaved changes, analyticscreator asks whether to save or cancel the navigation. list behavior the connectors list filters by connector name, connector type id, connection string, locale, code page, or format. the list grid shows connectorname, connectortype, and connectionstring. double-clicking a connector opens it in the connector detail page. new opens a new connector detail page. delete removes the selected connector after confirmation. connector actions the connectors branch provides refresh, list connectors, add connector, import connector from file, and import connector from cloud. a selected connector provides set diagram filter, add to diagram filter, edit connector, delete connector, dwh wizard, refresh used sources, refresh all sources, export connector to file, and export connector to cloud. the oledb.net connector type is displayed with the generic database source connector icon when connector nodes are rendered. related topics connector types connector connectors list connector page previous direct nextazure blob"}
,{"id":386708347105,"name":"Azure BLOB","type":"topic","path":"/docs/reference/entity-types/connector-types/connector-types-azure-blob","breadcrumb":"Reference › Entity types › Connector types › Azure BLOB","description":"","searchText":"reference entity types connector types azure blob overview azure blob is the connector type for azure blob storage sources. in the repository seed data it is stored as azure blob with connectortypeid = 11, the description azure blob storage, ole db behavior disabled, and the azure source type azureblobstorage. function use the azure blob connector type when a connector should read source data from an azure blob storage account. when azure blob is selected in the connector detail page, analyticscreator hides the generic connection-string editor and the template action. it shows the azure-specific fields storage account and azure key instead. saving an azure blob connector requires a connector name and connector type. analyticscreator stores the storage account and azure key on the connector record, leaves the generic connection string empty, saves the selected azure source type, and refreshes the navigation tree. access azure blob connector type configuration is opened through the common connector editor. the connector type itself is selected in the connector type field. how to access navigation tree data warehouse -> connectors -> add connector, or data warehouse -> connectors -> connector -> edit connector toolbar sources -> new connector -> add, or sources -> list -> connectors diagram not direct. edit an azure blob connector from the connectors list or connector node. visual element connector detail page, connectors list, and connectors navigation-tree node. screen overview the connector detail page contains the following visible fields and actions when the azure blob connector type is selected. id property description 1 you can use the #encrypted_string# alias instead of plain-text passwords. you can add an encrypted string using options->encrypted strings help text shown at the top of the connector page. for azure blob, the generic connection-string editor is hidden after this connector type is selected. 2 connector name connector name. saving requires a non-empty value. 3 connector type select azure blob. 4 azure source type stores the azure source type associated with the connector. the seeded azure blob connector type uses azureblobstorage. 5 do not store connection string in cfg.ssis__configurations stores the connector's ssis-configuration flag. the azure blob connector itself keeps account information in azure-specific fields rather than in the generic connection-string box. 6 storage account azure blob storage account name. analyticscreator uses it to build the endpoint https://{account}.blob.core.windows.net for connection testing. 7 azure key azure storage account key. the field is saved on the connector record and used as storage credentials when testing the connection. 8 test connection creates an azure blob client for the storage-account endpoint, uses the entered key when present, and lists containers to verify access. a success message is shown when the test completes. 9 save saves the connector, refreshes the navigation tree, and reloads the saved connector page. 10 cancel returns to the previous page. if there are unsaved changes, analyticscreator asks whether to save or cancel the navigation. list behavior the connectors list filters by connector name, connector type id, connection string, locale, code page, or format. the list grid shows connectorname, connectortype, and connectionstring. double-clicking a connector opens it in the connector detail page. new opens a new connector detail page. delete removes the selected connector after confirmation. connector actions the connectors branch provides refresh, list connectors, add connector, import connector from file, and import connector from cloud. a selected connector provides set diagram filter, add to diagram filter, edit connector, delete connector, dwh wizard, refresh used sources, refresh all sources, export connector to file, and export connector to cloud. the azure blob connector type is displayed with the cloud-file connector icon when connector nodes are rendered. related topics connector types connector connectors list connector page previous oledb.net nextodata"}
,{"id":386708347110,"name":"OData","type":"topic","path":"/docs/reference/entity-types/connector-types/connector-types-odata","breadcrumb":"Reference › Entity types › Connector types › OData","description":"","searchText":"reference entity types connector types odata overview odata is the connector type for odata service sources. in the repository seed data it is stored as odata with connectortypeid = 12, the description odata service, ole db behavior disabled, and the azure source type odata. function use the odata connector type when a connector should read source metadata from an odata service endpoint. when odata is selected in the connector detail page, analyticscreator hides the connection-string and template controls and shows the url, authentication, and test connection controls. the authentication modes are none, windows, and basic. login and password fields are shown only when basic authentication is selected. testing an odata connector appends $metadata to the service url and sends an http request to the metadata endpoint. windows authentication uses the current network credentials. basic authentication sends the configured login and password. saving stores the odata url, authentication mode, login, and encrypted password, then refreshes the navigation tree. access odata connector type configuration is opened through the common connector editor. the connector type itself is selected in the connector type field. how to access navigation tree data warehouse -> connectors -> add connector, or data warehouse -> connectors -> connector -> edit connector toolbar sources -> new connector -> add, or sources -> list -> connectors diagram not direct. edit an odata connector from the connectors list or connector node. visual element connector detail page, connectors list, and connectors navigation-tree node. screen overview the connector detail page contains the following visible fields and actions when the odata connector type is selected. id property description 1 you can use the #encrypted_string# alias instead of plain-text passwords. you can add an encrypted string using options->encrypted strings help text shown at the top of the connector page. for odata, the password is encrypted when it is saved. 2 connector name connector name. saving requires a non-empty value. 3 connector type select odata. 4 azure source type stores the azure source type associated with the connector. the seeded odata connector type uses odata. 5 do not store connection string in cfg.ssis__configurations stores the common connector flag. the odata connector itself stores url and authentication fields instead of a connection string. 6 url odata service url. test connection appends $metadata to this url before sending the request. 7 authentication authentication mode. available values are none, windows, and basic. new odata connectors default to none. 8 login login field shown when basic authentication is selected. 9 password password field shown when basic authentication is selected. the password is encrypted before it is stored. 10 test connection requests the odata metadata endpoint. windows authentication uses current network credentials; basic authentication sends the configured login and password. 11 save saves the connector, stores the odata url, authentication mode, login, and encrypted password, refreshes the navigation tree, and reloads the saved connector page. 12 cancel returns to the previous page. if there are unsaved changes, analyticscreator asks whether to save or cancel the navigation. list behavior the connectors list filters by connector name, connector type id, connection string, locale, code page, or format. the list grid shows connectorname, connectortype, and connectionstring. double-clicking a connector opens it in the connector detail page. new opens a new connector detail page. delete removes the selected connector after confirmation. connector actions the connectors branch provides refresh, list connectors, add connector, import connector from file, and import connector from cloud. a selected connector provides set diagram filter, add to diagram filter, edit connector, delete connector, dwh wizard, refresh used sources, refresh all sources, export connector to file, and export connector to cloud. the odata connector type is displayed with the web-service connector icon when connector nodes are rendered. related topics connector types connector connectors list connector page previous azure blob nextsource types"}
,{"id":383509396687,"name":"Source types","type":"subsection","path":"/docs/reference/entity-types/source-types","breadcrumb":"Reference › Entity types › Source types","description":"","searchText":"reference entity types source types source types define how data is read into analyticscreator and how the source object behaves during import and processing. use this section to understand the available source types and choose the appropriate one for your source system and loading pattern. available source types table use a table source when data should be read directly from a physical source table. direct table-based import typical default source type suitable for standard relational loading open table query use a query source when the input should be defined by a custom sql statement instead of a direct table reference. custom query-based source definition useful for filtered or pre-shaped input more flexible than direct table access open query sap deltaq use sap deltaq when loading sap extractor-based data with delta handling. sap-specific source type supports extractor-oriented loading scenarios relevant for delta-based sap integration open sap_deltaq view use a view source when data should be read from a database view instead of a physical table. view-based source access useful for predefined source abstraction suitable when logic is already encapsulated in the source open view sap_deltaq sap_deltaq is source type 3. it is used for sap delta queue sources on sap connectors. open sap_deltaq sap_odp sap_odp is source type 5. it is used for sap odp sources on sap connectors. open sap_odp how to choose a source type use table for standard relational source loading use view when the source system already exposes the required structure through a database view use query when the source needs custom filtering or shaping before import use sap deltaq for sap extractor scenarios with delta-oriented loading behavior key takeaway source types define how source data is accessed and should be selected based on the technical structure and loading behavior of the source system. previous odata nexttable"}
,{"id":386708347123,"name":"Table","type":"topic","path":"/docs/reference/entity-types/source-types/entity-types-source-types-table","breadcrumb":"Reference › Entity types › Source types › Table","description":"","searchText":"reference entity types source types table overview table is source type 1 (table). it is the default source type for new sources. function this type defines a source that reads from a physical table. the define source page keeps the query tab hidden and uses the definition tab for source columns. access this source type is configured in the define source page after reading or editing a source and choosing table in the type list. how to access navigation tree sources -> connector -> right-click -> read source from connector toolbar sources -> sources diagram not applicable. visual element define source -> type screen overview id property description 1 source name defines the source name. 2 source schema stores the source schema. 3 connector selects the connector used by the source. 4 group assigns the source to a group. 5 type sets the source type to table. 6 friendly name stores the friendly display name of the source. 7 anonymization check statement stores the anonymization check statement for the source. 8 description stores the source description. 9 definition tab shows the source-column definition grid. 10 column name stores the source-column name. 11 data type stores the source-column data type. 12 referenced column links the source column to a referenced key column when needed. 13 description stores the source-column description. 14 constraints opens the source constraints dialog for a stored source. 15 cancel returns to the previous page without saving. 16 save saves the source definition. related topics query sap_deltaq sap_odp view previous source types nextquery"}
,{"id":386708347120,"name":"Query","type":"topic","path":"/docs/reference/entity-types/source-types/entity-types-source-types-query","breadcrumb":"Reference › Entity types › Source types › Query","description":"","searchText":"reference entity types source types query overview query is source type 4 (query). it is used for sources defined by a sql query instead of a physical table or view. function selecting query shows the query tab in define source and changes the secondary action button to test query. saving a changed query refreshes the source structure. access this source type is configured in the define source page after creating or editing a source and choosing query in the type list. how to access navigation tree sources -> connector -> right-click -> create new source toolbar sources -> sources diagram not applicable. visual element define source -> type screen overview id property description 1 source name defines the source name. 2 source schema stores the source schema. 3 connector selects the connector used by the source. 4 group assigns the source to a group. 5 type sets the source type to query. 6 friendly name stores the friendly display name of the source. 7 anonymization check statement stores the anonymization check statement for the source. 8 description stores the source description. 9 definition tab shows the source-column definition grid. 10 query tab becomes visible when the source type is query. 11 query stores the sql query. the query cannot be empty for source type query. 12 test query tests the current query text. 13 constraints opens the source constraints dialog for a stored source. 14 cancel returns to the previous page without saving. 15 save saves the source. if the query changed, the source structure is refreshed. related topics sap_deltaq sap_odp table view previous table nextsap_deltaq"}
,{"id":386708347121,"name":"SAP_DELTAQ","type":"topic","path":"/docs/reference/entity-types/source-types/entity-types-source-types-sap-deltaq","breadcrumb":"Reference › Entity types › Source types › SAP_DELTAQ","description":"","searchText":"reference entity types source types sap_deltaq overview sap_deltaq is source type 3. it is used for sap delta queue sources on sap connectors. function selecting sap_deltaq on an sap connector shows the sap deltaq/odp pane in deltaq mode with extractor, update mode, auto sync, queue type, log destination, and rfc destination. access this source type is configured in the define source page after reading or editing a source on an sap connector and choosing sap_deltaq in the type list. how to access navigation tree sources -> connector -> right-click -> read source from connector toolbar sources -> sources diagram not applicable. visual element define source -> type screen overview id property description 1 source name defines the source name. 2 source schema stores the source schema. 3 connector selects the sap connector used by the source. 4 group assigns the source to a group. 5 type sets the source type to sap_deltaq. 6 friendly name stores the friendly display name of the source. 7 anonymization check statement stores the anonymization check statement for the source. 8 description stores the source description. 9 definition tab shows the source-column definition grid. 10 extractor stores the sap extractor name. 11 mode selects the sap deltaq update mode. 12 auto sync. controls automatic synchronization for the source. 13 type selects the sap deltaq source type inside the sap deltaq/odp pane. 14 log.destination selects or stores the sap log destination. 15 rfc destination selects or stores the sap rfc destination. 16 constraints opens the source constraints dialog for a stored source. 17 cancel returns to the previous page without saving. 18 save saves the source definition. related topics query sap_odp table view previous query nextsap_odp"}
,{"id":386708347122,"name":"SAP_ODP","type":"topic","path":"/docs/reference/entity-types/source-types/entity-types-source-types-sap-odp","breadcrumb":"Reference › Entity types › Source types › SAP_ODP","description":"","searchText":"reference entity types source types sap_odp overview sap_odp is source type 5. it is used for sap odp sources on sap connectors. function selecting sap_odp on an sap connector shows the sap deltaq/odp pane in odp mode with context, update mode, semantic, and full or delta capability flags. access this source type is configured in the define source page after reading or editing a source on an sap connector and choosing sap_odp in the type list. how to access navigation tree sources -> connector -> right-click -> read source from connector toolbar sources -> sources diagram not applicable. visual element define source -> type screen overview id property description 1 source name defines the source name. 2 source schema stores the source schema. 3 connector selects the sap connector used by the source. 4 group assigns the source to a group. 5 type sets the source type to sap_odp. 6 friendly name stores the friendly display name of the source. 7 anonymization check statement stores the anonymization check statement for the source. 8 description stores the source description. 9 definition tab shows the source-column definition grid. 10 context stores the sap odp context. 11 mode selects the odp update mode. 12 auto sync. controls automatic synchronization for the source. 13 semantic selects the sap odp semantic. 14 supports full shows whether full extraction is supported. 15 supports delta shows whether delta extraction is supported. 16 constraints opens the source constraints dialog for a stored source. 17 cancel returns to the previous page without saving. 18 save saves the source definition. related topics query sap_deltaq table view previous sap_deltaq nextview"}
,{"id":386708347124,"name":"VIEW","type":"topic","path":"/docs/reference/entity-types/source-types/entity-types-source-types-view","breadcrumb":"Reference › Entity types › Source types › VIEW","description":"","searchText":"reference entity types source types view overview view is source type 2 (view). it is used for sources backed by a database view. function this type uses the same source definition page as table and keeps the query tab hidden while the definition tab stores the source columns. access this source type is configured in the define source page after reading or editing a source and choosing view in the type list. how to access navigation tree sources -> connector -> right-click -> read source from connector toolbar sources -> sources diagram not applicable. visual element define source -> type screen overview id property description 1 source name defines the source name. 2 source schema stores the source schema. 3 connector selects the connector used by the source. 4 group assigns the source to a group. 5 type sets the source type to view. 6 friendly name stores the friendly display name of the source. 7 anonymization check statement stores the anonymization check statement for the source. 8 description stores the source description. 9 definition tab shows the source-column definition grid. 10 column name stores the source-column name. 11 data type stores the source-column data type. 12 referenced column links the source column to a referenced key column when needed. 13 description stores the source-column description. 14 constraints opens the source constraints dialog for a stored source. 15 cancel returns to the previous page without saving. 16 save saves the source definition. related topics query sap_deltaq sap_odp table previous sap_odp nexttable types"}
,{"id":383509396688,"name":"Table types","type":"subsection","path":"/docs/reference/entity-types/table-types","breadcrumb":"Reference › Entity types › Table types","description":"","searchText":"reference entity types table types table types define how tables behave in analyticscreator and what role they play in the generated data warehouse structure. use this section to understand the available table types and choose the appropriate one for staging, historization, persistence, dimensional modeling, or data vault modeling. available table types import table used to receive source data during import into the staging layer. entry point for source loading filled by generated workflows basis for downstream processing open import table historized table used to store historized data with validity periods and change tracking. supports history over time typical basis for persistent staging common for scd2-style processing open historized table persisting table used to materialize transformation results physically instead of keeping them only as views. improves performance for complex logic stores generated output physically maintained by generated procedures open persisting table dimension table used to store descriptive business entities for dimensional modeling. typical star schema component contains descriptive attributes referenced by fact tables open dimension table externally filled table used when table content is populated outside the standard analyticscreator-generated loading process. externally maintained data not filled by standard generated import logic useful for integration scenarios open externally filled table fact table used to store measurable business events and transactions in dimensional models. contains measures and foreign keys central table in star schemas supports analytical aggregation open fact table datavault hub used to store stable business keys in data vault models. represents core business entities key-centric structure foundation of hub-based modeling open datavault hub datavault link used to store relationships between business entities in data vault models. connects hubs represents business relationships supports scalable model design open datavault link datavault satellite used to store descriptive and changing attributes in data vault models. contains contextual attributes often historized by design separated from business keys open datavault satellite historized table historized table identifies a table that stores historical versions of another table in analyticscreator. use this table type when changes in a business object must be preserved instead of overwritten. open historized table how to choose a table type use import table for source ingestion into staging use historized table when changes over time must be tracked use persisting table when transformation results should be materialized physically use dimension table and fact table for dimensional modeling use externally filled table when data is maintained outside the generated loading process use datavault hub, datavault link, and datavault satellite for data vault models key takeaway table types define how data is stored and modeled in analyticscreator, from source ingestion and historization to dimensional and data vault structures. previous view nextimport table"}
,{"id":386676751607,"name":"Import table","type":"topic","path":"/docs/reference/entity-types/table-types/entity-types-table-types-import-table","breadcrumb":"Reference › Entity types › Table types › Import table","description":"","searchText":"reference entity types table types import table overview import table identifies a table that receives data from a configured source in analyticscreator. use this table type for the first persisted landing structure that stores imported source fields before historization, persistence, or transformation processing continues. function an import table is normally created through the import wizard. the wizard asks for the source, target schema, target table name, and package, then creates the import table and copies the available source-field definitions into the target column structure. in the table editor, import table behaves like an editable table definition. the table name, schema, business metadata, column list, primary-key settings, identity-column configuration, calculated columns, scripts, and table definition can be reviewed and maintained. the import definition connects source fields to target columns. it also controls operational settings such as the package, update statistics, logging, optional sql/filter logic, variables, scripts, and load options. access create an import table from the import flow. open an existing import table from the tables list, the navigation tree, the imports list, or the architecture diagram. how to access navigation tree tables -> open an import table toolbar etl -> imports diagram architecture -> add -> import visual element table editor -> table type -> import table screen overview the table editor shows the import table classification together with editable table metadata, source-aligned columns, primary-key controls, identity-column settings, calculated columns, scripts, and the generated table definition. id property description 1 table name defines the import table name. the import wizard can propose a name from the selected connector, source schema, and source name. 2 table schema selects the schema that owns the import table. 3 table type classifies the table as an import table. 4 friendly name stores the business-friendly label for the import table. 5 description stores the business description for the imported source data. 6 has primary key enables primary-key handling when imported data has key columns. 7 pk clustered controls whether the primary key is created as clustered when a primary key is enabled. 8 primary key name shows the generated or entered primary-key name. 9 is in-memory table marks the import table for in-memory handling when applicable. 10 columns maintains the imported column list. source fields copied by the wizard can be adjusted, and rows can be added or removed for this table type. 11 calculated columns maintains calculated columns for the import table. 12 identity column configures an optional identity column, including name, type, seed, increment, and primary-key position. 13 scripts stores scripts associated with the import table. 14 table definition shows the generated table definition for review. related topics historized table persisting table externally filled table direct-connector transformation previous table types nexthistorized table"}
,{"id":386676751606,"name":"Historized table","type":"topic","path":"/docs/reference/entity-types/table-types/entity-types-table-types-historized-table","breadcrumb":"Reference › Entity types › Table types › Historized table","description":"","searchText":"reference entity types table types historized table overview historized table identifies a table that stores historical versions of another table in analyticscreator. use this table type when changes in a business object must be preserved instead of overwritten. function a historized table is created for a selected source table and keeps the generated history structure linked back to that original table. it is typically created through the historization wizard, where the target schema, target table name, package, scd type, empty-record behavior, and vault id option are selected. in the table editor, historized table remains an editable table definition. the table name, schema, business metadata, columns, calculated columns, scripts, and table definition can be reviewed and maintained, while the historization relationship is shown through the hist of table field. the editor also enables the hub of table, satellite of table, and link of table selectors for history tables. these fields connect the history table to data vault structures when the historized output participates in vault modeling. access create a historized table from the historization flow. open an existing history table from the tables list, the navigation tree, or the architecture diagram. how to access navigation tree tables -> open a historized table toolbar etl -> historizations diagram architecture -> add -> historization visual element table editor -> table type -> historized table screen overview the table editor shows the historized table classification together with editable table metadata, the related source-table link, data vault relationship selectors, and the history table column structure. id property description 1 table name defines the name of the history table. 2 table schema selects the schema that owns the history table. 3 table type classifies the table as a history table for another table. 4 friendly name stores the business-friendly label for the history table. 5 description stores the business description for the history table. 6 hist of table selects or shows the original table whose changes are stored in this history table. 7 hub of table links the history table to a related data vault hub when applicable. 8 satellite of table links the history table to a related data vault satellite when applicable. 9 link of table links the history table to a related data vault link when applicable. 10 columns maintains the history table columns. additional generated history columns are visible together with business columns from the original table. 11 calculated columns maintains calculated columns for the history table. 12 identity column identity-column configuration is protected for this table type because the history structure is generated by the historization flow. 13 scripts stores scripts associated with the history table. 14 table definition shows the generated table definition for review. related topics import table persisting table datavault hub datavault satellite previous import table nextpersisting table"}
,{"id":386676751608,"name":"Persisting table","type":"topic","path":"/docs/reference/entity-types/table-types/entity-types-table-types-persisting-table","breadcrumb":"Reference › Entity types › Table types › Persisting table","description":"","searchText":"reference entity types table types persisting table overview persisting table identifies a physical table that stores the result of a transformation in analyticscreator. use this table type when a transformation result must be materialized for reuse, performance, incremental processing, or downstream dependencies. function a persisting table is normally created through the persisting wizard. the wizard asks for the source transformation, the persist table name, the persist package, and the load handling option, such as no partition switching, partition switching, or renaming. in the table editor, persisting table is linked back to the transformation output that created it. the persisted table name is protected from direct editing because it is managed by the persisting flow, while the table metadata, columns, calculated columns, scripts, and table definition remain available for review and maintenance. persisting can be configured for different load patterns, including full, merge, historical, incremental, and manual handling. the persisting definition also controls operational options such as update statistics, logging, duplicate removal, transaction handling, procedure review, and pre/post scripts. access create a persisting table from the persisting flow for a transformation. open an existing persisted table from the tables list, the navigation tree, or the architecture diagram. how to access navigation tree tables -> open a persisting table toolbar dwh -> tables diagram architecture -> add -> persisting visual element table editor -> table type -> persisting table screen overview the table editor shows the persisting table classification together with protected persisted-table naming, the source transformation link, editable column structure, calculated columns, scripts, and the generated table definition. id property description 1 table name shows the persisted table name. the field is protected because the name is managed by the persisting flow. 2 table schema shows the schema that owns the persisted table. 3 table type classifies the table as a persisted transformation output and indicates whether history handling is used. 4 friendly name stores the business-friendly label for the persisted output. 5 description stores the business description for the persisted output. 6 persist of table shows the transformation result or base table that is materialized by this persisted table. 7 has primary key enables primary-key handling when the persisted output has key columns. 8 pk clustered controls whether the primary key is created as clustered when a primary key is enabled. 9 primary key name shows the generated or entered primary-key name. 10 columns maintains the persisted table columns. column rows can be added, changed, or removed for this table type. 11 add.col marks additional generated columns that belong to the persisted output structure. 12 calculated columns maintains calculated columns for the persisted table. 13 scripts stores scripts associated with the persisted table. 14 table definition shows the generated table definition for review. related topics import table historized table dimension table fact table previous historized table nextdimension table"}
,{"id":386676751603,"name":"Dimension table","type":"topic","path":"/docs/reference/entity-types/table-types/entity-types-table-types-dimension-table","breadcrumb":"Reference › Entity types › Table types › Dimension table","description":"","searchText":"reference entity types table types dimension table overview dimension table identifies a data mart dimension output in analyticscreator. use this table type for descriptive business attributes that are used to filter, group, and navigate facts in analytical models. function a dimension table represents a data mart dimension view. the dimension can be maintained as a non-historized output or as a historized output when the model needs to preserve changes over time. in the table editor, dimension table is handled as a view-based data mart object. the table name and generated structure are protected from direct table-definition editing, while business metadata and analytical settings remain available for review and maintenance. because dimension table is a data mart type, the editor shows analytical controls such as export to olap, hidden in olap, olap category, olap column settings, dax columns, and measures. the table definition tab is not editable because the dimension is generated as a view. access open an existing dimension table from the tables list or from the navigation tree. a dimension object can also be opened from the architecture diagram when reviewing the data mart model. how to access navigation tree tables -> open a dimension table toolbar dwh -> tables diagram architecture -> double-click a dimension object visual element table editor -> table type -> dimension table screen overview the table editor shows the dimension table classification together with metadata, column structure, and analytical controls for data mart output. id property description 1 table name shows the generated dimension table or view name. for this managed output type, the field is protected from direct renaming in the table editor. 2 table schema shows the schema that owns the dimension output. 3 table type classifies the table as a dimension table and indicates whether the output is non-historized or historized. 4 friendly name stores the business-friendly label for the dimension. 5 description stores the business description for the dimension output. 6 inherit display folder controls how display-folder metadata is inherited for analytical output. 7 export to olap controls whether the dimension is included in generated analytical models. 8 hidden in olap marks the dimension as hidden in analytical output when selected. 9 olap category assigns the analytical category used by generated models. 10 columns shows the dimension columns and the olap-related column settings that are available for data mart objects. 11 tabular olap dax columns shows calculated dax columns for the dimension when analytical modeling is used. 12 measures provides the measures grid that is enabled for data mart table types. 13 scripts stores scripts associated with the dimension output. 14 table definition not editable for dimension table because the output is generated as a view. related topics fact table persisting table datamart transformation regular transformation previous persisting table nextexternally filled table"}
,{"id":386676751604,"name":"Externally filled table","type":"topic","path":"/docs/reference/entity-types/table-types/entity-types-table-types-externally-filled-table","breadcrumb":"Reference › Entity types › Table types › Externally filled table","description":"","searchText":"reference entity types table types externally filled table overview externally filled table identifies a result table whose rows are loaded by an external transformation process. use this table type when analyticscreator needs to document and manage the target structure, while the actual data load is handled outside the standard generated transformation flow. function an externally filled table stores the output of an external transformation. it can be maintained as a regular external result table or as a historized external result table when changes need to be tracked over time. in the table editor, externally filled table behaves like an editable table definition. the table name, schema, column list, primary key settings, and table definition can be maintained directly, so the structure matches the data produced by the external process. the editor also provides load field definitions from existing table. this action lets you choose a database and table, then replace the current column list with the selected table's field definitions, including data type, length, precision, scale, nullability, default value, identity settings, calculated-field expression, and key information when available. access create an externally filled table from the tables area or from the architecture diagram add menu. open an existing external result table from the tables list, the navigation tree, or the architecture diagram. how to access navigation tree tables -> add externally filled table toolbar dwh -> tables diagram architecture -> add -> externally filled table visual element table editor -> table type -> externally filled table screen overview the table editor shows the externally filled table classification together with editable table metadata, column structure, primary-key controls, and the field-definition import action. id property description 1 table name defines the external result table name. 2 table schema selects the schema that owns the external result table. 3 table type classifies the table as an external result table and indicates whether the output is non-historized or historized. 4 friendly name stores the business-friendly label for the external result table. 5 description stores the business description for the table. 6 has primary key enables primary-key handling when the table has key columns. 7 pk clustered controls whether the primary key is created as clustered when a primary key is enabled. 8 primary key name stores the generated or entered primary-key name. 9 is in-memory table marks the table for in-memory handling when applicable. 10 columns defines the external table columns. column rows can be added, changed, or removed for this table type. 11 load field definitions from existing table imports the field list from a selected database table. existing columns are replaced after confirmation, and the table definition must be saved before this action can run. 12 calculated columns maintains calculated columns for the external result table. 13 scripts stores scripts associated with the table. 14 table definition shows the generated table definition for review. related topics persisting table import table external transformation script transformation previous dimension table nextfact table"}
,{"id":386676751605,"name":"Fact table","type":"topic","path":"/docs/reference/entity-types/table-types/entity-types-table-types-fact-table","breadcrumb":"Reference › Entity types › Table types › Fact table","description":"","searchText":"reference entity types table types fact table overview fact table identifies a data mart fact output in analyticscreator. use this table type for quantitative business events, transactions, and measurements that connect to dimensions in analytical models. function a fact table represents a data mart fact view. the fact can be maintained as a non-historized output or as a historized output when the model needs to preserve changes over time. in the table editor, fact table is handled as a view-based data mart object. the table name and generated structure are protected from direct table-definition editing, while business metadata, analytical settings, and measure-related information remain available for review and maintenance. because fact table is a data mart type, the editor shows analytical controls such as olap perspective, export to olap, hidden in olap, olap category, olap column settings, dax columns, and measures. the table definition tab is not editable because the fact output is generated as a view. access open an existing fact table from the tables list or from the navigation tree. fact definitions can also be maintained from the model area, where a fact can be created with measures and related dimensions before it is generated as a data mart transformation. how to access navigation tree tables -> open a fact table toolbar dwh -> tables diagram architecture -> double-click a fact object visual element table editor -> table type -> fact table screen overview the table editor shows the fact table classification together with metadata, fact columns, measure-related information, and analytical controls for data mart output. id property description 1 table name shows the generated fact table or view name. for this managed output type, the field is protected from direct renaming in the table editor. 2 table schema shows the schema that owns the fact output. 3 table type classifies the table as a fact table and indicates whether the output is non-historized or historized. 4 friendly name stores the business-friendly label for the fact output. 5 description stores the business description for the fact output. 6 olap perspective assigns the fact output to the analytical perspective used by generated models. 7 inherit display folder controls how display-folder metadata is inherited for analytical output. 8 export to olap controls whether the fact is included in generated analytical models. 9 hidden in olap marks the fact output as hidden in analytical output when selected. 10 olap category assigns the analytical category used by generated models. 11 columns shows the fact columns, including keys that relate the fact to dimensions and columns used for measures. 12 tabular olap dax columns shows calculated dax columns for the fact output when analytical modeling is used. 13 measures provides the measures grid used to maintain quantitative values for the analytical model. 14 scripts stores scripts associated with the fact output. 15 table definition not editable for fact table because the output is generated as a view. related topics dimension table persisting table datamart transformation regular transformation previous externally filled table nextdatavault hub"}
,{"id":386676751600,"name":"DataVault Hub","type":"topic","path":"/docs/reference/entity-types/table-types/entity-types-table-types-datavault-hub","breadcrumb":"Reference › Entity types › Table types › DataVault Hub","description":"","searchText":"reference entity types table types datavault hub overview datavault hub identifies a datavault hub table in analyticscreator. use this table type for the central business-key table that anchors satellites and links in a data vault model. function a datavault hub table represents the stable key for a business object. it is created from a source table with a primary key and can be historized during the hub creation flow. in the table editor, datavault hub is handled as a managed table type. the table name and structural column definitions are protected from direct editing, while business metadata such as friendly name, description, scripts, dependencies, and table definition remain available for review and maintenance. the vault wizard creates the related hub transformation and, when historization is selected, the hub table and historization package details. the wizard requires a source table, transformation schema, transformation name, hub schema, hub name, and history package when a historized hub is created. access open an existing datavault hub table from the tables list or from the navigation tree. to create a new hub, use the diagram add menu and choose datavault hub. how to access navigation tree tables -> open a datavault hub table toolbar dwh -> tables diagram architecture -> add -> datavault hub visual element table editor -> table type -> datavault hub screen overview the table editor shows the datavault hub classification together with the table metadata and column structure. the vault wizard provides the creation fields for a new hub. id property description 1 table name shows the hub table name. for this managed table type, the field is protected from direct renaming in the table editor. 2 table schema shows the schema that owns the hub table. 3 table type classifies the table as datavault hub. 4 friendly name stores the business-friendly label for the hub table. 5 description stores the business description for the hub table. 6 columns shows the hub columns. structural column fields are protected from direct editing for this managed table type. 7 table definition shows the generated table definition for review. 8 source table selects the source table used by the vault wizard to create the hub. the source table must have a primary key. 9 hub schema selects the schema for the generated hub table when historization is enabled. 10 hub name defines the generated hub table name in the vault wizard. 11 hist package defines the package used for the historized hub flow. related topics datavault link datavault satellite historized table import table previous fact table nextdatavault link"}
,{"id":386676751601,"name":"DataVault Link","type":"topic","path":"/docs/reference/entity-types/table-types/entity-types-table-types-datavault-link","breadcrumb":"Reference › Entity types › Table types › DataVault Link","description":"","searchText":"reference entity types table types datavault link overview datavault link identifies a datavault link table in analyticscreator. use this table type to model relationships between business keys, such as the association between two or more hub-driven entities. function a datavault link table represents a relationship in the data vault model. it is created from a source table with a primary key and at least one selected referenced table in the link creation flow. in the table editor, datavault link is handled as a managed table type. the table name and structural column definitions are protected from direct editing, while business metadata such as friendly name, description, scripts, dependencies, and table definition remain available for review and maintenance. the vault wizard creates the related link transformation and, when historization is selected, the link table and historization package details. the link tab can also create a linksat by providing a linksat name, linksat package, and the referenced tables to include. access open an existing datavault link table from the tables list or from the navigation tree. to create a new link, use the diagram add menu and choose datavault link. how to access navigation tree tables -> open a datavault link table toolbar dwh -> tables diagram architecture -> add -> datavault link visual element table editor -> table type -> datavault link screen overview the table editor shows the datavault link classification together with the table metadata and column structure. the vault wizard provides the creation fields for a new link and optional linksat. id property description 1 table name shows the link table name. for this managed table type, the field is protected from direct renaming in the table editor. 2 table schema shows the schema that owns the link table. 3 table type classifies the table as datavault link. 4 friendly name stores the business-friendly label for the link table. 5 description stores the business description for the link table. 6 columns shows the link columns. structural column fields are protected from direct editing for this managed table type. 7 table definition shows the generated table definition for review. 8 source table selects the source table used by the vault wizard to create the link. the source table must have a primary key. 9 link schema selects the schema for the generated link table when historization is enabled. 10 link name defines the generated link table name in the vault wizard. 11 hist package defines the package used for the historized link flow. 12 create linksat adds a linksat to the link creation flow when selected. 13 linksat name defines the optional linksat name. 14 linksat package defines the package for the optional linksat flow. 15 include selects which referenced tables are included in the link. 16 table shows the referenced table available for inclusion in the link. related topics datavault hub datavault satellite historized table import table previous datavault hub nextdatavault satellite"}
,{"id":386676751602,"name":"DataVault Satellite","type":"topic","path":"/docs/reference/entity-types/table-types/entity-types-table-types-datavault-satellite","breadcrumb":"Reference › Entity types › Table types › DataVault Satellite","description":"","searchText":"reference entity types table types datavault satellite overview datavault satellite identifies a datavault satellite table in analyticscreator. use this table type to store descriptive and historized attributes for a business key that is already represented in the data vault model. function a datavault satellite table represents the changing descriptive context for a hub-driven business object. it is created from a source table with a primary key and can be historized during the satellite creation flow. in the table editor, datavault satellite is handled as a managed table type. the table name and structural column definitions are protected from direct editing, while business metadata such as friendly name, description, scripts, dependencies, and table definition remain available for review and maintenance. the vault wizard creates the related satellite transformation and, when historization is selected, the satellite table and historization package details. the wizard uses the source table, transformation schema, transformation name, satellite schema, satellite name, and history package to generate the satellite flow. access open an existing datavault satellite table from the tables list or from the navigation tree. to create a new satellite, use the diagram add menu and choose datavault satellite. how to access navigation tree tables -> open a datavault satellite table toolbar dwh -> tables diagram architecture -> add -> datavault satellite visual element table editor -> table type -> datavault satellite screen overview the table editor shows the datavault satellite classification together with the table metadata and column structure. the vault wizard provides the creation fields for a new satellite. id property description 1 table name shows the satellite table name. for this managed table type, the field is protected from direct renaming in the table editor. 2 table schema shows the schema that owns the satellite table. 3 table type classifies the table as datavault satellite. 4 satellite of table shows the table relationship used to identify which business key or source table the satellite describes. 5 friendly name stores the business-friendly label for the satellite table. 6 description stores the business description for the satellite table. 7 columns shows the satellite columns. structural column fields are protected from direct editing for this managed table type. 8 table definition shows the generated table definition for review. 9 source table selects the source table used by the vault wizard to create the satellite. the source table must have a primary key. 10 transformation schema selects the schema for the generated satellite transformation. 11 transformation name defines the generated satellite transformation name. 12 add historization controls whether the wizard creates the historized satellite table and package details. 13 satellite schema selects the schema for the generated satellite table when historization is enabled. 14 satellite name defines the generated satellite table name in the vault wizard. 15 hist package defines the package used for the historized satellite flow. related topics datavault hub datavault link historized table import table previous datavault link nexttransformation types"}
,{"id":383509396689,"name":"Transformation types","type":"subsection","path":"/docs/reference/entity-types/transformation-types","breadcrumb":"Reference › Entity types › Transformation types","description":"","searchText":"reference entity types transformation types transformation types define how logic is implemented and executed in analyticscreator. they determine whether a transformation is generated automatically, maintained manually, executed externally, or used for a specific modeling purpose such as data marts or unions. use this section to understand the available transformation types and choose the appropriate one for your modeling and execution scenario. available transformation types datamart transformation used to expose data in a form intended for analytical consumption in the data mart layer. consumption-oriented structure typical basis for facts and dimensions used in reporting-facing models open datamart transformation regular transformation standard generated transformation type used for typical sql-based transformation logic. common default transformation type usually generated as sql view logic suitable for most modeling scenarios open regular transformation direct-connector transformation used when transformation logic is tied directly to a connector-based source or source-side access pattern. connector-oriented processing useful for direct source integration scenarios bridges source access and transformation logic open direct-connector transformation external transformation used when transformation logic is implemented outside the standard generated sql transformation flow. external execution logic useful for integration with external processing suitable when logic is not managed as standard generated sql open external transformation script transformation used when transformation logic is implemented through script-based execution instead of standard generated sql view logic. script-driven transformation behavior useful for non-standard processing steps supports custom execution logic open script transformation manual transformation used when transformation logic is written manually instead of being generated automatically from metadata. manual sql definition maximum flexibility useful for special-case logic open manual transformation union transformation used to combine multiple compatible inputs into a single transformation result. combines multiple sources or transformations useful for consolidation scenarios supports structurally aligned inputs open union transformation how to choose a transformation type use regular transformation for standard generated sql-based transformation logic use datamart transformation for reporting and analytical output structures use manual transformation when the logic must be written explicitly use script transformation or external transformation for non-standard execution patterns use union transformation when multiple inputs must be merged into one output use direct-connector transformation when the transformation is tightly coupled to connector-based source access key takeaway transformation types define how transformation logic is generated, maintained, and executed in analyticscreator, and should be selected based on the required level of automation, flexibility, and execution pattern. previous datavault satellite nextregular transformation"}
,{"id":386692502720,"name":"Regular transformation","type":"topic","path":"/docs/reference/entity-types/transformation-types/entity-types-transformation-types-regular-transformation","breadcrumb":"Reference › Entity types › Transformation types › Regular transformation","description":"","searchText":"reference entity types transformation types regular transformation overview regular transformation is the standard transformation type for building a transformation from selected source tables, joins, output columns, filters, and optional persistence settings. use it when the transformation can be modeled through the editor grids instead of being written manually. function a regular transformation defines how source tables are combined and which columns are exposed in the transformation output. the editor enables the table, reference, column, star, snapshot, and predefined-transformation areas so the transformation can be maintained through structured selections. the tables grid defines the participating tables, aliases, join behavior, filters, and optional subselects. the references grid connects table sequence numbers through an available reference. the columns grid defines the output column names, source references, expressions, aggregation flags, default values, sequence, primary-key position, friendly names, and descriptions. when a table row is selected, the context actions can check and update columns, add all table columns to the transformation, remove all table columns from the transformation, or inherit the source table primary key. the fill columns action helps populate the output-column grid from the selected table structure. use the top-level filter and having boxes for transformation-level conditions. use persist table and persist package when the transformation output should also be materialized through a persistence package. access create a regular transformation from the transformation wizard by choosing a standard dimension, fact, or other transformation flow, or open an existing regular transformation from the transformation list. regular transformations can also be opened from the architecture diagram when the transformation is shown there. how to access navigation tree schema -> transformations -> open a regular transformation toolbar etl -> new -> new transformation or etl -> list -> transformations diagram open an existing regular transformation node from the architecture diagram when present visual element transformation editor -> transtype / tables / columns / references screen overview id property description 1 name transformation name used for the generated transformation output. 2 schema schema where the regular transformation is maintained. 3 transtype identifies the transformation as regular and enables the structured definition grids. 4 hist type defines the historization behavior expected from the transformation output. 5 tables lists the tables used by the transformation and controls sequence, aliases, join behavior, filters, and subselects. 6 columns defines the output columns, their source references or expressions, aggregation behavior, defaults, sequence, key position, friendly names, and descriptions. 7 references connects two table sequence numbers through an available reference description. 8 stars associates the transformation with star metadata, including the view name, fact flag, and optional filter. 9 predefined transformations adds reusable predefined transformation logic and controls whether it is used with vault structures. 10 snapshot group / snapshot links the transformation to snapshot metadata when snapshot-based behavior is needed. 11 filter transformation-level filter condition applied to the generated result. 12 having transformation-level having condition used when aggregated output requires a post-aggregation condition. 13 fill columns populates or refreshes output-column entries from the selected table structure. 14 persist table / persist package optional persistence settings used when the regular transformation output should be materialized. 15 save stores the transformation metadata, table layout, reference layout, column definitions, filters, and persistence settings. 16 create in dwh creates or refreshes the regular transformation in the data warehouse after the definition is saved. related topics datamart transformation manual transformation script transformation union transformation previous transformation types nextmanual transformation"}
,{"id":386692502719,"name":"Manual transformation","type":"topic","path":"/docs/reference/entity-types/transformation-types/entity-types-transformation-types-manual-transformation","breadcrumb":"Reference › Entity types › Transformation types › Manual transformation","description":"","searchText":"reference entity types transformation types manual transformation overview manual transformation is the transformation type used when the transformation view is written and maintained manually. use it when the required logic cannot be described well through the standard table, column, and reference grids, or when a specialist needs full control over the view definition. function a manual transformation stores a transformation name, schema, historization setting, optional persistence settings, and an editable view definition. analyticscreator keeps the transformation in the repository and can create or refresh it in the data warehouse, while the transformation logic itself is maintained in the view tab. when this type is selected, the editor focuses on the view tab and makes the view text editable. the standard table and reference grids are not the main editing surface for this type, because the transformation logic is supplied directly by the user. use the rename grid when a manual definition changes output column names. adding the old and new names helps analyticscreator preserve downstream metadata and references after the manual view is changed. access create a manual transformation from the transformation wizard by selecting manual, or open an existing one from the transformation list. manual transformations can also be opened from the architecture diagram when the transformation is shown there. how to access navigation tree schema -> transformations -> open a manual transformation toolbar etl -> new -> new transformation or etl -> list -> transformations diagram open an existing manual transformation node from the architecture diagram when present visual element transformation editor -> transtype / view tab / rename grid screen overview id property description 1 name transformation name used for the manually maintained view. 2 schema schema where the manual transformation is maintained. 3 transtype identifies the transformation as a manual transformation and switches the editor to manual view editing. 4 hist type defines the historization behavior expected from the manual transformation output. 5 view tab selected for manual transformations and used to edit the transformation view text. 6 rename grid captures column-name changes when a manual view is adjusted. 7 old column name previous output column name used before a manual rename. 8 new column name new output column name used after a manual rename. 9 persist table optional persisted-result table name for materializing the manual transformation output. 10 persist package optional persistence package that can include the manual transformation output. 11 save stores the manual view text, metadata, rename mappings, and persistence settings. 12 create in dwh creates or refreshes the manual transformation in the data warehouse after the definition is saved. related topics datamart transformation direct-connector transformation regular transformation script transformation previous regular transformation nextscript transformation"}
,{"id":386692502721,"name":"Script transformation","type":"topic","path":"/docs/reference/entity-types/transformation-types/entity-types-transformation-types-script-transformation","breadcrumb":"Reference › Entity types › Transformation types › Script transformation","description":"","searchText":"reference entity types transformation types script transformation overview script transformation is the transformation type used when a transformation needs to run script logic instead of being built only from table, reference, and column grids. use it for scripted transformation steps that belong in the transformation flow and may need to create a result table or run through an execution package. function a script transformation stores the transformation metadata, the script text, the selected script execution style, optional package information, and table-output metadata. the editor changes the normal view tab to script and makes the script text editable. the script type selector controls how the script text is interpreted. for database-side script logic, enter the script directly in the script tab. for executable-style script logic, the editor can prepare a template with fields for the executable path, arguments, working directory, and timeout. use create result table when the script should produce a result table managed by the transformation. use ssis package to select or name the package that executes the scripted transformation. the tables grid remains available so table entries can be associated with the script and marked as output tables when needed. use don't detect dependencies when the script should be saved and executed without automatic dependency detection. this is useful for scripts where dependency discovery is not reliable or where the dependency order is controlled outside the visible script text. access create a script transformation from the transformation wizard by selecting script, or open an existing one from the transformation list. script transformations can also be opened from the architecture diagram when the transformation is shown there. how to access navigation tree schema -> transformations -> open a script transformation toolbar etl -> new -> new transformation or etl -> list -> transformations diagram open an existing script transformation node from the architecture diagram when present visual element transformation editor -> transtype / script type / script tab screen overview id property description 1 name transformation name used for the scripted transformation step. 2 schema schema where the script transformation is maintained. 3 transtype identifies the transformation as script and switches the editor to script-oriented controls. 4 script type selects whether the script is handled as database-side script logic or executable-style script logic. 5 script tab editable script area used to maintain the scripted transformation logic. 6 executable template fields template fields for executable path, arguments, working directory, and timeout are inserted when executable-style scripting is selected on an empty script. 7 result table result-table option used when the script transformation should create a managed output table. 8 ssis package package name or selection used to execute the scripted transformation step. 9 create result table marks the script transformation as producing a result table. 10 tables lists table metadata associated with the script transformation. 11 is output table marks a table row as an output table for the script transformation. 12 don't detect dependencies disables automatic dependency detection for the scripted transformation. 13 save stores the script text, script type, package setting, result-table setting, table metadata, and dependency setting. 14 create in dwh creates or refreshes the script transformation in the data warehouse after the definition is saved. related topics external transformation manual transformation regular transformation union transformation previous manual transformation nextdirect-connector transformation"}
,{"id":386692502717,"name":"Direct-connector transformation","type":"topic","path":"/docs/reference/entity-types/transformation-types/entity-types-transformation-types-direct-connector-transformation","breadcrumb":"Reference › Entity types › Transformation types › Direct-connector transformation","description":"","searchText":"reference entity types transformation types direct-connector transformation overview direct-connector transformation is the transformation type used to expose a source table from a direct connector as a transformation view. use it when analyticscreator should read from an existing database object through a direct database connector instead of staging the source through a normal import flow. function a direct-connector transformation links the transformation to one selected direct source. the source carries the connector, source schema, source name, and column metadata. when the transformation is saved or refreshed, analyticscreator builds the view definition from that selected source and keeps the transformation view aligned with the direct connector metadata. the direct source field is required for this transformation type, and the picker only lists sources that belong to direct connectors. this prevents the transformation from being saved against a normal import connector by mistake. use the filter field when only part of the direct source should be exposed through the transformation view. persist table and persist package can still be maintained when the direct view output needs to be materialized or included in a persistence package. access open an existing direct-connector transformation from the transformation list, or maintain it from the transformation editor where the transtype, direct source, and view controls are shown. direct-connector transformations are usually tied to direct-source conversion and maintenance workflows rather than selected as a standard transformation wizard type. how to access navigation tree schema -> transformations -> open a direct-connector transformation toolbar etl -> list -> transformations diagram open an existing direct-connector transformation node from the architecture diagram when present visual element transformation editor -> transtype / direct source / view tab screen overview id property description 1 name transformation name used for the generated direct-source view. 2 schema schema where the direct-connector transformation is maintained. 3 transtype identifies the transformation as a direct transformation and switches the editor to direct-source behavior. 4 direct source required source selection. the list contains sources from direct connectors and is used to generate the transformation view. 5 view tab shows the generated view definition for the selected direct source after the transformation is saved or refreshed. 6 filter optional row filter applied to the generated direct-source view. 7 having available expression field for transformation logic that needs post-aggregation filtering. 8 rename grid old column name and new column name rows used when direct-source column names need to be mapped after a source change. 9 persist table optional persisted-result table name for materializing the direct-source view output. 10 persist package optional persistence package that can include the direct-connector transformation output. related topics datamart transformation external transformation manual transformation union transformation previous script transformation nextdatamart transformation"}
,{"id":386692502716,"name":"Datamart transformation","type":"topic","path":"/docs/reference/entity-types/transformation-types/entity-types-transformation-types-datamart-transformation","breadcrumb":"Reference › Entity types › Transformation types › Datamart transformation","description":"","searchText":"reference entity types transformation types datamart transformation overview datamart transformation is the transformation type used for data mart interface views. use it to expose prepared transformation output through the data mart layer, where stars, facts, dimensions, and model-facing structures need their own generated view. function a datamart transformation is normally created and maintained by analyticscreator from data mart configuration instead of being selected as a normal new transformation type. when a source transformation is assigned to a star or model-facing structure, analyticscreator can create the data mart view that presents that output in the target data mart schema. the generated view uses the configured star transformation name, the selected data mart schema, the source output columns, and any star-level filter. this keeps the data warehouse transformation logic separate from the presentation view that is consumed by the data mart. when an existing datamart transformation is opened, the editor focuses on the view tab and keeps the transformation type locked. structural changes are made in the source transformation and data mart configuration, then the data mart transformation is regenerated or refreshed. access open an existing datamart transformation from the transformation list, or manage its source through the data mart area where stars and models are maintained. it is not intended as a direct choice in the standard new transformation wizard. how to access navigation tree schema -> transformations -> open a datamart transformation toolbar etl -> list -> transformations or data mart -> list -> stars / models diagram open an existing datamart transformation node from the architecture diagram when present visual element transformation editor -> transtype / view tab screen overview id property description 1 name shows the generated datamart transformation name, usually aligned with the star-facing view name. 2 schema shows the data mart schema where the interface view is maintained. 3 transtype identifies the transformation as a datamart transformation and keeps the type locked for generated data mart views. 4 hist type shows the historization behavior inherited from the source transformation used for the data mart view. 5 view tab displays the generated view definition that presents the source output in the data mart schema. 6 persist table shown as read-only because the data mart view is generated from source and star settings. 7 persist package shown as read-only for this generated view type. 8 tables the table definition is controlled by the source transformation and data mart assignment rather than edited directly here. 9 columns columns come from the source output selected for the data mart view. 10 references relationships are maintained through the source transformation and data mart model configuration. 11 star / model configuration defines the data mart context, view name, and optional filter used to generate the datamart transformation. 12 create in dwh generates or refreshes the data mart interface view in the data warehouse after the underlying configuration is saved. related topics direct-connector transformation external transformation manual transformation regular transformation previous direct-connector transformation nextunion transformation"}
,{"id":386692502722,"name":"Union transformation","type":"topic","path":"/docs/reference/entity-types/transformation-types/entity-types-transformation-types-union-transformation","breadcrumb":"Reference › Entity types › Transformation types › Union transformation","description":"","searchText":"reference entity types transformation types union transformation overview union transformation is the transformation type used to combine rows from multiple compatible tables into one transformation output. use it when several inputs share the same business structure and should be delivered as one aligned result. function a union transformation stores the transformation name, schema, historization setting, participating tables, output-column layout, optional star and predefined-transformation metadata, and persistence settings. the editor focuses on the tables and columns grids because the main task is aligning multiple table inputs into one output structure. the first table acts as the reference structure for the union. its output columns define the column names and sequence used by the other tables. when another table sequence is selected, analyticscreator keeps its column list aligned with the first table and removes column entries that no longer exist in the reference structure. use table seqnr to switch the column grid between the union members. for non-reference tables, fill columns helps match the aligned column names to the selected table by column name or friendly name. use the table-level union all, distinct, and filter statement fields to control how individual inputs participate in the combined result. use persist table and persist package when the union output should also be materialized through a persistence package. access create a union transformation from the transformation wizard by selecting union, or open an existing one from the transformation list. union transformations can also be opened from the architecture diagram when the transformation is shown there. how to access navigation tree schema -> transformations -> open a union transformation toolbar etl -> new -> new transformation or etl -> list -> transformations diagram open an existing union transformation node from the architecture diagram when present visual element transformation editor -> transtype / tables / table seqnr / columns screen overview id property description 1 name transformation name used for the combined union output. 2 schema schema where the union transformation is maintained. 3 transtype identifies the transformation as union and switches the editor to sequence-based column alignment. 4 hist type defines the historization behavior expected from the combined output. 5 tables lists the participating tables and their sequence numbers in the union. 6 table seqnr selects which table sequence is currently shown in the column grid. 7 columns defines and aligns the output-column list for the selected table sequence. 8 column name business column name that must remain aligned across the union members. 9 reference source column selected for the aligned output column in the current table sequence. 10 union all controls whether the table input keeps duplicate rows when it participates in the union. 11 distinct controls distinct handling for a table input in the union. 12 filter statement optional table-level filter applied to a participating union input. 13 fill columns matches aligned column names to source columns for the selected non-reference table sequence. 14 persist table / persist package optional persistence settings used when the union output should be materialized. 15 save stores the union tables, aligned column layout, table-level options, metadata, and persistence settings. 16 create in dwh creates or refreshes the union transformation in the data warehouse after the definition is saved. related topics direct-connector transformation external transformation regular transformation script transformation previous datamart transformation nextexternal transformation"}
,{"id":386692502718,"name":"External transformation","type":"topic","path":"/docs/reference/entity-types/transformation-types/entity-types-transformation-types-external-transformation","breadcrumb":"Reference › Entity types › Transformation types › External transformation","description":"","searchText":"reference entity types transformation types external transformation overview external transformation is the transformation type used when the transformation result is produced by an external ssis package. use it to represent data that is created outside the normal transformation view builder while still keeping the result visible, documented, and connected to analyticscreator packages. function an external transformation connects a transformation name, schema, result-table setting, and ssis package. analyticscreator maintains the metadata around the transformation and package, while the actual data load is handled by the external package. when this type is selected, the editor switches from view-definition work to package-result work. the view tab is hidden, the normal persist labels change to result table and ssis package, and the tables grid is used to identify the tables involved in the external package. use result table when the external package should create or maintain a table with the transformation result. use is output table in the tables grid when one of the assigned tables represents the output produced by the package. access create an external transformation from the transformation wizard by selecting external, or open an existing one from the transformation list. external transformation packages are also visible under the packages area, where package membership and execution behavior can be maintained. how to access navigation tree schema -> transformations -> open an external transformation toolbar etl -> new -> new transformation or etl -> list -> transformations diagram open an existing external transformation node from the architecture diagram when present visual element transformation editor -> transtype / result table / ssis package screen overview id property description 1 name transformation name used to identify the external package result in analyticscreator. 2 schema schema where the external transformation and its optional result table are maintained. 3 transtype identifies the transformation as an external transformation and switches the editor to package-result behavior. 4 hist type defines how the result table is treated when the external package produces historized or current-state output. 5 result table controls whether analyticscreator maintains a result table for the external package output. 6 ssis package package name used to run or organize the external transformation. the wizard requires this value for external transformations. 7 tables enabled grid for assigning source, helper, or result tables that are part of the external package workflow. 8 is output table marks the table row that represents the output produced by the external package. 9 view tab hidden for external transformations because the transformation logic is handled by the external package rather than edited as a view definition. 10 save stores the transformation metadata, result-table setting, package assignment, and related table information. 11 create in dwh refreshes the warehouse-side metadata for the external transformation and its result table. related topics datamart transformation direct-connector transformation script transformation union transformation previous union transformation nexttransformation historization types"}
,{"id":383509340361,"name":"Transformation historization types","type":"subsection","path":"/docs/reference/entity-types/transformation-historization-types","breadcrumb":"Reference › Entity types › Transformation historization types","description":"","searchText":"reference entity types transformation historization types transformation historization types define how a transformation handles time-dependent data and historical states. use this section to understand the available historization options for transformations and select the appropriate behavior for your modeling scenario. available historization types none use this historization type when only the current state of the transformation output is required. no historical state tracking simplest execution behavior suitable for current-state transformations open none snapshot use this historization type when transformation output should be evaluated for specific snapshot dates. supports point-in-time views useful for historized transformation logic can be used with snapshot dimensions open snapshot fullhist use this historization type when the full historical state of the transformation output must remain accessible. tracks historical states across time suitable for full historization scenarios useful when change history must remain queryable open fullhist snapshothist snapshothist is a transformation historization type for transformations that should be evaluated at predefined snapshot dates while still keeping a history-aware transformation result. use it when the output must... open snapshothist actualonly actualonly is a transformation historization type for transformations that should return only the currently valid result. use it when the output must reflect the actual business state without keeping a separate... open actualonly how to choose a historization type use none when only current-state output is needed use snapshot when data should be viewed at selected points in time use fullhist when the full historical output of the transformation must be preserved key takeaway transformation historization types control whether a transformation returns only current data, snapshot-based data, or fully historized output. previous external transformation nextfullhist"}
,{"id":386676752596,"name":"FullHist","type":"topic","path":"/docs/reference/entity-types/transformation-historization-types/entity-types-transformation-historization-types-fullhist","breadcrumb":"Reference › Entity types › Transformation historization types › FullHist","description":"","searchText":"reference entity types transformation historization types fullhist overview fullhist is a transformation historization type for transformations that must preserve the complete historical result. use it when downstream analysis needs to understand how the transformation output changed over time, not only the current state. function when fullhist is selected, analyticscreator treats the transformation output as a time-aware result. the generated result can carry its own history identity and validity window so each historical version of the transformation output remains distinguishable. fullhist is useful when the transformation combines historized tables and the business result must keep point-in-time consistency. table join history settings determine whether joined rows follow the main record's validity period or contribute their own full timeline to the result. fullhist is not a snapshot mode. snapshot selection remains unavailable because the output is generated as a continuous historical result rather than a result for predefined snapshot dates. access select fullhist while creating a transformation in the transformation wizard, or change it later in the transformation editor through the hist type field. how to access navigation tree schema -> transformations -> open a transformation toolbar etl -> list -> transformations or etl -> new -> new transformation diagram architecture -> add -> transformation or open an existing transformation node visual element transformation wizard -> historizing type or transformation editor -> hist type screen overview id property description 1 type selects the transformation type in the creation wizard. 2 schema assigns the transformation to the schema where it will be maintained. 3 name stores the transformation name shown in the tree, list, and generated output. 4 historizing type select fullhist here when the transformation result must keep a complete historical timeline. 5 main table defines the primary table used by the transformation wizard. 6 table joinhisttype controls how joined history is read. in fullhist scenarios, this setting determines how joined rows participate in the historical result. 7 hist type shows and edits the historization behavior on an existing transformation. 8 tables lists the source or intermediate tables used by the transformation. 9 columns maintains the output columns and expressions for the historical transformation result. 10 references maintains joins and table relationships used to produce the transformation output. 11 snapshot group / snapshot these fields are unavailable for fullhist because the result is not limited to predefined snapshot dates. 12 create in dwh generates or refreshes the transformation result in the data warehouse after the transformation is saved. related topics actualonly none snapshot snapshothist previous transformation historization types nextsnapshot"}
,{"id":386676752598,"name":"Snapshot","type":"topic","path":"/docs/reference/entity-types/transformation-historization-types/entity-types-transformation-historization-types-snapshot","breadcrumb":"Reference › Entity types › Transformation historization types › Snapshot","description":"","searchText":"reference entity types transformation historization types snapshot overview snapshot is a transformation historization type for transformations that should be evaluated at predefined snapshot dates. use it when the result must show the business state at selected reporting cut-off points without maintaining a continuous transformation-level history timeline. function when snapshot is selected, analyticscreator builds the transformation result for the snapshot dates or snapshot groups assigned to the transformation. the result is organized around those predefined points in time instead of carrying its own full history period. this is useful for point-in-time reporting, recurring business snapshots, and fact-style outputs where each row should reflect the state that was valid for a selected snapshot date. snapshot selection enables the snapshot group and snapshot fields in the transformation editor. when tables are added to the transformation under this mode, the default join handling keeps the full joined history available so analyticscreator can resolve the correct rows for each selected snapshot date. access select snapshot while creating a transformation in the transformation wizard when it is available in the historizing type list, or change it later in the transformation editor through the hist type field. how to access navigation tree schema -> transformations -> open a transformation toolbar etl -> list -> transformations or etl -> new -> new transformation diagram architecture -> add -> transformation or open an existing transformation node visual element transformation wizard -> historizing type or transformation editor -> hist type screen overview id property description 1 type selects the transformation type in the creation wizard. 2 schema assigns the transformation to the schema where it will be maintained. 3 name stores the transformation name shown in the tree, list, and generated output. 4 historizing type select snapshot here when the transformation result should be calculated for selected snapshot dates. 5 main table defines the primary table used by the transformation wizard. 6 table joinhisttype controls how joined history is read. with snapshot, newly added tables default to full-history participation for point-in-time evaluation. 7 hist type shows and edits the historization behavior on an existing transformation. 8 tables lists the source or intermediate tables used by the snapshot transformation. 9 columns maintains the output columns and expressions for the snapshot result. 10 references maintains joins and table relationships used to produce the transformation output. 11 snapshot group / snapshot assigns the snapshot groups or individual snapshots that define the reporting dates for this transformation. 12 create in dwh generates or refreshes the transformation result in the data warehouse after the transformation is saved. related topics actualonly fullhist none snapshothist previous fullhist nextsnapshothist"}
,{"id":386676752599,"name":"SnapshotHist","type":"topic","path":"/docs/reference/entity-types/transformation-historization-types/entity-types-transformation-historization-types-snapshothist","breadcrumb":"Reference › Entity types › Transformation historization types › SnapshotHist","description":"","searchText":"reference entity types transformation historization types snapshothist overview snapshothist is a transformation historization type for transformations that should be evaluated at predefined snapshot dates while still keeping a history-aware transformation result. use it when the output must show selected reporting cut-off points and preserve the historical context of those results. function when snapshothist is selected, analyticscreator builds the transformation result for the snapshot dates or snapshot groups assigned to the transformation. unlike snapshot, the result also keeps transformation-owned history information so each point-in-time result can be handled as part of a historical timeline. this is useful for dimension-style or history-aware snapshot outputs where consumers need both a recurring snapshot view and a clear validity context for the generated result. snapshothist enables the snapshot group and snapshot fields in the transformation editor. the table join-history setting remains important because it controls how joined table history participates when the snapshot-aware historical result is built. access select snapshothist while creating a transformation in the transformation wizard when it is available in the historizing type list, or change it later in the transformation editor through the hist type field. how to access navigation tree schema -> transformations -> open a transformation toolbar etl -> list -> transformations or etl -> new -> new transformation diagram architecture -> add -> transformation or open an existing transformation node visual element transformation wizard -> historizing type or transformation editor -> hist type screen overview id property description 1 type selects the transformation type in the creation wizard. 2 schema assigns the transformation to the schema where it will be maintained. 3 name stores the transformation name shown in the tree, list, and generated output. 4 historizing type select snapshothist here when selected snapshot dates should also preserve a history-aware transformation result. 5 main table defines the primary table used by the transformation wizard. 6 table joinhisttype controls how joined history is read. review this setting so joined rows match the intended snapshot and history behavior. 7 hist type shows and edits the historization behavior on an existing transformation. 8 tables lists the source or intermediate tables used by the snapshot-historical transformation. 9 columns maintains the output columns and expressions for the snapshot-historical result. 10 references maintains joins and table relationships used to produce the transformation output. 11 snapshot group / snapshot assigns the snapshot groups or individual snapshots that define the reporting dates for this transformation. 12 create in dwh generates or refreshes the transformation result in the data warehouse after the transformation is saved. related topics actualonly fullhist none snapshot previous snapshot nextactualonly"}
,{"id":386676752595,"name":"ActualOnly","type":"topic","path":"/docs/reference/entity-types/transformation-historization-types/entity-types-transformation-historization-types-actualonly","breadcrumb":"Reference › Entity types › Transformation historization types › ActualOnly","description":"","searchText":"reference entity types transformation historization types actualonly overview actualonly is a transformation historization type for transformations that should return only the currently valid result. use it when the output must reflect the actual business state without keeping a separate transformation-level history timeline. function when actualonly is selected, analyticscreator builds the transformation result for the current valid data only. the output does not add its own generated history key, validity-start field, or validity-end field for the transformation result. this is useful for transformations that combine historized source data but only need the current row set in the final result. when tables are added to the transformation under this mode, the default join handling follows the actual row from the joined history rather than reproducing the full history timeline. actualonly is not a snapshot mode. snapshot selection remains unavailable because the transformation is not restricted to predefined snapshot dates. access select actualonly while creating a transformation in the transformation wizard, or change it later in the transformation editor through the hist type field. how to access navigation tree schema -> transformations -> open a transformation toolbar etl -> list -> transformations or etl -> new -> new transformation diagram architecture -> add -> transformation or open an existing transformation node visual element transformation wizard -> historizing type or transformation editor -> hist type screen overview id property description 1 type selects the transformation type in the creation wizard. 2 schema assigns the transformation to the schema where it will be maintained. 3 name stores the transformation name shown in the tree, list, and generated output. 4 historizing type select actualonly here when creating a transformation that should return only the current valid result. 5 main table defines the primary table used by the transformation wizard. 6 table joinhisttype controls how joined history is read. with actualonly, newly added tables default to the currently valid row. 7 hist type shows and edits the historization behavior on an existing transformation. 8 tables lists the source or intermediate tables used by the transformation. 9 columns maintains the output columns and expressions for the current-result transformation. 10 references maintains joins and table relationships used to produce the transformation output. 11 snapshot group / snapshot these fields are unavailable for actualonly because the output is not generated for predefined snapshot dates. 12 create in dwh generates or refreshes the transformation result in the data warehouse after the transformation is saved. related topics fullhist none snapshot snapshothist previous snapshothist nextnone"}
,{"id":386676752597,"name":"None","type":"topic","path":"/docs/reference/entity-types/transformation-historization-types/entity-types-transformation-historization-types-none","breadcrumb":"Reference › Entity types › Transformation historization types › None","description":"","searchText":"reference entity types transformation historization types none overview none is a transformation historization type for transformations that do not add transformation-level history handling. use it when the transformation result is a regular calculated output and does not need its own historical timeline or snapshot-based view. function when none is selected, analyticscreator generates the transformation without adding historization information to the transformation result. the output is maintained as the transformation definition describes it, without a transformation-owned history identity, validity window, or snapshot marker. this option is appropriate for simple current-state transformations, helper transformations, or logic where history is already handled upstream and should not be repeated at the transformation level. none also keeps snapshot selection unavailable. when tables are added to the transformation under this mode, the default join handling is an ordinary non-history join. access select none while creating a transformation in the transformation wizard, or change it later in the transformation editor through the hist type field. how to access navigation tree schema -> transformations -> open a transformation toolbar etl -> list -> transformations or etl -> new -> new transformation diagram architecture -> add -> transformation or open an existing transformation node visual element transformation wizard -> historizing type or transformation editor -> hist type screen overview id property description 1 type selects the transformation type in the creation wizard. 2 schema assigns the transformation to the schema where it will be maintained. 3 name stores the transformation name shown in the tree, list, and generated output. 4 historizing type select none here when the transformation should not add its own history behavior. 5 main table defines the primary table used by the transformation wizard. 6 table joinhisttype controls how joined history is read. with none, newly added tables default to ordinary non-history joins. 7 hist type shows and edits the historization behavior on an existing transformation. 8 tables lists the source or intermediate tables used by the transformation. 9 columns maintains the output columns and expressions for the transformation result. 10 references maintains joins and table relationships used to produce the transformation output. 11 snapshot group / snapshot these fields are unavailable for none because the result is not generated for predefined snapshot dates. 12 create in dwh generates or refreshes the transformation result in the data warehouse after the transformation is saved. related topics actualonly fullhist snapshot snapshothist previous actualonly nextjoin historization types"}
,{"id":383509340362,"name":"Join historization types","type":"subsection","path":"/docs/reference/entity-types/join-historization-types","breadcrumb":"Reference › Entity types › Join historization types","description":"","searchText":"reference entity types join historization types join historization types define how joins behave when historized data is involved. use this section to understand how analyticscreator resolves joins between historized structures and which time-dependent behavior is applied in each case. available join historization types none use this join historization type when no historization-aware join behavior is required. no historical validity handling suitable for non-historized joins uses standard join logic open none actual use this join historization type when only the current valid state of the joined data should be considered. current-state join behavior ignores historical versions suitable for active-record scenarios open actual full use this join historization type when the join should consider the full historical range of the participating tables. full historical join behavior includes historical validity logic suitable for complete history analysis open full historical_from use this join historization type when the join should be aligned using the historical start of validity. based on valid-from logic useful for time-entry alignment supports start-point-based historized joins open historical_from historical_to use this join historization type when the join should be aligned using the historical end of validity. based on valid-to logic useful for time-exit alignment supports end-point-based historized joins open historical_to historical_from historical_from is a join historization type used in the transformation editor for joined tables. open historical_from historical_to historical_to is a join historization type used in the transformation editor for joined tables. open historical_to how to choose a join historization type use none when no historization-aware join handling is required use actual when only the current valid state should be joined use full when full historical validity should be respected use historical_from when joins should align on the start of validity use historical_to when joins should align on the end of validity key takeaway join historization types define how analyticscreator applies time-dependent validity logic when joining historized data structures. previous none nextnone"}
,{"id":386676751592,"name":"None","type":"topic","path":"/docs/reference/entity-types/join-historization-types/entity-types-join-historization-types-none","breadcrumb":"Reference › Entity types › Join historization types › None","description":"","searchText":"reference entity types join historization types none overview none is a join historization type used in the transformation editor for joined tables. function none uses a standard join only, regardless of data historization. access this join historization type is available in the transformation detail page for the joinhisttype field of joined tables. how to access navigation tree transformations -> open a transformation -> definition tab toolbar not confirmed. diagram not applicable. visual element transformation tables grid -> joinhisttype screen overview the none join historization type is selected in the detailtransformations page, in the transformation tables grid under the joinhisttype column. id property description 1 definition tab the join historization type is configured in the transformation definition area. 2 transformation tables grid lists the source and joined tables that participate in the transformation. 3 joinhisttype dropdown column used to select the join historization type for each joined table. 4 none represents a non-historized table and uses a standard join only, regardless of data historization. 5 default assignment when a transformation table row is created for transformation historization type 5, and in the default creation branch, the code sets joinhisttypeid to 1, which is none. related topics actual full historical_from historical_to previous join historization types nextactual"}
,{"id":386676751588,"name":"Actual","type":"topic","path":"/docs/reference/entity-types/join-historization-types/entity-types-join-historization-types-actual","breadcrumb":"Reference › Entity types › Join historization types › Actual","description":"","searchText":"reference entity types join historization types actual overview actual is a join historization type used in the transformation editor for joined tables. function actual joins the currently valid (current) data row from the joined table. access this join historization type is available in the transformation detail page for the joinhisttype field of joined tables. how to access navigation tree transformations -> open a transformation -> definition tab toolbar not confirmed. diagram not applicable. visual element transformation tables grid -> joinhisttype screen overview the actual join historization type is selected in the detailtransformations page, in the transformation tables grid under the joinhisttype column. id property description 1 definition tab the join historization type is configured in the transformation definition area. 2 transformation tables grid lists the source and joined tables that participate in the transformation. 3 joinhisttype dropdown column used to select the join historization type for each joined table. 4 actual selects the most recent (currently valid) data row from the joined table. 5 default assignment when a transformation table row is created for transformation historization types 1, 2, or 4, the code defaults joinhisttypeid to 2, which is actual. related topics full historical_from historical_to none previous none nextfull"}
,{"id":386676751589,"name":"Full","type":"topic","path":"/docs/reference/entity-types/join-historization-types/entity-types-join-historization-types-full","breadcrumb":"Reference › Entity types › Join historization types › Full","description":"","searchText":"reference entity types join historization types full overview full is a join historization type used in the transformation editor for joined tables. function full reproduces the complete history from the joined table, including its generated history columns. access this join historization type is available in the transformation detail page for the joinhisttype field of joined tables. how to access navigation tree transformations -> open a transformation -> definition tab toolbar not confirmed. diagram not applicable. visual element transformation tables grid -> joinhisttype screen overview the full join historization type is selected in the detailtransformations page, in the transformation tables grid under the joinhisttype column. id property description 1 definition tab the join historization type is configured in the transformation definition area. 2 transformation tables grid lists the source and joined tables that participate in the transformation. 3 joinhisttype dropdown column used to select the join historization type for each joined table. 4 full reproduces the complete history from the joined table, including the generated history columns such as unique id, valid-from, and valid-to. 5 default assignment when a transformation table row is created for transformation historization type 3, the code defaults joinhisttypeid to 4, which is full. related topics actual historical_from historical_to none previous actual nexthistorical_from"}
,{"id":386676751590,"name":"Historical_from","type":"topic","path":"/docs/reference/entity-types/join-historization-types/entity-types-join-historization-types-historical-from","breadcrumb":"Reference › Entity types › Join historization types › Historical_from","description":"","searchText":"reference entity types join historization types historical_from overview historical_from is a join historization type used in the transformation editor for joined tables. function historical_from joins the row from the joined table that was valid at the main table's date_from. access this join historization type is available in the transformation detail page for the joinhisttype field of joined tables. how to access navigation tree transformations -> open a transformation -> definition tab toolbar not confirmed. diagram not applicable. visual element transformation tables grid -> joinhisttype screen overview the historical_from join historization type is selected in the detailtransformations page, in the transformation tables grid under the joinhisttype column. id property description 1 definition tab the join historization type is configured in the transformation definition area. 2 transformation tables grid lists the source and joined tables that participate in the transformation. 3 joinhisttype dropdown column used to select the join historization type for each joined table. 4 historical_from selects the row from the joined table that was valid at the main table's date_from. 5 runtime join condition the engine compares the main table date_from against the joined table valid-from and valid-to columns when joinhisttypeid = 3. 6 default assignment this value is not assigned automatically in the transformation-table creation switch; it must be selected explicitly when needed. related topics actual full historical_to none previous full nexthistorical_to"}
,{"id":386676751591,"name":"Historical_to","type":"topic","path":"/docs/reference/entity-types/join-historization-types/entity-types-join-historization-types-historical-to","breadcrumb":"Reference › Entity types › Join historization types › Historical_to","description":"","searchText":"reference entity types join historization types historical_to overview historical_to is a join historization type used in the transformation editor for joined tables. function historical_to joins the row from the joined table that was valid at the main table's date_to. access this join historization type is available in the transformation detail page for the joinhisttype field of joined tables. how to access navigation tree transformations -> open a transformation -> definition tab toolbar not confirmed. diagram not applicable. visual element transformation tables grid -> joinhisttype screen overview the historical_to join historization type is selected in the detailtransformations page, in the transformation tables grid under the joinhisttype column. id property description 1 definition tab the join historization type is configured in the transformation definition area. 2 transformation tables grid lists the source and joined tables that participate in the transformation. 3 joinhisttype dropdown column used to select the join historization type for each joined table. 4 historical_to selects the row from the joined table that was valid at the main table's date_to. 5 runtime join condition at runtime, joinhisttypeid = 5 compares the main table's date_to against the joined table history interval. 6 default assignment this type is not auto-assigned in the row-creation switch. for transformation historization type 5 and the default branch, the code sets joinhisttypeid to 1, so historical_to must be selected explicitly. related topics actual full historical_from none previous historical_from nextpackage types"}
,{"id":383509340363,"name":"Package types","type":"subsection","path":"/docs/reference/entity-types/package-types","breadcrumb":"Reference › Entity types › Package types","description":"","searchText":"reference entity types package types package types define how execution units are structured in analyticscreator and what role they play in data loading, historization, persisting, workflow orchestration, scripting, exports, and external processing. use this section to understand the available package types and choose the appropriate one for the execution pattern you want to implement. available package types import used to load data from source systems into the staging layer. supports source ingestion typical entry point for execution used in generated loading workflows open import historization used to execute historization logic and manage validity-based data changes over time. supports change tracking typical for persistent staging used with historized tables open historization persisting used to materialize transformation results physically for performance or architectural reasons. stores generated output physically useful for complex transformations supports persisted execution patterns open persisting workflow used to orchestrate execution order and dependencies across multiple processing steps. coordinates execution flow handles dependencies between packages typical orchestration entry point open workflow script used when execution logic is implemented as a script instead of a standard generated package flow. script-based execution behavior useful for special-case processing supports custom runtime logic open script exports used to move processed data or generated outputs to downstream targets. supports outbound data movement useful for interface and delivery scenarios can target external analytical or operational systems open exports external used when execution is handled outside the standard analyticscreator-generated package flow. external execution integration useful for non-standard processing scenarios separates generated logic from external runtime behavior open external how to choose a package type use import for source-to-staging data loading use historization for change tracking and validity-based updates use persisting when transformation results should be materialized physically use workflow to orchestrate package dependencies and execution order use script for script-based processing logic use exports for outbound delivery to downstream targets use external when execution is managed outside the standard generated package flow key takeaway package types define how execution is structured in analyticscreator, from loading and historization to workflow orchestration, scripting, exports, and external processing. previous historical_to nextimport"}
,{"id":386711825597,"name":"Import","type":"topic","path":"/docs/reference/entity-types/package-types/entity-types-package-types-import","breadcrumb":"Reference › Entity types › Package types › Import","description":"","searchText":"reference entity types package types import overview import is a package type used for packages that group import table references in analyticscreator. function the imp package type identifies packages that own entries in cfg.imp_table_references and organize import definitions for source objects and target tables. access this package type is shown in the package detail page as the read-only package type field, and import packages are listed in the navigation tree under the packages branch. how to access navigation tree packages -> import -> open a package toolbar not confirmed. diagram not applicable. visual element detailpackages -> package type screen overview the import package type is shown in the detailpackages page. for this type, the content grid lists import references, add content opens the import assistant, and double-clicking a content row opens the import editor. id property description 1 package name name of the package shown in the package detail page. 2 package type read-only field in detailpackages that displays the package type description, which is import package for this type. 3 manually created checkbox indicating whether the package was created manually. 4 external launched checkbox labeled external launched. in code it binds to donotrun; when it is not selected, the manual-dependencies grid can be shown for this package. 5 description optional package description shown in the package detail page. 6 content grid listing import references as source -> table values for the package. 7 add content opens the import assistant to create a new imp_table_reference for this package. 8 import detail double-clicking a content row opens detailimp.xaml to edit the selected import. 9 manual dependencies dependency grid shown for non-workflow packages so related package dependencies can be refreshed and reviewed. related topics exports external historization persisting previous package types nexthistorization"}
,{"id":386711825596,"name":"Historization","type":"topic","path":"/docs/reference/entity-types/package-types/entity-types-package-types-historization","breadcrumb":"Reference › Entity types › Package types › Historization","description":"","searchText":"reference entity types package types historization overview historization is a package type used for packages that group historization table references in analyticscreator. function the hist package type identifies packages that own entries in cfg.hist_table_references and organize historization processing for tables. access this package type is shown in the package detail page as the read-only package type field, and historization packages are listed in the navigation tree under the packages branch. how to access navigation tree packages -> historization -> open a package toolbar not confirmed. diagram not applicable. visual element detailpackages -> package type screen overview the historization package type is shown in the detailpackages page. for this type, the content grid lists historization references, add content opens the historization assistant, and double-clicking a content row opens the historization editor. id property description 1 package name name of the package shown in the package detail page. 2 package type read-only field in detailpackages that displays the package type description, which is historizing package for this type. 3 manually created checkbox indicating whether the package was created manually. 4 external launched checkbox labeled external launched. in code it binds to donotrun; when it is not selected, the manual-dependencies grid can be shown for this package. 5 description optional package description shown in the package detail page. 6 content grid listing historization references as hist_table -> table values for the package. 7 add content opens the historization assistant to create a new hist_table_reference for this package. 8 historization detail double-clicking a content row opens list historizations to edit the selected historization. 9 manual dependencies dependency grid shown for non-workflow packages so related package dependencies can be refreshed and reviewed. related topics exports external import persisting previous import nextpersisting"}
,{"id":386711825598,"name":"Persisting","type":"topic","path":"/docs/reference/entity-types/package-types/entity-types-package-types-persisting","breadcrumb":"Reference › Entity types › Package types › Persisting","description":"","searchText":"reference entity types package types persisting overview persisting is a package type used for packages that group persisting table references in analyticscreator. function the pers package type identifies packages that own entries in cfg.pers_table_references and organize persisting definitions for transformations and their persist tables. access this package type is shown in the package detail page as the read-only package type field, and persisting packages are listed in the navigation tree under the packages branch. how to access navigation tree packages -> persisting -> open a package toolbar not confirmed. diagram not applicable. visual element detailpackages -> package type screen overview the persisting package type is shown in the detailpackages page. for this type, the content grid lists persisting references, add content opens the persisting assistant, and double-clicking a content row opens the persisting editor. id property description 1 package name name of the package shown in the package detail page. 2 package type read-only field in detailpackages that displays the package type description, which is persisting package for this type. 3 manually created checkbox indicating whether the package was created manually. 4 external launched checkbox labeled external launched. in code it binds to donotrun; when it is not selected, the manual-dependencies grid can be shown for this package. 5 description optional package description shown in the package detail page. 6 content grid listing persisting references as schema.transformation -> persist_table values for the package. 7 add content opens the persisting assistant to create a new pers_table_reference for this package. 8 persisting detail double-clicking a content row opens detailpers.xaml to edit the selected persisting definition. 9 manual dependencies dependency grid shown for non-workflow packages so related package dependencies can be refreshed and reviewed. related topics exports import script workflow previous historization nextworkflow"}
,{"id":386711825600,"name":"Workflow","type":"topic","path":"/docs/reference/entity-types/package-types/entity-types-package-types-workflow","breadcrumb":"Reference › Entity types › Package types › Workflow","description":"","searchText":"reference entity types package types workflow overview workflow is a package type used for packages that orchestrate the execution of other packages in analyticscreator. function the flow package type identifies workflow packages that own entries in cfg.workflow_package_references and define which child packages run, whether errors interrupt execution, and how retries are handled. access this package type is shown in the package detail page as the read-only package type field, and workflow packages are listed in the navigation tree under the packages branch. how to access navigation tree packages -> workflow -> open a package toolbar not confirmed. diagram not applicable. visual element detailpackages -> package type screen overview the workflow package type is shown in the detailpackages page. for this type, the content grid lists child packages and workflow execution settings, while the dependency grid is hidden. id property description 1 package name name of the package shown in the package detail page. 2 package type read-only field in detailpackages that displays the package type description, which is workflow package for this type. 3 manually created checkbox indicating whether the package was created manually. 4 process olap cube in package for workflow packages, the fourth checkbox label changes from external launched to process olap cube in package. 5 description optional package description shown in the package detail page. 6 content grid listing child packages included in the workflow. 7 include controls whether the child package is included in the workflow. when no references exist yet, packages are initialized as included in the main workflow list. 8 interrupt on error controls whether an error in the child package interrupts the workflow execution. 9 retry attempts number of retry attempts for the child package. existing references default to 1 when null. 10 retry interval (min) retry interval in minutes for the child package. existing references default to 0 in the page model, while repository cleanup scripts normalize nulls. related topics external import persisting script previous persisting nextscript"}
,{"id":386711825599,"name":"Script","type":"topic","path":"/docs/reference/entity-types/package-types/entity-types-package-types-script","breadcrumb":"Reference › Entity types › Package types › Script","description":"","searchText":"reference entity types package types script overview script is a package type used for script-launching packages in analyticscreator. function the script package type identifies packages used to launch script-based transformations and is used where the transformation assistant filters package selections to packagetypeid = 6. access this package type is shown in the package detail page as the read-only package type field, and script packages are listed in the navigation tree under the packages branch. how to access navigation tree packages -> script -> open a package toolbar not confirmed. diagram not applicable. visual element detailpackages -> package type screen overview the script package type is shown in the detailpackages page. for package types above 4, the content grid is hidden and the page shows the manual-dependencies grid instead. id property description 1 package name name of the package shown in the package detail page. 2 package type read-only field in detailpackages that displays the package type description, which is script launching package for this type. 3 manually created checkbox indicating whether the package was created manually. 4 external launched checkbox labeled external launched. in code it binds to donotrun; when it is not selected, the manual-dependencies grid can be shown for this package. 5 description optional package description shown in the package detail page. 6 manual dependencies dependency grid shown for non-workflow packages so related package dependencies can be refreshed and reviewed. 7 script package filter in the transformation assistant, script-based transformations bind the package selector to packages where packagetypeid = 6. related topics external import persisting workflow previous workflow nextexports"}
,{"id":386711825594,"name":"Exports","type":"topic","path":"/docs/reference/entity-types/package-types/entity-types-package-types-exports","breadcrumb":"Reference › Entity types › Package types › Exports","description":"","searchText":"reference entity types package types exports overview exports is a package type used for export packages in analyticscreator. function the export package type identifies packages that are used by export definitions. access this package type is shown in the package detail page as the read-only package type field, and export detail pages only list packages of this type in the package selector. how to access navigation tree packages -> open a package toolbar not confirmed. diagram not applicable. visual element detailpackages -> package type screen overview the exports package type is shown in the detailpackages page in the read-only package type field, and the detailexport page only offers packages whose packagetypeid is 7. id property description 1 package name name of the package shown in the package detail page. 2 package type read-only field in detailpackages that displays the package type description, which is export package for this type. 3 manually created checkbox indicating whether the package was created manually. 4 external launched checkbox that controls whether the package is launched externally. 5 description optional package description shown in the package detail page. 6 export package filter the detailexport page binds its package selector to packages where packagetypeid = 7, so only export packages can be chosen. related topics external historization import persisting previous script nextexternal"}
,{"id":386711825595,"name":"External","type":"topic","path":"/docs/reference/entity-types/package-types/entity-types-package-types-external","breadcrumb":"Reference › Entity types › Package types › External","description":"","searchText":"reference entity types package types external overview external is a package type used for external transformation packages in analyticscreator. function the trans package type identifies external ssis packages that are assigned to external transformations. access this package type is shown in the package detail page as the read-only package type field, and the transformation assistant filters the ssis package selector to packages whose packagetypeid is 5. how to access navigation tree packages -> open a package toolbar not confirmed. diagram not applicable. visual element detailpackages -> package type screen overview the external package type is shown in the detailpackages page in the read-only package type field, and the transformation assistant only lists packages of this type when the transformation type is external ssis. id property description 1 package name name of the package shown in the package detail page. 2 package type read-only field in detailpackages that displays the package type description, which is external transformation package for this type. 3 manually created checkbox indicating whether the package was created manually. new packages default to manually created when packagetypeid = 5. 4 external launched checkbox that controls whether the package is launched externally. 5 description optional package description shown in the package detail page. 6 manual dependencies for package types above 4, the package detail page hides the content grid and shows the manual dependencies grid instead. 7 external ssis package filter in the transformation assistant, external ssis transformations bind the ssis package selector to packages where packagetypeid = 5. related topics exports historization import persisting previous exports nextsql script types"}
,{"id":383509396690,"name":"SQL script types","type":"subsection","path":"/docs/reference/entity-types/sql-script-types","breadcrumb":"Reference › Entity types › SQL script types","description":"","searchText":"reference entity types sql script types sql script types define when custom sql scripts are executed in analyticscreator and which phase of creation, workflow execution, deployment, or repository extension they belong to. use this section to understand the available sql script types and choose the correct execution point for custom sql logic. available sql script types pre-creation used to execute sql logic before object creation takes place. runs before creation steps useful for preparation logic supports setup before generated objects are created open pre-creation post-creation used to execute sql logic after object creation has completed. runs after creation steps useful for follow-up logic supports post-processing after generated objects exist open post-creation pre-workflow used to execute sql logic before a workflow or execution package starts. runs before workflow execution useful for preparation or cleanup logic supports workflow-specific setup open pre-workflow post-workflow used to execute sql logic after a workflow or execution package has finished. runs after workflow execution useful for validation or cleanup supports follow-up logic after processing open post-workflow pre-deployment used to execute sql logic before deployment starts. runs before deployment steps useful for environment preparation supports deployment-specific setup logic open pre-deployment post-deployment used to execute sql logic after deployment has completed. runs after deployment steps useful for finalization logic supports post-deployment adjustments open post-deployment repository extension used to extend or customize repository-related behavior with sql logic. repository-focused customization supports metadata extension scenarios useful for repository-specific enhancements open repository extension how to choose a sql script type use pre-creation or post-creation when the script belongs to object creation timing use pre-workflow or post-workflow when the script belongs to execution timing use pre-deployment or post-deployment when the script belongs to deployment timing use repository extension when the script is intended to extend repository behavior or metadata-related logic key takeaway sql script types define the lifecycle stage at which custom sql logic is executed in analyticscreator, from creation and workflow execution to deployment and repository extension. previous external nextpre-creation"}
,{"id":386708347128,"name":"Pre-creation","type":"topic","path":"/docs/reference/entity-types/sql-script-types/entity-types-sql-script-types-pre-creation","breadcrumb":"Reference › Entity types › SQL script types › Pre-creation","description":"","searchText":"reference entity types sql script types pre-creation overview pre-creation scripts are custom sql steps used to prepare the target environment before analyticscreator continues with database creation work. use this script type for setup logic that must be in place before the database structure is created, such as preparing required settings, creating supporting prerequisites, or applying environment-specific preparation steps. function use pre-creation when the sql logic belongs before database creation rather than after creation, before deployment, or during workflow execution. scripts in this group are ordered by sequence number and then by script name in the navigation tree. pre-creation uses the shared define script page. the editor stores the script type, script name, description, sequence number, inactive flag, and sql text. the package assignment grid is hidden for this type because package assignment is only shown for workflow script types. access the scripts branch contains a pre-creation scripts node. its context menu provides list pre-creation scripts and add pre-creation script, both preselecting the pre-creation script type. how to access navigation tree scripts -> pre-creation scripts -> list pre-creation scripts, or add pre-creation script toolbar scripts diagram not direct. use the scripts list or navigation tree. visual element define script -> script type -> pre-creation screen overview id property description 1 script type selects the sql script type. for this page the selected type is pre-creation. 2 name defines the script name. save validation requires a non-empty value. 3 description stores the optional script description shown in the script list. 4 sequence number controls ordering inside the pre-creation script group. a non-numeric value is rejected during validation. 5 inactive stores whether the script is disabled without deleting it. 6 original shows the editable sql script text. 7 parsed shows the macro-parsed preview of the sql script in a read-only field. 8 script contains the sql body. save validation requires a non-empty script. 9 cancel returns to the previous page without saving changes. 10 save validates the script fields, stores the sql script, and refreshes the navigation tree. list behavior list pre-creation scripts opens the script list already scoped to pre-creation scripts. the list can filter by script name, shows name, type, and description, and opens the define script page when a row is double-clicked. the new button opens a new script with pre-creation already selected. delete removes the selected script after confirmation. the up and down buttons swap sequence numbers only between scripts of the same script type. related topics post-creation post-deployment post-workflow pre-deployment previous sql script types nextpost-creation"}
,{"id":386708347125,"name":"Post-creation","type":"topic","path":"/docs/reference/entity-types/sql-script-types/entity-types-sql-script-types-post-creation","breadcrumb":"Reference › Entity types › SQL script types › Post-creation","description":"","searchText":"reference entity types sql script types post-creation overview post-creation scripts are custom sql steps that run after analyticscreator has completed the database creation phase. use this script type for follow-up adjustments that depend on the created database structure, such as applying environment-specific settings, adding supporting objects, or finalizing setup logic before later processing continues. function use post-creation for custom sql that must be applied immediately after database creation. scripts in this group are ordered by sequence number and then by script name in the navigation tree. post-creation uses the shared define script page. the editor stores the script type, script name, description, sequence number, inactive flag, and sql text. the package assignment grid is hidden for this type because package assignment is only shown for workflow script types. access the scripts branch contains a post-creation scripts node. its context menu provides list post-creation scripts and add post-creation script, both preselecting the post-creation script type. how to access navigation tree scripts -> post-creation scripts -> list post-creation scripts, or add post-creation script toolbar scripts diagram not direct. use the scripts list or navigation tree. visual element define script -> script type -> post-creation screen overview id property description 1 script type selects the sql script type. for this page the selected type is post-creation. 2 name defines the script name. save validation requires a non-empty value. 3 description stores the optional script description shown in the script list. 4 sequence number controls ordering inside the post-creation script group. a non-numeric value is rejected during validation. 5 inactive stores whether the script is disabled without deleting it. 6 original shows the editable sql script text. 7 parsed shows the macro-parsed preview of the sql script in a read-only field. 8 script contains the sql body. save validation requires a non-empty script. 9 cancel returns to the previous page without saving changes. 10 save validates the script fields, stores the sql script, and refreshes the navigation tree. list behavior list post-creation scripts opens the script list already scoped to post-creation scripts. the list can filter by script name, shows name, type, and description, and opens the define script page when a row is double-clicked. the new button opens a new script with post-creation already selected. delete removes the selected script after confirmation. the up and down buttons swap sequence numbers only between scripts of the same script type. related topics post-deployment post-workflow pre-creation pre-deployment previous pre-creation nextpre-workflow"}
,{"id":386708348090,"name":"Pre-workflow","type":"topic","path":"/docs/reference/entity-types/sql-script-types/entity-types-sql-script-types-pre-workflow","breadcrumb":"Reference › Entity types › SQL script types › Pre-workflow","description":"","searchText":"reference entity types sql script types pre-workflow overview pre-workflow scripts are custom sql steps that run before a workflow package starts its assigned package activities. use this script type for workflow-level preparation, such as initializing control data, preparing staging conditions, setting runtime values, or validating prerequisites before the workflow begins. function use pre-workflow when the sql logic belongs at the beginning of a workflow package rather than during deployment or after the workflow finishes. scripts in this group are ordered by sequence number and then by script name in the navigation tree. pre-workflow uses the shared define script page. the editor stores the script type, script name, description, sequence number, inactive flag, sql text, and workflow-package assignments. the package grid is visible for this type so the script can be assigned to the workflow packages where it should run. when workflow automation is generated, assigned pre-workflow scripts are grouped into an initial script step. the first package activities in the workflow wait for that step to complete before they start. access the scripts branch contains a pre-workflow scripts node. its context menu provides list pre-workflow scripts and add pre-workflow script, both preselecting the pre-workflow script type. how to access navigation tree scripts -> pre-workflow scripts -> list pre-workflow scripts, or add pre-workflow script toolbar scripts diagram not direct. use the scripts list or navigation tree. visual element define script -> script type -> pre-workflow screen overview id property description 1 script type selects the sql script type. for this page the selected type is pre-workflow. 2 name defines the script name. save validation requires a non-empty value. 3 description stores the optional script description shown in the script list. 4 sequence number controls ordering inside the pre-workflow script group. a non-numeric value is rejected during validation. 5 inactive stores whether the script is disabled without deleting it. 6 original shows the editable sql script text. 7 parsed shows the macro-parsed preview of the sql script in a read-only field. 8 script contains the sql body. save validation requires a non-empty script. 9 package lists workflow packages that can run this pre-workflow script. 10 run assigns the script to the selected workflow package. clicking the run column header toggles all visible assignments. 11 cancel returns to the previous page without saving changes. 12 save validates the script fields, stores the sql script, saves the workflow-package assignments, and refreshes the navigation tree. list behavior list pre-workflow scripts opens the script list already scoped to pre-workflow scripts. the list can filter by script name, shows name, type, and description, and opens the define script page when a row is double-clicked. the new button opens a new script with pre-workflow already selected. delete removes the selected script after confirmation. the up and down buttons swap sequence numbers only between scripts of the same script type. related topics post-creation post-deployment post-workflow pre-creation previous post-creation nextpost-workflow"}
,{"id":386708347127,"name":"Post-workflow","type":"topic","path":"/docs/reference/entity-types/sql-script-types/entity-types-sql-script-types-post-workflow","breadcrumb":"Reference › Entity types › SQL script types › Post-workflow","description":"","searchText":"reference entity types sql script types post-workflow overview post-workflow scripts are custom sql steps that run after a workflow package has completed its assigned package activities. use this script type for final workflow-level work, such as writing completion information, applying cleanup logic, or running sql that should wait until the workflow has finished. function use post-workflow when the sql logic belongs at the end of a workflow package rather than before the workflow starts or during deployment. scripts in this group are ordered by sequence number and then by script name in the navigation tree. post-workflow uses the shared define script page. the editor stores the script type, script name, description, sequence number, inactive flag, sql text, and workflow-package assignments. the package grid is visible for this type so the script can be assigned to the workflow packages where it should run. when workflow automation is generated, assigned post-workflow scripts are grouped into a final post-scripts step. that step waits for the last activities in the workflow package to complete before running the selected sql scripts. access the scripts branch contains a post-workflow scripts node. its context menu provides list post-workflow scripts and add post-workflow script, both preselecting the post-workflow script type. how to access navigation tree scripts -> post-workflow scripts -> list post-workflow scripts, or add post-workflow script toolbar scripts diagram not direct. use the scripts list or navigation tree. visual element define script -> script type -> post-workflow screen overview id property description 1 script type selects the sql script type. for this page the selected type is post-workflow. 2 name defines the script name. save validation requires a non-empty value. 3 description stores the optional script description shown in the script list. 4 sequence number controls ordering inside the post-workflow script group. a non-numeric value is rejected during validation. 5 inactive stores whether the script is disabled without deleting it. 6 original shows the editable sql script text. 7 parsed shows the macro-parsed preview of the sql script in a read-only field. 8 script contains the sql body. save validation requires a non-empty script. 9 package lists workflow packages that can run this post-workflow script. 10 run assigns the script to the selected workflow package. clicking the run column header toggles all visible assignments. 11 cancel returns to the previous page without saving changes. 12 save validates the script fields, stores the sql script, saves the workflow-package assignments, and refreshes the navigation tree. list behavior list post-workflow scripts opens the script list already scoped to post-workflow scripts. the list can filter by script name, shows name, type, and description, and opens the define script page when a row is double-clicked. the new button opens a new script with post-workflow already selected. delete removes the selected script after confirmation. the up and down buttons swap sequence numbers only between scripts of the same script type. related topics post-creation post-deployment pre-creation pre-deployment previous pre-workflow nextpre-deployment"}
,{"id":386708347129,"name":"Pre-deployment","type":"topic","path":"/docs/reference/entity-types/sql-script-types/entity-types-sql-script-types-pre-deployment","breadcrumb":"Reference › Entity types › SQL script types › Pre-deployment","description":"","searchText":"reference entity types sql script types pre-deployment overview pre-deployment scripts are custom sql steps that run before analyticscreator applies deployment changes to the target database. use this script type for preparation that must happen immediately before deployment, such as validating prerequisites, applying environment-specific setup, or preparing supporting objects used by the deployment process. function use pre-deployment when the sql logic belongs in the deployment preparation phase rather than during database creation, after deployment, or as part of a workflow package. scripts in this group are ordered by sequence number and then by script name in the navigation tree. pre-deployment uses the shared define script page. the editor stores the script type, script name, description, sequence number, inactive flag, and sql text. the package assignment grid is hidden for this type because package assignment is only shown for workflow script types. when a deployment package is generated, active pre-deployment scripts are included in the preparation step so they can run before the deployment changes are applied. access the scripts branch contains a pre-deployment scripts node. its context menu provides list pre-deployment scripts and add pre-deployment script, both preselecting the pre-deployment script type. how to access navigation tree scripts -> pre-deployment scripts -> list pre-deployment scripts, or add pre-deployment script toolbar scripts diagram not direct. use the scripts list or navigation tree. visual element define script -> script type -> pre-deployment screen overview id property description 1 script type selects the sql script type. for this page the selected type is pre-deployment. 2 name defines the script name. save validation requires a non-empty value. 3 description stores the optional script description shown in the script list. 4 sequence number controls ordering inside the pre-deployment script group. a non-numeric value is rejected during validation. 5 inactive stores whether the script is disabled without deleting it. 6 original shows the editable sql script text. 7 parsed shows the macro-parsed preview of the sql script in a read-only field. 8 script contains the sql body. save validation requires a non-empty script. 9 cancel returns to the previous page without saving changes. 10 save validates the script fields, stores the sql script, and refreshes the navigation tree. list behavior list pre-deployment scripts opens the script list already scoped to pre-deployment scripts. the list can filter by script name, shows name, type, and description, and opens the define script page when a row is double-clicked. the new button opens a new script with pre-deployment already selected. delete removes the selected script after confirmation. the up and down buttons swap sequence numbers only between scripts of the same script type. related topics post-creation post-deployment post-workflow pre-creation previous post-workflow nextpost-deployment"}
,{"id":386708347126,"name":"Post-deployment","type":"topic","path":"/docs/reference/entity-types/sql-script-types/entity-types-sql-script-types-post-deployment","breadcrumb":"Reference › Entity types › SQL script types › Post-deployment","description":"","searchText":"reference entity types sql script types post-deployment overview post-deployment scripts are custom sql steps that run after analyticscreator has completed deployment work. use this script type for final adjustments that belong after deployment, such as applying environment-specific settings, finalizing supporting objects, or running cleanup logic once deployed objects are in place. function use post-deployment when the sql logic depends on deployment results and should run as a follow-up step rather than as preparation. scripts in this group are ordered by sequence number and then by script name in the navigation tree. post-deployment uses the shared define script page. the editor stores the script type, script name, description, sequence number, inactive flag, and sql text. the package assignment grid is hidden for this type because package assignment is only shown for workflow script types. access the scripts branch contains a post-deployment scripts node. its context menu provides list post-deployment scripts and add post-deployment script, both preselecting the post-deployment script type. how to access navigation tree scripts -> post-deployment scripts -> list post-deployment scripts, or add post-deployment script toolbar scripts diagram not direct. use the scripts list or navigation tree. visual element define script -> script type -> post-deployment screen overview id property description 1 script type selects the sql script type. for this page the selected type is post-deployment. 2 name defines the script name. save validation requires a non-empty value. 3 description stores the optional script description shown in the script list. 4 sequence number controls ordering inside the post-deployment script group. a non-numeric value is rejected during validation. 5 inactive stores whether the script is disabled without deleting it. 6 original shows the editable sql script text. 7 parsed shows the macro-parsed preview of the sql script in a read-only field. 8 script contains the sql body. save validation requires a non-empty script. 9 cancel returns to the previous page without saving changes. 10 save validates the script fields, stores the sql script, and refreshes the navigation tree. list behavior list post-deployment scripts opens the script list already scoped to post-deployment scripts. the list can filter by script name, shows name, type, and description, and opens the define script page when a row is double-clicked. the new button opens a new script with post-deployment already selected. delete removes the selected script after confirmation. the up and down buttons swap sequence numbers only between scripts of the same script type. related topics post-creation post-workflow pre-creation pre-deployment previous pre-deployment nextrepository extension"}
,{"id":386708348091,"name":"Repository extension","type":"topic","path":"/docs/reference/entity-types/sql-script-types/entity-types-sql-script-types-repository-extension","breadcrumb":"Reference › Entity types › SQL script types › Repository extension","description":"","searchText":"reference entity types sql script types repository extension overview repository extension scripts are custom sql steps that extend or adjust the analyticscreator repository after repository creation or update work. use this script type for repository-level customization, such as adding supporting metadata, applying project-specific repository adjustments, or running maintenance logic that belongs to the repository rather than to a deployment or workflow package. function use repository extension when the sql logic is intended for the analyticscreator repository itself. scripts in this group are ordered by sequence number and then by script name in the navigation tree. repository extension uses the shared define script page. the editor stores the script type, script name, description, sequence number, inactive flag, and sql text. the package assignment grid is hidden for this type because repository extension scripts are not assigned to workflow packages. the repository extension scripts context menu also includes an action to run the active repository extension scripts. when used, analyticscreator runs each active script with sql text in sequence order and confirms when the repository custom scripts have been applied. access the scripts branch contains a repository extension scripts node. its context menu provides list repository extension scripts, add repository extension script, and an action for running active repository extension scripts. how to access navigation tree scripts -> repository extension scripts -> list repository extension scripts, add repository extension script, or run repository extension scripts toolbar scripts diagram not direct. use the scripts list or navigation tree. visual element define script -> script type -> repository extension screen overview id property description 1 script type selects the sql script type. for this page the selected type is repository extension. 2 name defines the script name. save validation requires a non-empty value. 3 description stores the optional script description shown in the script list. 4 sequence number controls ordering inside the repository extension script group. a non-numeric value is rejected during validation. 5 inactive stores whether the script is disabled without deleting it. disabled scripts are skipped when active repository extension scripts are run. 6 original shows the editable sql script text. 7 parsed shows the macro-parsed preview of the sql script in a read-only field. 8 script contains the sql body. save validation requires a non-empty script. 9 cancel returns to the previous page without saving changes. 10 save validates the script fields, stores the sql script, and refreshes the navigation tree. list behavior list repository extension scripts opens the script list already scoped to repository extension scripts. the list can filter by script name, shows name, type, and description, and opens the define script page when a row is double-clicked. the new button opens a new script with repository extension already selected. delete removes the selected script after confirmation. the up and down buttons swap sequence numbers only between scripts of the same script type. related topics post-deployment post-workflow pre-creation pre-deployment previous post-deployment nextschema types"}
,{"id":383509340364,"name":"Schema types","type":"subsection","path":"/docs/reference/entity-types/schema-types","breadcrumb":"Reference › Entity types › Schema types","description":"","searchText":"reference entity types schema types schema types define how database schemas are organized in analyticscreator and what role each schema plays in the generated data warehouse architecture. use this section to understand the available schema types and how they structure staging, historization, transformation, core, and data mart layers. available schema types staging used to store imported source data before further processing. initial landing layer holds imported source structures basis for downstream historization and transformation open staging persisted staging used to store persistent and historized source data for further processing. persistent source-related layer supports historization and reprocessing separates source loading from downstream logic open persisted staging transformation used for generated transformation logic that shapes and combines source data. transformation-oriented layer typically contains generated views or logic objects used between source-related and business-oriented layers open transformation core used to store business-oriented structures such as integrated dimensions, facts, or data vault-based core models. central business logic layer contains integrated warehouse structures feeds downstream analytical layers open core datamart used to expose data in a form intended for analytical consumption and reporting. consumption-oriented layer typically contains facts and dimensions for reporting basis for semantic models and bi tools open datamart how to choose a schema type use staging for imported source data use persisted staging when persistent and historized source data is required use transformation for intermediate transformation logic use core for integrated business-oriented warehouse structures use datamart for reporting-ready analytical structures key takeaway schema types define the structural layers of the generated data warehouse, from source-oriented staging through core integration to reporting-ready data marts. previous repository extension nextstaging"}
,{"id":386676751597,"name":"Staging","type":"topic","path":"/docs/reference/entity-types/schema-types/entity-types-schema-types-staging","breadcrumb":"Reference › Entity types › Schema types › Staging","description":"","searchText":"reference entity types schema types staging overview staging is the schema type used for schemas in the staging layer. in the seed data, the default staging schema name is imp. function schemas of this type are placed in the staging layer. their schema node exposes the import package entry in the navigation tree. access this schema type is configured in the list schemas page, where each schema row has a name, schematype, layer, and description. how to access navigation tree dwh -> staging layer -> right-click -> add schema toolbar dwh -> schemas diagram not applicable. visual element list schemas -> schematype screen overview id property description 1 search criteria filters the schema list by schema name, schema type id, or description. 2 search applies the entered filter to the schema grid. 3 delete filter clears the active filter and reloads the full schema list. 4 name shows the schema name, for example imp. 5 schematype sets the schema type to staging. 6 layer assigns the schema to the staging layer. saving is blocked when a schema row has no layer assigned. 7 description stores the free-text description for the schema row. 8 save saves the schema changes. when a schema row specifies a missing database, the page prompts to create it. 9 cancel returns to the previous page without saving. related topics core datamart persisted staging transformation previous schema types nextpersisted staging"}
,{"id":386676751596,"name":"Persisted staging","type":"topic","path":"/docs/reference/entity-types/schema-types/entity-types-schema-types-persisted-staging","breadcrumb":"Reference › Entity types › Schema types › Persisted staging","description":"","searchText":"reference entity types schema types persisted staging overview persisted staging is the schema type used for schemas in the persisted staging layer. in the seed data, the default persisted staging schema name is stg. function schemas of this type are placed in the persisted staging layer. their schema node exposes the historization package entry in the navigation tree. access this schema type is configured in the list schemas page, where each schema row has a name, schematype, layer, and description. how to access navigation tree dwh -> persisted staging layer -> right-click -> add schema toolbar dwh -> schemas diagram not applicable. visual element list schemas -> schematype screen overview id property description 1 search criteria filters the schema list by schema name, schema type id, or description. 2 search applies the entered filter to the schema grid. 3 delete filter clears the active filter and reloads the full schema list. 4 name shows the schema name, for example stg. 5 schematype sets the schema type to persisted staging. 6 layer assigns the schema to the persisted staging layer. saving is blocked when a schema row has no layer assigned. 7 description stores the free-text description for the schema row. 8 save saves the schema changes. when a schema row specifies a missing database, the page prompts to create it. 9 cancel returns to the previous page without saving. related topics core datamart staging transformation previous staging nexttransformation"}
,{"id":386676751598,"name":"Transformation","type":"topic","path":"/docs/reference/entity-types/schema-types/entity-types-schema-types-transformation","breadcrumb":"Reference › Entity types › Schema types › Transformation","description":"","searchText":"reference entity types schema types transformation overview transformation is the schema type used for schemas in the transformation layer. in the seed data, the default transformation schema name is trn. function schemas of this type are placed in the transformation layer and are used for transformation objects managed from the schema node. access this schema type is configured in the list schemas page, where each schema row has a name, schematype, layer, and description. how to access navigation tree dwh -> transformation layer -> right-click -> add schema toolbar dwh -> schemas diagram not applicable. visual element list schemas -> schematype screen overview id property description 1 search criteria filters the schema list by schema name, schema type id, or description. 2 search applies the entered filter to the schema grid. 3 delete filter clears the active filter and reloads the full schema list. 4 name shows the schema name, for example trn. 5 schematype sets the schema type to transformation. 6 layer assigns the schema to the transformation layer. saving is blocked when a schema row has no layer assigned. 7 description stores the free-text description for the schema row. 8 save saves the schema changes. when a schema row specifies a missing database, the page prompts to create it. 9 cancel returns to the previous page without saving. related topics core datamart persisted staging staging previous persisted staging nextcore"}
,{"id":386676751594,"name":"Core","type":"topic","path":"/docs/reference/entity-types/schema-types/entity-types-schema-types-core","breadcrumb":"Reference › Entity types › Schema types › Core","description":"","searchText":"reference entity types schema types core overview core is the schema type used for schemas in the core layer. in the seed data, the default core schema name is dwh. function schemas of this type are placed in the core layer and are used for core dwh objects managed from the schema node. access this schema type is configured in the list schemas page, where each schema row has a name, schematype, layer, and description. how to access navigation tree dwh -> core layer -> right-click -> add schema toolbar dwh -> schemas diagram not applicable. visual element list schemas -> schematype screen overview id property description 1 search criteria filters the schema list by schema name, schema type id, or description. 2 search applies the entered filter to the schema grid. 3 delete filter clears the active filter and reloads the full schema list. 4 name shows the schema name, for example dwh. 5 schematype sets the schema type to core. 6 layer assigns the schema to the core layer. saving is blocked when a schema row has no layer assigned. 7 description stores the free-text description for the schema row. 8 save saves the schema changes. when a schema row specifies a missing database, the page prompts to create it. 9 cancel returns to the previous page without saving. related topics datamart persisted staging staging transformation previous transformation nextdatamart"}
,{"id":386676751595,"name":"Datamart","type":"topic","path":"/docs/reference/entity-types/schema-types/entity-types-schema-types-datamart","breadcrumb":"Reference › Entity types › Schema types › Datamart","description":"","searchText":"reference entity types schema types datamart overview datamart is the schema type used for schemas in the datamart layer. in the seed data, the default datamart schema name is star. function schemas of this type are placed in the datamart layer and are used for data mart objects managed from the schema node. access this schema type is configured in the list schemas page, where each schema row has a name, schematype, layer, and description. how to access navigation tree dwh -> datamart layer -> right-click -> add schema toolbar dwh -> schemas diagram not applicable. visual element list schemas -> schematype screen overview id property description 1 search criteria filters the schema list by schema name, schema type id, or description. 2 search applies the entered filter to the schema grid. 3 delete filter clears the active filter and reloads the full schema list. 4 name shows the schema name, for example star. 5 schematype sets the schema type to datamart. 6 layer assigns the schema to the datamart layer. saving is blocked when a schema row has no layer assigned. 7 description stores the free-text description for the schema row. 8 save saves the schema changes. when a schema row specifies a missing database, the page prompts to create it. 9 cancel returns to the previous page without saving. related topics core persisted staging staging transformation previous core nextentities"}
,{"id":383461259456,"name":"Entities","type":"section","path":"/docs/reference/entities","breadcrumb":"Reference › Entities","description":"","searchText":"reference entities entities are the concrete objects used in analyticscreator projects. they represent the connectors, sources, schemas, tables, transformations, packages, models, scripts, and supporting objects that make up a generated data warehouse model. use this section when you need to understand what a specific object represents and how it fits into modeling, generation, deployment, or execution. entity groups connector represents a connection definition for a source system or external data provider. stores connection-related metadata groups source objects under a provider supports metadata import and source access open connector source represents a source object that can be imported or used as input for generated warehouse logic. source tables, views, or queries input metadata for imports basis for staging structures open source schema represents a database schema used to organize generated objects into warehouse layers. staging and persistent layers transformation and core layers datamart structures open schema table represents a generated or managed table object in the warehouse model. import and historized tables persisting tables fact, dimension, and data vault tables open table transformation represents transformation logic that shapes, combines, or prepares data for downstream use. generated transformation logic manual or script-based logic datamart-facing transformations open transformation package represents an execution unit used to load, historize, persist, export, or orchestrate data processing. import and workflow execution historization and persisting execution script, export, and external processing open package deployment represents deployment configuration and output used to move generated artifacts into a target environment. deployment package settings generated artifact delivery environment-specific release behavior open deployment model represents an analytical model or model-related definition used for reporting-facing structures. model dimensions and facts consumption-oriented structures semantic or analytical organization open model layer represents a logical warehouse layer used to organize objects by architectural purpose. source-oriented layers core transformation layers consumption layers open layer filter represents reusable filtering logic that can restrict or shape selected data in a model. selection conditions reusable constraints model-specific filtering behavior open filter index represents an index definition used to support database performance and generated object behavior. index metadata generated database support performance-oriented configuration open index hierarchy represents hierarchical relationships used for analytical navigation and structured reporting. parent-child organization analytical drill paths dimension-related structure open hierarchy partition represents partition-related metadata for analytical or database structures that are split into segments. partition definitions olap or table segmentation processing and maintenance support open partition macro represents reusable logic or text that can be applied across generated sql or model definitions. reusable expressions shared generation logic template-style model support open macro sql script represents custom sql logic that can run during creation, workflow execution, deployment, or repository extension. creation and deployment scripts workflow-related scripts repository extension logic open sql script object script / object group represents script logic associated with analyticscreator objects or object-level processing. object-specific execution custom processing steps advanced automation behavior open object script object group represents a named group of objects used to organize, select, or process related model elements together. grouped model objects shared organization batch-oriented selection support open object group how to use this section use connector, source, schema, and table when reviewing source-to-warehouse structure use transformation, filter, macro, and sql script when reviewing generated or custom logic use package, deployment, and object script / object group when reviewing execution and release behavior use model, hierarchy, partition, and object group when reviewing analytical organization and object grouping key takeaway entities are the concrete building blocks of an analyticscreator project. they describe the objects that are modeled, generated, deployed, executed, and consumed across the data warehouse lifecycle. previous datamart nextlayer"}
,{"id":383509340365,"name":"Layer","type":"subsection","path":"/docs/reference/entities/entities-layer","breadcrumb":"Reference › Entities › Layer","description":"","searchText":"reference entities layer overview a layer is a repository entity used to organize schemas and warehouse objects by architectural level. layers define the visible structure under the data warehouse navigation tree and help separate source, staging, transformation, core, and reporting areas. function use the layer entity to control the ordered list of warehouse layers. each layer has a name, description, and sequence number. the sequence number controls the order in which layers appear, and it must be unique. the layer page is an editable list. changes are saved from the list page, and saving recreates the diagram structure so the updated layer order and layer metadata are reflected in the interface. access layers can be opened from the repository navigation tree or from the dwh ribbon tab. individual layer entries appear below the layers node in sequence-number order. how to access navigation tree data warehouse -> layers toolbar dwh -> list -> layers diagram not direct. use the layer list or navigation tree. visual element layer configuration list screen overview the layer configuration list contains the following visible fields and actions. id property description 1 search criteria filter area used to search layer records by layer name or description. 2 search runs the filter entered in the search field. 3 name layer name shown in the list and in the repository navigation tree. 4 seqnr sequence number that controls the layer order. the value must be unique across layers. 5 description optional description for the layer. the description can be edited directly in the list. 6 save validates that sequence numbers are unique, saves the layer list, recreates the diagram, and refreshes the page. 7 cancel returns to the previous page. if there are unsaved changes, analyticscreator asks whether to save or cancel the navigation. related topics entities schema layers in the navigation tree layers list previous entities nextschema"}
,{"id":383509340366,"name":"Schema","type":"subsection","path":"/docs/reference/entities/entities-schema","breadcrumb":"Reference › Entities › Schema","description":"","searchText":"reference entities schema overview a schema is a repository entity that groups tables and transformations within a data warehouse layer. schemas define the database namespace, schema type, owning layer, and descriptive metadata used by generated warehouse objects. function use the schema entity to maintain the logical areas of the warehouse, such as staging, persisted staging, transformation, core, and datamart schemas. schemas are displayed below their layer in the navigation tree and are edited in a grid-based schema list page. a schema stores its name, schema type, layer, optional database name, description, variable, and hash key. the schema name is unique in the repository, and the selected layer controls where the schema appears in the tree. when schemas are saved, analyticscreator checks that every schema has a layer assigned, saves the grid changes, and checks whether any schema-specific database named in the database field must be created. access schemas can be opened from the dwh ribbon tab, from the layers area of the repository navigation tree, or from a schema node context menu. how to access navigation tree data warehouse -> layers -> layer -> schema toolbar dwh -> list -> schemas diagram schema tree item -> set diagram filter or add to diagram filter visual element schemas list page and schema nodes under each layer. screen overview the schemas list page contains the following visible fields and actions. id property description 1 search criteria search area used to filter the schema grid. 2 filter text text field used by the search. pressing enter runs the same search as the search button. 3 search filters schemas where the schema name, schema type id, or description contains the entered text. 4 delete filter clears the search text and reloads the full schema list. 5 name schema name stored as schema_name. the repository enforces unique schema names. 6 schematype schema type selection. the list is ordered by schematypeid and displays the schema type description. 7 layer layer selection. the list is ordered by layer sequence and displays the layer name. 8 database optional database name for schemas that use a separate database. the column is hidden in the grid but is part of the schema record. 9 description editable description for the schema. the editor supports multiline text, tab characters, and scrollbars. 10 save validates layer assignment, saves schema changes, checks optional database creation, and refreshes the page. 11 cancel returns to the previous page. if there are unsaved changes, analyticscreator asks whether to save or cancel the navigation. schema types and defaults the seeded schema types are imp for staging, hist for persisted staging, trn for transformation, dwh for core, and dm for datamart. new repositories seed layers named staging layer, persisted staging layer, transformation layer, core layer, and datamart layer. default schemas are created as imp, stg, trn, dwh, and star and assigned to the matching layer sequence. if an existing schema has no layer, repository setup assigns it to the first layer by sequence. schema actions list schemas opens the schema grid from the dwh ribbon or the schemas node. add schema from a layer opens the same schema grid for schema maintenance. edit schema from a schema node opens the schema grid and selects the chosen schema row. set diagram filter and add to diagram filter use the selected schema as a filter object for the architecture diagram. delete schema removes the selected schema after confirmation through the shared delete action. related topics entities layer table transformation schema types schemas list previous layer nextconnector"}
,{"id":383509396692,"name":"Connector","type":"subsection","path":"/docs/reference/entities/entities-connector","breadcrumb":"Reference › Entities › Connector","description":"","searchText":"reference entities connector overview a connector is a repository entity that defines how analyticscreator connects to an external data source. connectors store the connector name, connector type, connection settings, source-specific options, and metadata used to read sources, refresh source structures, create imports, and export connector definitions. function use the connector entity to maintain source-system access for supported connector types such as mssql, oracle, csv, excel, access, oledb, sap, odbc, direct, oledb.net, azure blob, and odata. the visible fields change by connector type. standard ole db-style connectors use a connection string and can insert a template. csv connectors expose file parsing settings. direct connectors expose server and database fields plus sqlcmd variable fields. azure blob connectors expose storage account and azure key fields. odata connectors expose url, authentication, login, and password fields. when a connector is saved, analyticscreator validates the connector type and connector name, validates direct database and sqlcmd variable values where required, stores the type-specific settings, detects quoted identifiers for supported database connectors when possible, and refreshes the repository navigation tree. access connectors can be opened from the sources ribbon tab, from the connectors branch in the repository navigation tree, from the connectors list, or from an individual connector node. how to access navigation tree data warehouse -> connectors -> connector toolbar sources -> list -> connectors diagram not applicable. visual element connectors list, connector detail page, and connector nodes in the repository navigation tree. screen overview the connector detail page contains the following visible fields, options, and actions. id property description 1 encrypted string help shows that #encrypted_string# aliases can be used instead of plain-text passwords. encrypted strings are maintained under options->encrypted strings. 2 connector name name of the connector. saving requires a non-empty value, and connector names are unique in the repository. 3 connector type connector type selection. seeded types include mssql, oracle, csv, excel, access, oledb, sap, odbc, direct, oledb.net, azure blob, and odata. 4 azure source type optional azure source type associated with the connector. 5 do not store connection string in cfg.ssis__configurations controls whether the connector connection string is written into the ssis configuration table. 6 connection string connection string field for ole db-style connector types. the context menu can insert encrypted string aliases at the cursor position. 7 template inserts a connection string template for supported connector types such as mssql, oracle, excel, access, sap, and odbc. 8 server name / database name direct connector fields. database name is required when saving a direct connector. 9 server sqlcmd variable / database sqlcmd variable direct connector sqlcmd variable fields. values are validated before saving. 10 storage account / azure key azure blob connector fields used to connect to azure blob storage. 11 url odata service url. test connection appends the metadata endpoint when checking the service. 12 authentication odata authentication mode. available values are none, windows, and basic. 13 login / password odata credentials shown for basic authentication. the password is encrypted before it is stored. 14 column names first row csv setting that marks the first row as column names. the default shown for csv connectors is enabled. 15 unicode / locale / code page csv encoding and locale settings. csv defaults include unicode disabled, locale english, and code page 1252. 16 format / text qualifier csv format and text qualifier settings. the default format is 0. 17 header row delimiter / header rows to skip csv header parsing settings. delimiters support {cr}, {lf}, and {t} notation. 18 row delimiter / column delimiter csv row and column delimiters. defaults are {cr}{lf} for row delimiter and semicolon for column delimiter. 19 test connection tests the current connector settings. direct checks a target database query, azure blob lists containers, odata requests metadata, sap opens an sap connection, odbc opens an odbc connection, and other database connectors open an ole db connection. 20 save validates and saves connector metadata, then refreshes the repository navigation tree. 21 cancel returns to the previous page. if there are unsaved changes, analyticscreator asks whether to save or cancel the navigation. list behavior the connectors list filters by connector name, connector type id, connection string, locale, code page, or format. the list grid shows connectorname, connectortype, and connectionstring. double-clicking a connector row opens the selected connector in the connector detail page. new opens the connector detail page for a new connector. delete removes the selected connector after confirmation. connector actions the connectors node provides refresh, list connectors, add connector, import connector from file, and import connector from cloud. a selected connector provides set diagram filter, add to diagram filter, edit connector, delete connector, dwh wizard, refresh used sources, refresh all sources, export connector to file, and export connector to cloud. below a connector, the navigation tree exposes sources and source references. refresh used sources refreshes source metadata for used sources. refresh all sources refreshes source metadata for all sources under the connector. related topics entities connector types connectors navigation tree connectors list connector page source previous schema nextsource"}
,{"id":383509340368,"name":"Source","type":"subsection","path":"/docs/reference/entities/entities-source","breadcrumb":"Reference › Entities › Source","description":"","searchText":"reference entities source overview a source is a repository entity that describes an external source object available through a connector. sources define where data comes from, how the object is identified, which source type is used, and which source columns are available for imports, exports, references, constraints, previews, and diagram relationships. function use the source entity to maintain source metadata such as source schema, source name, connector, source type, friendly name, path, description, anonymization check statement, optional query text, and source-column definitions. source behavior depends on the selected connector and source type. csv and file-based connectors expose file path and directory-processing fields. sap connectors expose deltaq and odp fields. azure blob sources expose blob and csv parsing settings. odata sources expose odata type, resource path, and query options. sql query sources expose a query tab and can test the query before saving. when a source is saved, analyticscreator validates required values, prevents changing an existing source to a connector of another connector type, saves the source and source columns, refreshes the interface for new or renamed sources, and refreshes source metadata when the saved query changes. access sources can be opened from the sources ribbon tab, from a connector's sources node in the repository navigation tree, from the sources list, or by double-clicking a source object in the dataflow diagram. how to access navigation tree data warehouse -> connectors -> connector -> sources -> source toolbar sources -> list -> sources diagram source -> double-click visual element sources list, source detail page, and source object in the dataflow diagram. screen overview the source detail page contains the following visible fields, tabs, and actions. id property description 1 source name name of the source object. saving requires a non-empty value. 2 source schema source schema or source directory, depending on the connector type. for azure blob sources, this field is shown as directory and is required. 3 connector connector that owns the source. saving requires a connector, and an existing source cannot be changed to a connector of another connector type. 4 group optional source group used to organize source nodes below a connector. 5 type source type. seeded types include table, view, sap_deltaq, query, and sap_odp. the selectable values depend on the connector type. 6 friendly name optional business label for the source. 7 anonymization check statement optional statement used with source anonymization and checks. 8 description free-text description for the source. 9 path file path used by file-based source definitions. the browse button can fill the path and, when the source name is empty, use the selected file name as the source name. 10 process files in directory enables directory processing for file-based connectors. when enabled, directory, file extension, and include subdirectories become editable. 11 directory / file extension / include subdirectories directory-processing settings for file-based sources. 12 blob type azure blob source setting used when the connector type supports blob sources. 13 odata type odata mode selection. available values are collection and resource path. 14 resourcepath / queryoptions odata settings used when the source reads a resource path or passes query options. 15 definition source-column grid. columns include column name, ordernr, data type, maxlength, numprec, numscale, nullable, pk ordinal position, anonymize, friendly name, display folder, referenced column, references, description, and connector-specific fields. 16 query sql query editor shown for query source types. saving a query source requires query text. 17 csv properties azure blob csv settings: column names first row, code page, text qualifier, and column delimiter. the delimiter note supports {cr}, {lf}, and {t} notation. 18 sap deltaq / odp sap-specific panel for extractor or context, mode, auto sync., deltaq type, log.destination, rfc destination, odp semantic, supports full, and supports delta. 19 get csv structure reads a csv file and replaces the existing source columns after confirmation. it detects string, numeric, integer, and datetime columns and sets length, precision, scale, and text-qualified flags. 20 test query for query source types, the same action tests the sql query instead of parsing csv structure. 21 constraints opens source constraints for a saved source. unsaved sources must be stored before constraints can be maintained. 22 save validates the source, saves source metadata and columns, refreshes the interface for new or renamed sources, and refreshes source metadata when query text changes. 23 cancel returns to the previous page. if there are unsaved changes, analyticscreator asks whether to save or cancel the navigation. list behavior the sources list filters by description, connector name, source schema, and source name. when the list is opened from a connector context, it is filtered to that connector. the list grid shows source schema, source name, connector, type, path, friendly name, and description. double-clicking a source row opens the selected source in the source detail page. delete removes the selected source after confirmation. source actions the sources node below a connector provides list sources, create new source, and read source from connector. for csv connectors, read source from connector opens the source definition page directly. other connector types open the new-source assistant and can continue to the source definition page. a selected source provides locate in diagram, set diagram filter, add to diagram filter, edit source, delete source, add import, add export, and refresh structure. below a source, the navigation tree exposes columns, constraints, and references. preview opens the csv file for csv sources or opens the preview dialog for other source types. related topics entities connector source types sources list source page table previous connector nexttable"}
,{"id":383509340369,"name":"Table","type":"subsection","path":"/docs/reference/entities/entities-table","breadcrumb":"Reference › Entities › Table","description":"","searchText":"reference entities table overview a table is a repository entity that defines a physical table, view-backed table, data mart table, or externally filled table in analyticscreator. tables belong to schemas and provide the column metadata, keys, references, scripts, and olap settings used by generated warehouse objects. function use the table entity to maintain the table name, schema, table type, compression, historization or persistence relationship, data vault relationship, column definitions, calculated columns, dependencies, measures, identity-column settings, and generated table definition. the editable behavior depends on the table type. import and external tables allow direct column maintenance. view-based tables expose table metadata but keep source-driven columns read-only. data mart tables show olap transfer, aggregate, display folder, category, measure, hierarchy, and partition-related options. when a table is saved, analyticscreator validates required values, checks duplicate table and transformation names in the selected schema, maintains the primary-key index when requested, saves identity-column settings, checks calculated columns for physical tables, and refreshes the interface when a new table is created or renamed. access tables can be opened from the schema area of the repository navigation tree, from the dwh ribbon tab, from the table list, or by double-clicking a table object in the dataflow diagram. how to access navigation tree data warehouse -> layers -> layer -> schema -> tables toolbar dwh -> list -> tables diagram table -> double-click visual element tables list and table detail page screen overview the table detail page contains the following visible fields, tabs, and actions. id property description 1 table name name of the table in the selected schema. saving requires a non-empty name, and the same schema cannot already contain a table or transformation with that name. 2 table schema schema that owns the table. saving requires a selected schema. 3 table type controls table behavior. new table records are limited to external table types, while existing records keep their current type unless they are external table variants. 4 friendly name optional business label used in display and generated metadata. 5 compression type compression setting for generated physical table objects. new records default to compression type 0. 6 description free-text description for the table. 7 anonymization / check statement statement area used with table anonymization and checks. the field supports multiline input and tab characters. 8 hist of table source table for a history table. for history table records, the selectable list is restricted to compatible source tables. 9 persist of table read-only display of the table that a persisted table is based on. 10 hub of table / satellite of table / link of table data vault relationships used to connect table metadata to hub, satellite, or link tables. 11 has primary key creates or maintains a primary-key index from columns with a pk ordinal position. 12 pk clustered marks the generated primary-key index as clustered. clustered primary keys are blocked when the compression setting resolves to clustered columnstore. 13 primary key name primary-key index name. saving requires a value when primary key generation is enabled, and the name must not duplicate another table primary key. 14 inheritance controls inherit friendlyname, inherit description, inherit display folder, inherit all references, and don't inherit pk control whether generated metadata inherits values from upstream objects. 15 olap controls data mart table types show olap perspective, export to olap, hidden in olap, and olap category fields. 16 columns column grid for physical columns. visible columns include add.col, column name, data type, maxlength, numprec, numscale, nullable, pkordinalpos, default, friendlyname, references, olap options, description, anonymize, inheritance, and collation. 17 calculated columns calculated column grid. for data mart tables, the tab is shown as tabular olap dax columns and exposes olap-specific fields. 18 scripts prescript and postscript editors with original and parsed views. parsed view runs macro parsing on the entered script. 19 dependencies read-only dependency grid showing column name, referencing columns, and referenced columns. 20 measures data mart measure grid. new measures use the configured default measure name and display folder. the grid includes measure name, source column, aggregate, hidden flag, tabular and multidimensional statements, parsed output, description, display folder, and format string. 21 table definition read-only generated table script. the table must be saved before a definition can be generated. 22 identity column optional identity-column definition with name, type, seed, increment, and pk pos. new identity settings default seed and increment to 1 and type to int. 23 load field definitions from existing table for external table types, imports field definitions from an existing database table. existing columns are replaced after confirmation, and the table definition must be saved first. 24 create in dwh generates and runs the table creation script for a saved non-view table. unsaved tables and view-based tables cannot be created from this action. 25 save validates the table, saves metadata and child rows, updates the primary-key index and identity column, checks calculated columns for physical tables, and reloads the saved table. 26 cancel returns to the previous page. if there are unsaved changes, analyticscreator asks whether to save or cancel the navigation. list behavior the table list filters by description, table name, schema name, and table type description. the list grid shows table schema, table name, historization of table, persistence of table, table type, friendly name, and description. when the list is opened from a schema context, it is filtered to that schema. double-clicking a table row opens the selected table in the table detail page. delete removes the selected table after confirmation. table actions the tables node provides list tables and add externally filled table. a selected table provides locate in diagram, set diagram filter, add to diagram filter, edit table, delete table, and add historization. data vault actions are available from a selected table: add vault hub, add vault satellite, and add vault link. show reference diagram opens the table reference diagram for the selected table. below a table, the navigation tree exposes columns, indexes for non-view tables, and references. data mart tables can also expose hierarchies and partitions. related topics entities schema index transformation tables list table page previous source nexttransformation"}
,{"id":383509396693,"name":"Transformation","type":"subsection","path":"/docs/reference/entities/entities-transformation","breadcrumb":"Reference › Entities › Transformation","description":"","searchText":"reference entities transformation overview a transformation is a repository entity that defines how analyticscreator builds a derived data object from tables, sql logic, external output, script output, or a union of source tables. transformations belong to a schema and can be used to generate views, persist result tables, support model objects, and feed downstream warehouse structures. function use the transformation entity to maintain transformation metadata such as name, schema, transformation type, historization type, friendly name, description, persistence settings, object-table links, source selection, and inheritance settings. the definition tab controls transformation tables, output columns, references, star assignments, predefined transformations, snapshots, filters, and having conditions. the view tab stores manual sql view text or script text, depending on the transformation type. saving validates the transformation type, required direct source, non-empty name, non-empty column names, and duplicate column names. analyticscreator then stores the definition, creates or refreshes the transformation view, refreshes the interface when the object is new or renamed, and reloads the detail page. access transformations can be opened from schema nodes in the repository navigation tree, from the transformations list, from the etl toolbar commands, or from transformation nodes and diagram context commands. how to access navigation tree data warehouse -> layers -> layer -> schema -> transformations -> transformation toolbar etl -> list -> transformations or etl -> new -> new transformation diagram transformation object -> edit transformation visual element transformations list, create transformation wizard, transformation detail page, transformation nodes, and dataflow diagram transformation objects. screen overview the transformation detail page contains the following visible fields, grids, tabs, and actions. id property description 1 name transformation name. saving requires a non-empty value that is unique within the selected schema. 2 schema schema that owns the transformation. 3 transtype transformation type. the selected type controls which detail fields, grids, and tabs are enabled. 4 hist type transformation historization type. snapshot-related grids are enabled only for snapshot historization modes. 5 create unknown member creates an unknown-member row for transformation types where this option is enabled. 6 fact transformation marks the transformation as a fact transformation. 7 distinct applies distinct handling at transformation level when enabled for the selected type. 8 don't detect dependencies script-transformation option that prevents dependency detection for the script transformation. 9 persist table / result table persistence target name. external and script transformations use result-table behavior instead of the standard persist-table field. 10 persist package / ssis package package name for persistence or external/script execution, depending on the transformation type. 11 hub of table links the transformation to a hub table. selecting this clears the satellite and link table selections. 12 satellite of table links the transformation to a satellite table. selecting this clears the hub and link table selections. 13 link of table links the transformation to a link table. selecting this clears the hub and satellite table selections. 14 direct source source used by direct transformations. saving a direct transformation requires a selected direct source. 15 friendly name optional display name for the transformation. 16 description free-text description for the transformation. 17 inherit friendlyname inheritance option for friendly names at transformation level and column level. 18 inherit description inheritance option for descriptions at transformation level and column level. 19 inherit displayfolder inheritance option for olap display folders. 20 snapshot group / snapshot snapshot assignment grid used by snapshot historization modes. 21 definition main tab for tables, columns, references, stars, predefined transformations, filters, and having conditions. 22 tables grid for transformation input tables with seqnr., table, is output table, union all, distinct, table alias, join settings, reference statements, filters, subselects, and resulting joins. 23 columns grid for output columns with column name, tableseqnr, reference, statement, aggregation, default value, sequence, primary-key position, friendly name, description, and inheritance options. 24 references grid for table references between transformation table sequence numbers. 25 stars grid for star assignments with star, view name, isfact, and filter values. 26 predefined transformations grid for predefined transformation assignments and the useonvault flag. 27 filter / having optional sql filter and having text for supported transformation types. 28 view / script text tab for manual view definitions or script content. script transformations can also show script type. 29 old column name / new column name rename table used with manual transformations when view columns are renamed. 30 create in dwh creates or refreshes the saved transformation in the dwh. unsaved transformations cannot be created from this action. 31 save validates, stores, recreates the transformation view, refreshes related interface state, and reloads the page. 32 cancel returns to the previous page. if there are unsaved changes, analyticscreator asks whether to save or cancel the navigation. list behavior the transformations list filters by schema, transformation name, or historization type text. when opened from a schema node, the list is filtered to that schema. the list grid shows schema, name, type, hist type, and createdummyentry. double-clicking a row opens the selected transformation in the transformation detail page. new opens the create transformation wizard. duplicate duplicates the selected transformation when the selected transformation type supports duplication. delete removes the selected transformation after confirmation. create behavior the create transformation wizard starts on the main tab with type, schema, name, historizing type, main table, persistence settings, and package fields. wizard navigation depends on type. regular, dimension, fact, and other transformations can continue through tables, fields, and other. manual transformations skip table and field setup. external, script, and union transformations use their type-specific table or script tabs before other. finishing validates the schema, name, duplicate transformation/table names, required main table, join historization type, and persistence settings before creating the transformation. for external and script transformations with a created result table, analyticscreator opens the created table detail page. for other created transformations, it opens the transformation detail page. transformation actions the schema-level transformations branch provides refresh, list transformations, add transformation, add calendar dimension, add time dimension, and add snapshot dimension. a selected transformation provides locate in diagram, set diagram filter, add to diagram filter, edit transformation, delete transformation, duplicate transformation, and model-creation actions when available. transformation nodes can expose their generated table and persist table as child objects in the navigation tree. package nodes for persisting, external, and script packages can also list the transformations connected to the package. related topics entities transformations navigation tree transformations list transformation page create transformation wizard previous table nextpackage"}
,{"id":383509396694,"name":"Package","type":"subsection","path":"/docs/reference/entities/entities-package","breadcrumb":"Reference › Entities › Package","description":"","searchText":"reference entities package overview a package is a repository entity that groups executable warehouse work. packages organize imports, historizations, persistings, workflow steps, external transformations, scripts, and exports so they can be listed, edited, generated, included in workflows, and executed in dependency order. function use the package entity to maintain package metadata such as package name, package type, manual creation state, external-launch behavior, description, content rows, and manual package dependencies. package behavior depends on the package type. import packages show source-to-table import content. historizing packages show historized table-to-target table content. persisting packages show transformation-to-persist table content. workflow packages show selectable child packages with retry and error-handling settings. external transformation, script launching, and export packages use the package header metadata and manual dependency grid without the standard content grid. when a package is saved, analyticscreator validates that the package name is not empty, stores package metadata, updates workflow package references from the selected dependency or workflow rows, refreshes the navigation tree, and reloads the package detail page with the saved package id. access packages can be opened from the packages ribbon button, from the packages branch in the repository navigation tree, from a filtered package list, or from a package node in the navigation tree. how to access navigation tree data warehouse -> packages -> package type -> package toolbar etl -> list -> packages diagram not applicable. visual element packages list, package detail page, and package nodes in the repository navigation tree. screen overview the package detail page contains the following visible fields, grids, and actions. id property description 1 package name name of the package. saving requires a non-empty value, and package names are unique in the repository. 2 package type read-only package type description. seeded descriptions are import package, historizing package, persisting package, workflow package, external transformation package, script launching package, and export package. 3 manually created marks whether the package was created manually. new external transformation packages are created with this option enabled by default. 4 external launched marks a package that should not run as a normal package step. for workflow packages, this label changes to process olap cube in package. 5 description free-text description for the package. 6 content package content grid. it is shown for import, historizing, persisting, and workflow packages and hidden for external transformation, script launching, and export packages. 7 content column shows the content item. import packages show source-to-table content, historizing packages show historized table-to-table content, and persisting packages show transformation-to-persist table content. 8 include workflow-only column used to include child packages in the workflow. clicking the include column header toggles include for all workflow rows. 9 interrupt on error workflow-only column that controls whether execution should stop when the child package reports an error. 10 retry attempts workflow-only retry count for the child package. new workflow rows default to one attempt. 11 retry interval (min) workflow-only interval between retry attempts. new workflow rows default to zero minutes in the detail page. 12 delete content deletes the selected import, historizing, or persisting content row after confirmation. this action is hidden for workflow packages. 13 add content opens the matching assistant for the package type: add import, add historization, or add persisting. this action is hidden for workflow packages. 14 manual dependencies dependency grid for runnable non-workflow packages. it is hidden for workflow packages and for packages marked as externally launched. 15 package / depends on / add / remove dependency grid columns. depends on shows detected package dependencies; add includes a package as a manual dependency; remove excludes a dependency only when a detected dependency exists. 16 refresh runs package dependency refresh and reloads the dependency grid. 17 save validates and saves package metadata and workflow package references, then refreshes the navigation tree. 18 cancel returns to the previous page. if there are unsaved changes, analyticscreator asks whether to save or cancel the navigation. list behavior the packages list filters by package name or description. when opened from a package-type branch, the list is filtered to that package type. when opened from a schema context, it is filtered to packages that contain import, historization, persisting, or transformation references for that schema. the list grid shows package name, package type, manually created, externally launched, and description. double-clicking a package row opens the selected package in the package detail page. new opens the package detail page for a new package. delete removes the selected package after confirmation. package actions the packages node provides list packages and generate packages. generate packages opens the deployments list. the package-type branches are import, historization, persisting, external, script, export, and workflow. each package-type branch provides refresh and list packages. import, historization, persisting, export, workflow, external, and script branches also expose their matching add action. a selected package provides refresh, edit package, and delete package. import packages also provide add import, and historization packages also provide add historization. double-clicking an import, historizing, or persisting content row opens the matching detail page for that package content row. related topics entities package types packages navigation tree packages list package page deployment previous transformation nextindex"}
,{"id":383509340370,"name":"Index","type":"subsection","path":"/docs/reference/entities/entities-index","breadcrumb":"Reference › Entities › Index","description":"","searchText":"reference entities index overview an index is a database object definition stored in the analyticscreator repository. it belongs to a table and describes how generated database indexes, primary keys, clustered indexes, unique indexes, and columnstore indexes should be created. function use the index entity to define index metadata for warehouse tables. the detail page stores the target schema and table, the index name, optional description, compression type, index flags, and the ordered list of columns included in the index. the index list page can filter indexes by index name, schema name, or table name. opening an index from the list loads the detail page for editing; creating a new index opens the same detail page with a new index record. access indexes can be opened from the repository navigation tree or from the dwh ribbon tab. the navigation-tree context menu also supports adding an index from the selected table context. how to access navigation tree data warehouse -> indexes toolbar dwh -> list -> indexes diagram not direct. use the index list or navigation tree. visual element index detail page screen overview the index detail page contains the following visible fields, options, and actions. id property description 1 schema selects the schema that contains the table for the index. 2 table selects the table where the index is defined. the available column list is refreshed from the selected table. 3 index name name of the index. saving requires a non-empty index name. 4 description optional description for the index definition. 5 compression type compression setting applied to the generated index. new index records default to compression type 0. 6 is unique marks the index as unique. columnstore indexes cannot be unique. 7 is clustered marks the index as clustered. a table cannot have more than one clustered index. 8 is primary key marks the index as the primary key. a table cannot have more than one primary key index. 9 is columnstore marks the index as a columnstore index. columnstore indexes cannot be primary key or unique indexes. 10 column column included in the index. values are selected from the currently selected table. 11 position ordinal position of the column in the index definition. 12 is descending indicates whether the index column is sorted descending. 13 include only marks a column as included in the index without making it part of the key order. 14 save validates the index settings, saves the record, refreshes the navigation tree, and reloads the detail page for the saved index. 15 cancel returns to the previous page. if there are unsaved changes, analyticscreator asks whether to save or cancel the navigation. related topics entities indexes in the navigation tree indexes list index page previous package nextpartition"}
,{"id":383509396695,"name":"Partition","type":"subsection","path":"/docs/reference/entities/entities-partition","breadcrumb":"Reference › Entities › Partition","description":"","searchText":"reference entities partition overview a partition is a repository entity that defines one named query slice for a data mart dimension or fact table. partitions let analyticscreator generate separate olap or tabular model partitions for large analytical tables when partitioned deployment is enabled. function use the partition entity to choose the analytical table, name the partition, optionally describe the slice, and enter the sql query that returns the partition data. partition setup is limited to data mart dimension and fact view table types, with and without history. when a table is selected, analyticscreator inserts a starter sql statement for that schema and table so the user can add the partition filter in the where clause. saving validates that the partition name, sql definition, and table are present, then stores the partition metadata, refreshes the repository navigation tree, and reloads the editor with the saved partition id. access partitions can be opened from the data mart ribbon tab, from the partitions branch in the repository navigation tree, from an eligible data mart table node, or from the partitions list. how to access navigation tree data warehouse -> partitions -> table -> partition toolbar data mart -> list -> partitions diagram not applicable. visual element partitions list, partition detail page, and partition nodes in the repository navigation tree. screen overview the partition detail page contains the following visible fields and actions. id property description 1 partition name name of the partition. saving requires a non-empty value, and partition names are unique per table. 2 table data mart dimension or fact view that owns the partition. supported table types are dimension and fact views, with or without history. 3 slice optional slice text stored with the partition and used by olap partition generation. 4 sql sql query that defines the partition data. saving requires a non-empty definition. 5 save validates and saves the partition, then refreshes the repository navigation tree. 6 cancel returns to the previous page. if there are unsaved changes, analyticscreator asks whether to save or cancel the navigation. list behavior the partitions list filters by partition name. the list grid shows fact table and name. the list is ordered by partition name. double-clicking a partition row opens the selected partition in the partition detail page. new opens the partition detail page for a new partition. duplicate copies the selected partition with the same table, slice, and sql, using the selected name plus _copy and a numeric suffix when needed. delete removes the selected partition after confirmation. partition actions the partitions branch provides refresh, list partitions, and add partition. an eligible data mart table node can expose a partitions child branch. adding a partition from that branch preselects the table. a selected partition provides edit partition and delete partition. the repository navigation tree groups partitions by table under the partitions branch, then lists partition names under each table. related topics entities table model partitions navigation tree partitions list olap partition page previous index nexthierarchy"}
,{"id":383509396696,"name":"Hierarchy","type":"subsection","path":"/docs/reference/entities/entities-hierarchy","breadcrumb":"Reference › Entities › Hierarchy","description":"","searchText":"reference entities hierarchy overview a hierarchy is a repository entity that defines an ordered set of columns for a data mart dimension table. hierarchies are used to describe drill-down paths and named levels that can be consumed by generated analytical structures. function use the hierarchy entity to assign a hierarchy name and description to a data mart dimension table, then maintain the ordered hierarchy columns that make up the hierarchy levels. hierarchy setup is limited to data mart schemas and dimension-view table types. after a schema is selected, the table selector shows only supported dimension tables. after a table is selected, the hierarchy-column grid offers columns from that table. when a hierarchy is saved, analyticscreator validates that the hierarchy name is not empty and that a table is selected, stores the hierarchy and its column rows, refreshes the repository navigation tree, and reloads the detail page with the saved hierarchy id. access hierarchies can be opened from the data mart ribbon tab, from the hierarchies branch in the repository navigation tree, from an eligible table node, or from the hierarchies list. how to access navigation tree data warehouse -> hierarchies -> table -> hierarchy toolbar data mart -> list -> hierarchies diagram not applicable. visual element hierarchies list, hierarchy detail page, and hierarchy nodes in the repository navigation tree. screen overview the hierarchy detail page contains the following visible fields, grid columns, and actions. id property description 1 schema data mart schema that owns the hierarchy table. the selector is limited to data mart schemas. 2 table dimension table for the hierarchy. the selector is limited to data mart dimension views with or without history. 3 hierarchy name name of the hierarchy. saving requires a non-empty value, and hierarchy names are unique per table. 4 description free-text description for the hierarchy. 5 column hierarchy-column selector. after a table is selected, this selector shows columns from that table. 6 seqnr order number for the hierarchy level. new rows receive the next sequence number after the current maximum. 7 name optional display name for the hierarchy level. 8 description optional description for the hierarchy level. 9 save validates and saves the hierarchy and hierarchy-column rows, then refreshes the repository navigation tree. 10 cancel returns to the previous page. if there are unsaved changes, analyticscreator asks whether to save or cancel the navigation. list behavior the hierarchies list filters by hierarchy name, schema name, or table name. the list grid shows schema, table, hierarchy, and clustered. the list is ordered by schema, table, and hierarchy name. double-clicking a hierarchy row opens the selected hierarchy in the hierarchy detail page. new opens the hierarchy detail page for a new hierarchy. delete removes the selected hierarchy after confirmation. hierarchy actions the hierarchies node groups hierarchy entries by table. each table branch lists its hierarchies by hierarchy name. the hierarchies branch provides refresh, list hierarchies, and add hierarchy. a selected hierarchy provides refresh, edit hierarchy, and delete hierarchy. below a hierarchy, the navigation tree lists hierarchy columns ordered by seqnr and then by column name. a selected hierarchy column provides edit hierarchy columns and opens the same hierarchy detail page with that column selected. eligible data mart dimension table nodes also expose a hierarchies child branch. related topics entities table hierarchies navigation tree hierarchies list hierarchy page model previous partition nextmacro"}
,{"id":383509340372,"name":"Macro","type":"subsection","path":"/docs/reference/entities/entities-macro","breadcrumb":"Reference › Entities › Macro","description":"","searchText":"reference entities macro overview a macro is a reusable statement definition stored in the analyticscreator repository. macros are used to centralize reusable logic that can be referenced from transformation expressions, filters, table references, subselects, and default values. function use the macro entity to define a named reusable statement with a language, optional referenced table, and optional description. macro names must be unique in the repository, and a macro cannot be saved without a name, statement, and language. when a macro is saved, analyticscreator identifies transformations that reference the changed macro and recreates the affected transformation views. this keeps dependent generated logic aligned with the current macro definition. access macros can be opened from the repository navigation tree or from the dwh ribbon tab. the macro list supports filtering, creating new macros, deleting macros, and opening an existing macro by double-clicking the selected row. how to access navigation tree data warehouse -> macros toolbar dwh -> list -> macros diagram not direct. use the macro list or navigation tree. visual element macro detail page screen overview the macro detail page contains the following visible fields and actions. id property description 1 macro name unique macro name used when the macro is referenced from generated logic. saving requires a non-empty macro name. 2 description optional description for the macro definition. 3 language macro language selected from the configured macro languages. new macros default to language value 2. 4 referenced table optional table reference. the list includes tables that have primary-key columns, plus a none option. 5 statement reusable macro statement. the field supports multiple lines and tab input. saving requires a non-empty statement. 6 save validates required fields, saves the macro, refreshes the navigation tree, and recreates dependent transformation views when referenced macros are affected. 7 cancel returns to the previous page. if there are unsaved changes, analyticscreator asks whether to save or cancel the navigation. list behavior the macro list filters by macro name. the list grid shows name and language. new opens a new macro detail page. double-clicking a list row opens the selected macro for editing. delete removes the selected macro after confirmation. related topics entities transformation macros in the navigation tree macros list previous hierarchy nextsql script"}
,{"id":383509340373,"name":"SQL Script","type":"subsection","path":"/docs/reference/entities/entities-sql-script","breadcrumb":"Reference › Entities › SQL Script","description":"","searchText":"reference entities sql script overview a sql script is a repository entity that stores custom sql code and the execution point where that code runs in analyticscreator. sql scripts are typed so they can run around database creation, deployment, workflow execution, or repository extension processing. function use the sql script entity to maintain script metadata such as script type, script name, description, sequence number, active state, script text, and workflow-package assignments. script type controls when the script is used. available types are pre-creation, post-creation, pre-workflow, post-workflow, pre-deployment, post-deployment, and repository extension. sequence number controls ordering within the script type, and inactive keeps a script stored without running it. the script editor supports an editable original view and a read-only parsed view that shows the script after macro parsing. pre-workflow and post-workflow scripts can also be assigned to workflow packages through the package and run grid. when a script is saved, analyticscreator validates the script name, sequence number, and script text, stores the script metadata, updates workflow-package script links, and refreshes the repository navigation tree. access sql scripts can be opened from the etl ribbon tab, from the scripts branch in the repository navigation tree, from the scripts list, or from a script node in the navigation tree. how to access navigation tree data warehouse -> scripts -> script type -> script toolbar etl -> list -> scripts diagram not applicable. visual element scripts list, sql script detail page, and script nodes in the repository navigation tree. screen overview the sql script detail page contains the following visible fields, grids, and actions. id property description 1 script type execution point for the script. available values are pre-creation, post-creation, pre-workflow, post-workflow, pre-deployment, post-deployment, and repository extension. 2 name script name. saving requires a non-empty value. 3 description free-text description for the script. 4 sequence number numeric run order for scripts within the same script type. saving requires a valid number when the field is filled. 5 inactive keeps the script stored but disables it for execution. 6 original editable sql script text. saving requires a non-empty script. 7 parsed read-only preview of the script after macro parsing. 8 package / run workflow-package assignment grid shown for pre-workflow and post-workflow scripts. package shows the workflow package name, and run marks whether the script is assigned to that package. clicking the run column header toggles all run selections. 9 save validates and saves the script, updates package-script assignments, refreshes the navigation tree, and reloads the saved detail page. 10 cancel returns to the previous page. if there are unsaved changes, analyticscreator asks whether to save or cancel the navigation. list behavior the scripts list filters by script name. when the list is opened from a script-type branch, it is filtered to that script type. the etl ribbon button opens the unfiltered scripts list. the list grid shows status, name, type, hidden seqnr, and description. double-clicking a script row opens the selected script in the sql script detail page. new opens the sql script detail page for a new script. delete removes the selected script after confirmation. the up and down actions swap the selected script sequence with the adjacent row when both rows have the same script type. sql script actions the scripts branch provides refresh, import script from file, and import script from cloud. the script-type branches provide refresh, a type-specific list action, and a type-specific add action. the repository extension scripts branch also provides run repository extension scripts for active repository-extension scripts. a selected script provides edit script, delete script, export script to file, and export script to cloud. related topics entities sql script types package sql script list sql script page previous macro nextobject script"}
,{"id":383509340375,"name":"Object script","type":"subsection","path":"/docs/reference/entities/entities-object-script","breadcrumb":"Reference › Entities › Object script","description":"","searchText":"reference entities object script overview an object script is a repository entity that stores a reusable sql statement for repository objects. object scripts can be table-independent or linked to a specific analyticscreator repository table so they can be listed, edited, and run from the matching object context. function use the object script entity to maintain script metadata such as script name, description, target object table, sql statement, and script parameters. for object-related scripts, the first parameter is always the selected object id. additional parameters are stored with a parameter number, parameter name, and default value. table-independent scripts start their custom parameters at the first parameter number. when a script is saved, analyticscreator validates that the script name and statement are not empty, stores the script definition, refreshes the navigation tree, and reloads the saved detail page. the check action parses the statement with sample parameter values and validates the sql syntax with parse-only execution. access object scripts can be opened from the object scripts branch in the repository navigation tree, from the object scripts list, or from the script commands added to supported repository-object context menus. how to access navigation tree data warehouse -> object scripts -> script group -> object script toolbar not direct. use the object scripts navigation-tree branch or an object context menu. diagram not direct. visual element object scripts list, object script detail page, run object script dialog, and object script nodes in the repository navigation tree. screen overview the object script detail page contains the following visible fields, grids, and actions. id property description 1 script name object script name. saving requires a non-empty value. 2 description free-text description for the script. 3 object repository object table that the script belongs to. when a table is selected for a new script, analyticscreator can generate a sample statement that filters the table by its primary key using parameter :1. 4 first parameter of the object-related scripts is always the object id highlighted helper text explaining that object-related scripts reserve the first parameter for the selected object id. 5 parameters grid for additional script parameters. 6 paramnr read-only sequence number for the parameter. for object-related scripts, custom parameters start after the reserved object id parameter. 7 parameter parameter name used by the object script. 8 default value default value used when checking or running the script unless a different value is entered in the run dialog. 9 statement sql statement for the object script. saving requires a non-empty statement. 10 check parses the statement with sample parameter values and validates the resulting sql syntax with parse-only execution. 11 save validates and saves the object script, refreshes the navigation tree, and reloads the saved detail page. 12 cancel returns to the previous page. if there are unsaved changes, analyticscreator asks whether to save or cancel the navigation. list behavior the object scripts list filters by script name or description. when opened from an object-table branch or object context, the list is filtered to that table. the list grid shows object, name, and description. double-clicking an object script row opens the selected script in the object script detail page. new opens the object script detail page for a new script. delete removes the selected script after confirmation. run behavior supported object context menus can expose list scripts, add script, and a run script submenu for scripts linked to the selected object's repository table. the run object script dialog shows object, object id, timeout (sec), parameter rows with paramnr, parameter, and value, and a read-only result grid. running the script parses the statement with the object id and parameter values, executes it against the repository connection, displays returned rows in the result grid, and stores the last timeout value. object script actions the object scripts branch provides refresh, list object scripts, and add object script. the branch groups scripts under all scripts, table-independent scripts, and object-table groups. a selected object script provides edit object script, run object script when available, and delete object script. related topics entities object scripts navigation tree object script page run object script wizard previous sql script nextdeployment"}
,{"id":383509396699,"name":"Deployment","type":"subsection","path":"/docs/reference/entities/entities-deployment","breadcrumb":"Reference › Entities › Deployment","description":"","searchText":"reference entities deployment overview a deployment is a repository entity that defines how analyticscreator generates and deploys output artifacts from the repository. it combines the deployment name, output directory, database deployment settings, package selection, ssis configuration handling, and optional analytical model outputs. function use the deployment entity to create a reusable deployment package configuration. a deployment can generate dacpac output, selected ssis or adf package output, sqlcmd variable values, layer database variables, power bi projects, tableau models, qlik scripts, and olap scripts. the deployment editor can also run the deployment. before saving or running, analyticscreator validates the deployment name, output directory, configuration settings, database connection settings, and olap naming requirements for the selected options. saved deployments are stored with their selected packages and variables. package selections are stored separately for ssis and adf2, and deployment variables are recreated from the current editor state when the deployment is saved. access deployments can be opened from the deployment ribbon tab, from the deployments branch in the repository navigation tree, or from the deployments list. how to access navigation tree data warehouse -> deployments -> deployment toolbar deployment -> deployment package diagram not applicable. visual element deployments list, deployment detail page, and deployment nodes in the repository navigation tree. screen overview the deployment detail page contains the following visible fields, option groups, grids, and actions. id property description 1 name deployment name. saving requires a non-empty value. 2 directory output directory for generated deployment files. the directory can use the {login} alias and must exist after the alias is resolved. 3 data warehouse dacpac and target data warehouse settings, including object group, compatibility level, manual connection string, server, database name, security mode, login, password, and trust server certificate. 4 dacpac deployment options controls deployment behavior such as deploy dacpac, allow data loss, drop objects not in source, backup database before changes, block when drift detected, deploy in single user mode, allow incompatible platform, and deploy test cases. 5 allow using separate databases to store layers enables layer-variable configuration. when enabled, the dedicated layer variables grid is shown and dacpac deployment is disabled. 6 ssis settings controls how connection strings are stored: none, environment variable, configuration file, package parameter, project parameter, or all connection strings as project parameters. 7 environment variable / config file path / parameter name dynamic field whose label and required value depend on the selected ssis configuration mode. 8 other files options to create a power bi project, tableau model, or qlik script. 9 tabular olap deployment tabular model settings such as xmla script creation, server, database, login, password, service account/current user selection, cube processing, compatibility level, star selection, connector name, model name, perspectives, and partitions. 10 multidimensional olap deployment multidimensional cube settings such as xmla script creation, server, database, login, password, service account/current user selection, cube processing, compatibility level, perspectives, and partitions. 11 packages grid lists generated packages with ssis, adf2, packagename, packagetype, and description. header clicks toggle package selection or sort package rows. 12 sqlcmd variables stores variable names and values for deployment-time substitution. 13 layer variables shows one row per layer when separate layer databases are enabled. each row stores the layer and variable name. 14 log displays deployment progress messages while the deployment runs. 15 deploy / interrupt deploy saves the current settings and starts generation. interrupt cancels a running deployment process. 16 save / cancel save stores the deployment configuration. cancel returns to the previous page and prompts for unsaved changes when needed. list behavior the deployments list filters by deployment name or description. the list grid shows name and description. double-clicking a deployment row opens the selected deployment in the deployment detail page. new opens the deployment detail page for a new deployment. delete removes the selected deployment after confirmation. deployment actions the deployments branch provides refresh, list deployments, and add deployment. a selected deployment provides edit/run deployment, delete deployment, and duplicate deployment. the deployment ribbon button opens the deployments list, where existing deployments can be opened or new deployments can be created. running a deployment disables deploy, save, and cancel while the process is active, enables interrupt, and writes status messages to the log tab. related topics entities package layer model deployment toolbar deployment page previous object script nextobject group"}
,{"id":388515715288,"name":"Table Compression Type","type":"topic","path":"/docs/reference/entities/entities-deployment/parameters-deployment-table-compression-type","breadcrumb":"Reference › Entities › Deployment › Table Compression Type","description":"","searchText":"reference entities deployment table compression type overview table compression type is a deployment parameter that controls the default table compression type: 1 - none, 2 - page, 3 - row, 4 - columnstore index. function use this setting to keep deployment and generated database artifact creation consistent across the project. analyticscreator uses this value when no custom value is saved for the project. access the parameter is maintained from the parameters list in analyticscreator. how to access navigation tree parameters->list parameters toolbar options->parameter diagram not opened from the diagram. visual element parameter list default value 1 custom value not set. where it is used this parameter belongs to the deployment group and is used when analyticscreator applies deployment and generated database artifact creation. setting value technical parameter name table_compression_type default value 1 custom value not set. parameter groups group deployment database options storage related topics deployment index compression type parameters previous deployment nextindex compression type"}
,{"id":389871310016,"name":"Index Compression Type","type":"topic","path":"/docs/reference/entities/entities-deployment/parameters-deployment-index-compression-type","breadcrumb":"Reference › Entities › Deployment › Index Compression Type","description":"","searchText":"reference entities deployment index compression type overview index compression type is a deployment parameter that controls the default index compression type when the table compression type is none or columnstore index (otherwise indexes will have the same compression type as tables): 1-none, 2-page, 3-row. function use this setting to keep deployment and generated database artifact creation consistent across the project. analyticscreator uses this value when no custom value is saved for the project. access the parameter is maintained from the parameters list in analyticscreator. how to access navigation tree parameters->list parameters toolbar options->parameter diagram not opened from the diagram. visual element parameter list default value 1 custom value not set. where it is used this parameter belongs to the deployment group and is used when analyticscreator applies deployment and generated database artifact creation. setting value technical parameter name index_compression_type default value 1 custom value not set. parameter groups group deployment database options storage related topics deployment dwh metadata in extended properties table compression type parameters previous table compression type nextdeployment do not drop object types"}
,{"id":389871310017,"name":"Deployment Do Not Drop Object Types","type":"topic","path":"/docs/reference/entities/entities-deployment/parameters-deployment-deployment-do-not-drop-object-types","breadcrumb":"Reference › Entities › Deployment › Deployment Do Not Drop Object Types","description":"","searchText":"reference entities deployment deployment do not drop object types overview deployment do not drop object types is a deployment parameter that controls the comma-separated list of object types (see the description of sqlpackage.exe). function use this setting to keep deployment and generated database artifact creation consistent across the project. analyticscreator uses this value when no custom value is saved for the project. access the parameter is maintained from the parameters list in analyticscreator. how to access navigation tree parameters->list parameters toolbar options->parameter diagram not opened from the diagram. visual element parameter list default value aggregates,applicationroles,assemblies,asymmetrickeys,brokerpriorities,certificates,contracts,databaseroles,databasetriggers,fulltextcatalogs,fulltextstoplists,messagetypes,partitionfunctions,partitionschemes,permissions,queues,remoteservicebindings,rolemembership,rules,searchpropertylists,sequences,services,signatures,symmetrickeys,synonyms,userdefineddatatypes,userdefinedtabletypes,clruserdefinedtypes,users,xmlschemacollections,audits,credentials,cryptographicproviders,databaseauditspecifications,endpoints,errormessages,eventnotifications,eventsessions,linkedserverlogins,linkedservers,logins,routes,serverauditspecifications,serverrolemembership,serverroles,servertriggers custom value not set. where it is used this parameter belongs to the deployment group and is used when analyticscreator applies deployment and generated database artifact creation. setting value technical parameter name deployment_do_not_drop_object_types default value aggregates,applicationroles,assemblies,asymmetrickeys,brokerpriorities,certificates,contracts,databaseroles,databasetriggers,fulltextcatalogs,fulltextstoplists,messagetypes,partitionfunctions,partitionschemes,permissions,queues,remoteservicebindings,rolemembership,rules,searchpropertylists,sequences,services,signatures,symmetrickeys,synonyms,userdefineddatatypes,userdefinedtabletypes,clruserdefinedtypes,users,xmlschemacollections,audits,credentials,cryptographicproviders,databaseauditspecifications,endpoints,errormessages,eventnotifications,eventsessions,linkedserverlogins,linkedservers,logins,routes,serverauditspecifications,serverrolemembership,serverroles,servertriggers custom value not set. parameter groups group deployment database options storage related topics deployment deployment create subdirectory dwh metadata in extended properties parameters previous index compression type nextdeployment create subdirectory"}
,{"id":388515715281,"name":"Deployment Create Subdirectory","type":"topic","path":"/docs/reference/entities/entities-deployment/parameters-deployment-deployment-create-subdirectory","breadcrumb":"Reference › Entities › Deployment › Deployment Create Subdirectory","description":"","searchText":"reference entities deployment deployment create subdirectory overview deployment create subdirectory is a deployment parameter that controls whether analyticscreator creates a subdirectory for every created deployment package. 0-no (all files in output directory will be deleted), 1-yes. default - 1. function use this setting to keep deployment and generated database artifact creation consistent across the project. analyticscreator uses this value when no custom value is saved for the project. access the parameter is maintained from the parameters list in analyticscreator. how to access navigation tree parameters->list parameters toolbar options->parameter diagram not opened from the diagram. visual element parameter list default value 1 custom value not set. where it is used this parameter belongs to the deployment group and is used when analyticscreator applies deployment and generated database artifact creation. setting value technical parameter name deployment_create_subdirectory default value 1 custom value not set. parameter groups group deployment database options storage related topics deployment dacpac model storage type deployment do not drop object types parameters previous deployment do not drop object types nextdacpac model storage type"}
,{"id":389871310018,"name":"DACPAC Model Storage Type","type":"topic","path":"/docs/reference/entities/entities-deployment/parameters-deployment-dacpac-model-storage-type","breadcrumb":"Reference › Entities › Deployment › DACPAC Model Storage Type","description":"","searchText":"reference entities deployment dacpac model storage type overview dacpac model storage type is a deployment parameter that controls the dacpac model storage type: 0 - file, 1 - memory. function use this setting to keep deployment and generated database artifact creation consistent across the project. analyticscreator uses this value when no custom value is saved for the project. access the parameter is maintained from the parameters list in analyticscreator. how to access navigation tree parameters->list parameters toolbar options->parameter diagram not opened from the diagram. visual element parameter list default value 1 custom value not set. where it is used this parameter belongs to the deployment group and is used when analyticscreator applies deployment and generated database artifact creation. setting value technical parameter name dacpac_model_storage_type default value 1 custom value not set. parameter groups group deployment database options storage related topics deployment deployment create subdirectory parameters previous deployment create subdirectory nextdwh metadata in extended properties"}
,{"id":388515715283,"name":"DWH Metadata In Extended Properties","type":"topic","path":"/docs/reference/entities/entities-deployment/parameters-deployment-dwh-metadata-in-extended-properties","breadcrumb":"Reference › Entities › Deployment › DWH Metadata In Extended Properties","description":"","searchText":"reference entities deployment dwh metadata in extended properties overview dwh metadata in extended properties is a deployment parameter that controls whether metadata is stored as extended properties of database objects. function use this setting to keep deployment and generated database artifact creation consistent across the project. analyticscreator uses this value when no custom value is saved for the project. access the parameter is maintained from the parameters list in analyticscreator. how to access navigation tree parameters->list parameters toolbar options->parameter diagram not opened from the diagram. visual element parameter list default value 1 custom value not set. where it is used this parameter belongs to the deployment group and is used when analyticscreator applies deployment and generated database artifact creation. setting value technical parameter name dwh_metadata_in_extended_properties default value 1 custom value not set. parameter groups group deployment database options storage related topics deployment deployment do not drop object types index compression type parameters previous dacpac model storage type nexthistorization"}
,{"id":383509396700,"name":"Object group","type":"subsection","path":"/docs/reference/entities/entities-object-group","breadcrumb":"Reference › Entities › Object group","description":"","searchText":"reference entities object group overview an object group is a repository entity that organizes warehouse objects into named groups. object groups are used to filter the architecture diagram, manage group-specific object membership, inherit membership through object dependencies, and lock grouped objects for a repository user. function use the object group entity to maintain group metadata such as name, description, workflow behavior, ssis configuration script names, and lock ownership. object group membership connects a group to repository objects. membership can be direct or inherited. direct membership can inherit predecessors, inherit successors, or both. inherited rows show the parent objects that caused the inheritance and can be excluded without deleting the original direct membership rule. when object groups are saved, analyticscreator stores group definitions, updates object membership rows, recalculates inherited memberships, removes stale inherited rows, and refreshes group-based locks. access object groups can be opened from the groups branch in the repository navigation tree, from a selected group node, or from the object groups command on supported objects in the architecture diagram. how to access navigation tree data warehouse -> groups -> group toolbar group selector filters the diagram by group. group maintenance is opened from the navigation tree or diagram context menu. diagram supported object -> object groups visual element groups dialog, object group content list, group selector, and group nodes in the repository navigation tree. screen overview the groups dialog contains the following visible fields, membership controls, and actions. id property description 1 member marks whether the current object belongs to the group. this column is shown when the dialog is opened for a specific object. 2 inherit predecessors extends direct membership to predecessor objects. the option cannot be enabled on inherited membership rows. 3 inherit successors extends direct membership to successor objects. the option cannot be enabled on inherited membership rows. 4 inherited read-only membership state created by inheritance rules. users cannot activate this flag manually. 5 exclude excludes an inherited object from the group. this option is only valid for inherited membership rows. 6 name group name. group names are unique in the repository. 7 description free-text description for the group. 8 create workflow marks the group as workflow-enabled. when enabled, analyticscreator can auto-fill the ssis configuration script file names from the group name. 9 ssis__configuration complete script workflow script file name for the complete configuration script. when create workflow is disabled, the value is cleared. 10 ssis__configuration enable script workflow script file name for enabling the configuration. when create workflow is disabled, the value is cleared. 11 ssis__configuration disable script workflow script file name for disabling the configuration. when create workflow is disabled, the value is cleared. 12 inherited from objects read-only list of parent objects that caused inherited membership. 13 locked by repository login that owns the group lock. locked group objects are written to repository locks during object-group recalculation. 14 lock / unlock lock assigns the current repository login to the selected group when it is unlocked. unlock is allowed for the locking user or repository owner. 15 save stores group definitions and object membership, recalculates inherited object groups, refreshes group locks, and closes the dialog. 16 cancel closes the dialog without saving the current edits. object group content the object group content list filters by group name or object name. when opened from a selected group node, the list is filtered to that group and the group column is hidden. the list grid shows group, object, inherit predecessors, inherit successors, inherited, exclude, and inherited from objects. new membership rows can be added in the grid. saving validates the inheritance options before writing the changes. object group actions the groups branch provides refresh, list groups, and add group. a selected group provides set diagram filter, edit group, list objects, delete group, lock group, and unlock group. the group selector in the main window can switch the active diagram filter between all groups and a selected object group. the dataflow diagram exposes object groups on supported objects so membership can be edited directly for that object. related topics entities object groups dialog object group content list object groups diagram previous deployment nextfilter"}
,{"id":383509396701,"name":"Filter","type":"subsection","path":"/docs/reference/entities/entities-filter","breadcrumb":"Reference › Entities › Filter","description":"","searchText":"reference entities filter overview a filter is a repository entity that stores the current dataflow diagram filter in analyticscreator. it saves a named set of objects so the same subset of the architecture diagram can be applied again later. function use the filter entity to keep a reusable diagram scope. a filter is created from the objects currently held in the diagram filter, stored with a filter name, and then listed under the filters node in the repository tree. when a saved filter is applied, analyticscreator loads the objects assigned to that filter and refreshes the architecture diagram with only that scope. the main window also shows the active object names in the actual filter field. a filter contains a required name and one or more object links. the repository stores the filter header in cfg.filters and the assigned objects in cfg.filter_objects. access filters are accessed from the repository navigation tree and from the architecture diagram context menus. there is no separate filter detail page; the filter name is entered in a small input dialog when the current diagram filter is stored. how to access navigation tree data warehouse -> filters toolbar no direct ribbon list command. use the repository tree or the architecture diagram filter controls. diagram architecture object -> set filter or add to filter -> store filter visual element filters tree node, saved filter entries, and the actual filter field in the architecture view. screen overview the filter entity is maintained through the navigation-tree and architecture-diagram controls below. id property description 1 filters repository tree node below data warehouse. expanding the node lists saved filters ordered by name. 2 store current filter command on the filters node. it stores the current diagram filter as a saved filter. 3 filter name input dialog field shown when a filter is stored. the name is required and must be unique. 4 saved filter entry child item below filters. each entry represents one row in cfg.filters and the related object rows in cfg.filter_objects. 5 apply filter command on a saved filter. it resolves the assigned object ids, refreshes the architecture diagram, and sets the active diagram filter to those objects. 6 delete filter removes the selected saved filter. the related filter-object rows are removed through the filter relationship. 7 set filter architecture object context-menu command. it replaces the active diagram filter with the selected object. 8 add to filter architecture object context-menu command. it adds the selected object to the active diagram filter. 9 store filter architecture context-menu command. it opens the same storage flow as store current filter. 10 remove filter architecture context-menu command. it clears the active diagram filter and refreshes the architecture view. 11 actual filter read-only main-window field that displays the comma-separated object names in the active filter. filter behavior store current filter requires an active diagram filter. if the current filter is empty, analyticscreator shows the message that the filter cannot be created because the current filter is empty. the filter name cannot be blank. if a filter with the same name already exists, the save is blocked. saved filters are listed from cfg.filters ordered by name. applying a saved filter reads each assigned object from cfg.filter_objects and refreshes the architecture diagram with those objects. when a filter is applied or changed from the diagram, analyticscreator refreshes the architecture page and updates the actual filter field. during definition import, existing filters can be reused by name or renamed to avoid a collision, depending on the import reuse option. related topics entities filters navigation tree filters dataflow diagram object group previous object group nextmodel"}
,{"id":383509396702,"name":"Model","type":"subsection","path":"/docs/reference/entities/entities-model","breadcrumb":"Reference › Entities › Model","description":"","searchText":"reference entities model overview a model is a data mart entity used to define a semantic model in analyticscreator. a model groups dimensions and facts so they can be maintained as metadata, imported or exported, and used to generate the related transformation structure. function use the model entity to maintain model metadata and organize related model dimensions and facts. the models list stores the model name and description, while model dimensions and model facts define the detailed dimensional structure below the selected model. models can also be created from star transformations or stars. when analyticscreator creates a model from a transformation, it creates the model record when needed, adds a default calendar dimension, and adds model dimensions, model facts, measures, and fact-dimension links from the transformation metadata. the reverse action is also supported: creating transformations from a model creates the required data mart prerequisites, then creates dimension and fact transformations from the model definition and refreshes the interface. access models can be opened from the repository navigation tree or from the data mart ribbon tab. the models node supports listing, adding, and importing models. a selected model supports editing, deleting, creating transformations, and exporting the model to a file or cloud location. how to access navigation tree data warehouse -> models toolbar data mart -> list -> models diagram indirect. use the diagram model menu to create a model or add a star transformation to an existing model. visual element models list screen overview the models list contains the following visible fields and actions. id property description 1 search criteria filter area used to search model records by name or description. 2 search runs the filter entered in the search field. pressing enter in the filter field runs the same search. 3 delete filter clears the filter text and reloads the full model list. 4 name model name shown in the list and under the models node in the navigation tree. model names are stored as unique repository values. 5 description optional description for the model. the description can be edited directly in the list. 6 save saves model list changes and refreshes the page after saving. 7 cancel returns to the previous page. if there are unsaved changes, analyticscreator asks whether to save or cancel the navigation. model structure a model contains model dimensions and model facts. new model records receive a default dim_calendar dimension with the description calendar dimension. model dimensions define a name, friendly name, description, historized flag, and attribute rows with key-column marking. model facts define a name, friendly name, description, measure rows, and links to model dimensions. the navigation tree shows non-calendar model dimensions and model facts below the selected model. model actions list models and add model open the models list. edit model opens the models list with the selected model highlighted. create transformations generates dimension and fact transformations from the selected model. import model from file and import model from cloud load model structure imports. export model to file and export model to cloud export the selected model structure. related topics entities transformation models in the navigation tree models list model dimension page model fact page previous filter nextparameters"}
,{"id":383461259457,"name":"Parameters","type":"section","path":"/docs/reference/parameters","breadcrumb":"Reference › Parameters","description":"","searchText":"reference parameters parameters are configuration values that control how analyticscreator imports metadata, generates objects, refreshes sources, builds packages, deploys artifacts, and applies project-wide conventions. use this section to look up a setting, understand the default value, and find the parameter group that controls a specific part of the data warehouse lifecycle. parameter groups data vault controls data vault generation behavior and relationship naming. open data vault sap connector configures sap connector defaults and sap-specific import behavior. open sap connector source refresh controls metadata refresh and source-preview behavior. open source refresh dwh wizard defines defaults used when the dwh wizard creates generated structures. open dwh wizard transformations controls transformation naming, relation use, calendar fields, and generated views. open transformations ssis packages controls generated ssis package buffering, fast-load, and execution behavior. open ssis packages csv import controls how csv files are scanned and interpreted during source import. open csv import synchronization configures synchronization, retry, and metadata-update behavior. open synchronization engine timeout defines timeout behavior for engine-driven execution tasks. open engine timeout deployment configures generated database objects and deployment artifacts. open deployment historization configures historization and persisting behavior. open historization diagrams controls diagram export behavior and thumbnail diagram display settings. open diagrams governance controls inheritance and anonymization behavior for governed metadata. open governance naming & metadata defines naming, friendly-name, description, and display-folder patterns. open naming & metadata references configures generated references and relationship inheritance. open references connectors stores connector-specific defaults and connection-related values. open connectors repository names defines naming labels used for repository layers. open repository names logging controls diagnostic logging behavior. open logging semantic model controls default semantic-model naming and display-folder behavior. open semantic model sql templates stores sql templates and variables used during generated sql execution. open sql templates source import controls source import query behavior. open source import project limits controls project file-name and file-path restrictions. open project limits technical configuration parameters highlights technical settings that also appear in functional parameter groups. open technical configuration parameters other parameters reserved for parameters that do not have a more specific functional group. open other parameters previous model nextdata vault"}
,{"id":389870784705,"name":"Data Vault","type":"subsection","path":"/docs/reference/parameters/parameters-data-vault","breadcrumb":"Reference › Parameters › Data Vault","description":"","searchText":"reference parameters data vault controls data vault generation behavior and relationship naming. use this page to find the data vault settings, review their defaults, and open the detailed parameter pages. available parameters parameter technical name default value purpose data vault 2 create hubs datavault2_create_hubs 1 data vault 2 create hubs: 0 - no, 1 - yes. show hub deps show_hub_deps 0 show vault hub dependencies. vault fk field name pattern vault_fk_fieldname_pattern vault_hub_id_{tablename} autogenerated foreign key field name corresponding to the vault hub id. you can use {schemaname}, {tablename}, {friendlyname}, {schemaid}, {tableid} and {columnname} placeholders. previous parameters nextvault fk field name pattern"}
,{"id":389871308993,"name":"Vault FK Field Name Pattern","type":"topic","path":"/docs/reference/parameters/parameters-data-vault/parameters-data-vault-vault-fk-field-name-pattern","breadcrumb":"Reference › Parameters › Data Vault › Vault FK Field Name Pattern","description":"","searchText":"reference parameters data vault vault fk field name pattern overview vault fk field name pattern is a data vault parameter that defines the autogenerated foreign key field name corresponding to the vault hub id. you can use {schemaname}, {tablename}, {friendlyname}, {schemaid}, {tableid} and {columnname} placeholders. function use this setting to keep data vault object generation consistent across the project. analyticscreator uses this value when no custom value is saved for the project. keep placeholder names unchanged when adapting the pattern. this value supports placeholders such as {tablename}, {schemaname}, {friendlyname}, {schemaid}, {tableid}, {columnname}. access the parameter is maintained from the parameters list in analyticscreator. how to access navigation tree parameters->list parameters toolbar options->parameter diagram not opened from the diagram. visual element parameter list default value vault_hub_id_{tablename} custom value not set. where it is used this parameter belongs to the data vault group and is used when analyticscreator applies data vault object generation. setting value technical parameter name vault_fk_fieldname_pattern default value vault_hub_id_{tablename} custom value not set. parameter groups group data vault vault & deps vault related topics data vault show hub deps parameters previous data vault nextshow hub deps"}
,{"id":389871308994,"name":"Show Hub Deps","type":"topic","path":"/docs/reference/parameters/parameters-data-vault/parameters-data-vault-show-hub-deps","breadcrumb":"Reference › Parameters › Data Vault › Show Hub Deps","description":"","searchText":"reference parameters data vault show hub deps overview show hub deps is a data vault parameter that controls whether analyticscreator shows vault hub dependencies. function use this setting to keep data vault object generation consistent across the project. analyticscreator uses this value when no custom value is saved for the project. access the parameter is maintained from the parameters list in analyticscreator. how to access navigation tree parameters->list parameters toolbar options->parameter diagram not opened from the diagram. visual element parameter list default value 0 custom value not set. where it is used this parameter belongs to the data vault group and is used when analyticscreator applies data vault object generation. setting value technical parameter name show_hub_deps default value 0 custom value not set. parameter groups group data vault vault & deps vault related topics data vault data vault 2 create hubs vault fk field name pattern parameters previous vault fk field name pattern nextdata vault 2 create hubs"}
,{"id":389871308995,"name":"Data Vault 2 Create Hubs","type":"topic","path":"/docs/reference/parameters/parameters-data-vault/parameters-data-vault-data-vault-2-create-hubs","breadcrumb":"Reference › Parameters › Data Vault › Data Vault 2 Create Hubs","description":"","searchText":"reference parameters data vault data vault 2 create hubs overview data vault 2 create hubs is a data vault parameter that controls whether data vault 2 hubs are created (0 - no, 1 - yes). function use this setting to keep data vault object generation consistent across the project. numeric values in this parameter act as choices; use the description to interpret each option. access the parameter is maintained from the parameters list in analyticscreator. how to access navigation tree parameters->list parameters toolbar options->parameter diagram not opened from the diagram. visual element parameter list default value 1 custom value not set. where it is used this parameter belongs to the data vault group and is used when analyticscreator applies data vault object generation. setting value technical parameter name datavault2_create_hubs default value 1 custom value not set. parameter groups group data vault vault & deps vault related topics data vault show hub deps parameters previous show hub deps nextsap connector"}
,{"id":389870784706,"name":"SAP Connector","type":"subsection","path":"/docs/reference/parameters/parameters-sap-connector","breadcrumb":"Reference › Parameters › SAP Connector","description":"","searchText":"reference parameters sap connector configures sap connector defaults and sap-specific import behavior. use this page to find the sap connector settings, review their defaults, and open the detailed parameter pages. available parameters parameter technical name default value purpose sap ac custom function name sap_ac_custom_function_name z_xtract_is_table sap custom function name for analyticscreator. the default sap function is rfc_read_table. sap automatic date conversion sap_automatic_date_conversion 0 sap automatic date conversion. 0 - no, 1 - yes. sap deltaq autosync sap_deltaq_autosync 1 0 - disable, 1 - enable. sap deltaq transfermode sap_deltaq_transfermode t i - idoc, t - trfc. sap description language sap_description_language e sap language to get table and field descriptions. sap max record count sap_max_record_count 1000 max count of records returned by sap. sap p type additional length sap_p_type_additional_length 1 sap: sometimes the length of the p type columns should be increased by this parameter. sap ssis custom function name sap_ssis_custom_function_name z_xtract_is_table_compression sap custom function name for theobald connector in ssis packages. please read theobald documentation about xtractis to get the correct function name. sap substitution date value sap_substitution_date_value 1970-01-01 sap value for invalid date (yyyyymmdd) in case automatic date conversion is on. sap substitution maxdate value sap_substitution_maxdate_value 2099-12-31 sap value for 9999xxxx date (yyyymmdd) in case automatic data conversion is on. sap substitution mindate value sap_substitution_mindate_value 1970-01-01 sap value for 0000xxxx date (yyyymmdd) in case automatic data conversion is on. sap theobald version sap_theobald_version 0 0 - match the sql server version, or a number (2008, 2012, etc.). previous data vault 2 create hubs nextsap ssis custom function name"}
,{"id":389871308996,"name":"SAP SSIS Custom Function Name","type":"topic","path":"/docs/reference/parameters/parameters-sap-connector/parameters-sap-connector-sap-ssis-custom-function-name","breadcrumb":"Reference › Parameters › SAP Connector › SAP SSIS Custom Function Name","description":"","searchText":"reference parameters sap connector sap ssis custom function name overview sap ssis custom function name is a sap connector parameter that controls the sap custom function name for the theobald connector in ssis packages. please read theobald documentation about xtractis to get the correct function name. function use this setting to keep sap source handling consistent across the project. analyticscreator uses this value when no custom value is saved for the project. access the parameter is maintained from the parameters list in analyticscreator. how to access navigation tree parameters->list parameters toolbar options->parameter diagram not opened from the diagram. visual element parameter list default value z_xtract_is_table_compression custom value not set. where it is used this parameter belongs to the sap connector group and is used when analyticscreator applies sap source handling. setting value technical parameter name sap_ssis_custom_function_name default value z_xtract_is_table_compression custom value not set. parameter groups group sap connector sap settings sap related topics sap connector sap p type additional length sap substitution date value parameters previous sap connector nextsap ac custom function name"}
,{"id":389871308997,"name":"SAP AC Custom Function Name","type":"topic","path":"/docs/reference/parameters/parameters-sap-connector/parameters-sap-connector-sap-ac-custom-function-name","breadcrumb":"Reference › Parameters › SAP Connector › SAP AC Custom Function Name","description":"","searchText":"reference parameters sap connector sap ac custom function name overview sap ac custom function name is a sap connector parameter that controls the sap custom function name for analyticscreator. the default sap function is rfc_read_table. function use this setting to keep sap source handling consistent across the project. analyticscreator uses this value when no custom value is saved for the project. access the parameter is maintained from the parameters list in analyticscreator. how to access navigation tree parameters->list parameters toolbar options->parameter diagram not opened from the diagram. visual element parameter list default value z_xtract_is_table custom value not set. where it is used this parameter belongs to the sap connector group and is used when analyticscreator applies sap source handling. setting value technical parameter name sap_ac_custom_function_name default value z_xtract_is_table custom value not set. parameter groups group sap connector sap settings sap related topics sap connector sap automatic date conversion parameters previous sap ssis custom function name nextsap automatic date conversion"}
,{"id":389871308998,"name":"SAP Automatic Date Conversion","type":"topic","path":"/docs/reference/parameters/parameters-sap-connector/parameters-sap-connector-sap-automatic-date-conversion","breadcrumb":"Reference › Parameters › SAP Connector › SAP Automatic Date Conversion","description":"","searchText":"reference parameters sap connector sap automatic date conversion overview sap automatic date conversion is a sap connector parameter that controls sap automatic date conversion. 0 - no, 1 - yes. function use this setting to keep sap source handling consistent across the project. numeric values in this parameter act as choices; use the description to interpret each option. access the parameter is maintained from the parameters list in analyticscreator. how to access navigation tree parameters->list parameters toolbar options->parameter diagram not opened from the diagram. visual element parameter list default value 0 custom value not set. where it is used this parameter belongs to the sap connector group and is used when analyticscreator applies sap source handling. setting value technical parameter name sap_automatic_date_conversion default value 0 custom value not set. parameter groups group sap connector sap settings sap related topics sap connector sap ac custom function name sap deltaq autosync parameters previous sap ac custom function name nextsap substitution date value"}
,{"id":389871308999,"name":"SAP Substitution Date Value","type":"topic","path":"/docs/reference/parameters/parameters-sap-connector/parameters-sap-connector-sap-substitution-date-value","breadcrumb":"Reference › Parameters › SAP Connector › SAP Substitution Date Value","description":"","searchText":"reference parameters sap connector sap substitution date value overview sap substitution date value is a sap connector parameter that controls the sap value for invalid dates (yyyyymmdd) in case automatic date conversion is on. function use this setting to keep sap source handling consistent across the project. analyticscreator uses this value when no custom value is saved for the project. access the parameter is maintained from the parameters list in analyticscreator. how to access navigation tree parameters->list parameters toolbar options->parameter diagram not opened from the diagram. visual element parameter list default value 1970-01-01 custom value not set. where it is used this parameter belongs to the sap connector group and is used when analyticscreator applies sap source handling. setting value technical parameter name sap_substitution_date_value default value 1970-01-01 custom value not set. parameter groups group sap connector sap settings sap related topics sap connector sap ssis custom function name sap substitution maxdate value parameters previous sap automatic date conversion nextsap substitution mindate value"}
,{"id":389871309000,"name":"SAP Substitution Mindate Value","type":"topic","path":"/docs/reference/parameters/parameters-sap-connector/parameters-sap-connector-sap-substitution-mindate-value","breadcrumb":"Reference › Parameters › SAP Connector › SAP Substitution Mindate Value","description":"","searchText":"reference parameters sap connector sap substitution mindate value overview sap substitution mindate value is a sap connector parameter that controls the sap value for 0000xxxx dates (yyyyymmdd) in case automatic date conversion is on. function use this setting to keep sap source handling consistent across the project. analyticscreator uses this value when no custom value is saved for the project. access the parameter is maintained from the parameters list in analyticscreator. how to access navigation tree parameters->list parameters toolbar options->parameter diagram not opened from the diagram. visual element parameter list default value 1970-01-01 custom value not set. where it is used this parameter belongs to the sap connector group and is used when analyticscreator applies sap source handling. setting value technical parameter name sap_substitution_mindate_value default value 1970-01-01 custom value not set. parameter groups group sap connector sap settings sap related topics sap connector sap substitution maxdate value sap theobald version parameters previous sap substitution date value nextsap substitution maxdate value"}
,{"id":389871309001,"name":"SAP Substitution Maxdate Value","type":"topic","path":"/docs/reference/parameters/parameters-sap-connector/parameters-sap-connector-sap-substitution-maxdate-value","breadcrumb":"Reference › Parameters › SAP Connector › SAP Substitution Maxdate Value","description":"","searchText":"reference parameters sap connector sap substitution maxdate value overview sap substitution maxdate value is a sap connector parameter that controls the sap value for 9999xxxx dates (yyyyymmdd) in case automatic date conversion is on. function use this setting to keep sap source handling consistent across the project. analyticscreator uses this value when no custom value is saved for the project. access the parameter is maintained from the parameters list in analyticscreator. how to access navigation tree parameters->list parameters toolbar options->parameter diagram not opened from the diagram. visual element parameter list default value 2099-12-31 custom value not set. where it is used this parameter belongs to the sap connector group and is used when analyticscreator applies sap source handling. setting value technical parameter name sap_substitution_maxdate_value default value 2099-12-31 custom value not set. parameter groups group sap connector sap settings sap related topics sap connector sap substitution date value sap substitution mindate value parameters previous sap substitution mindate value nextsap p type additional length"}
,{"id":389871309002,"name":"SAP P Type Additional Length","type":"topic","path":"/docs/reference/parameters/parameters-sap-connector/parameters-sap-connector-sap-p-type-additional-length","breadcrumb":"Reference › Parameters › SAP Connector › SAP P Type Additional Length","description":"","searchText":"reference parameters sap connector sap p type additional length overview sap p type additional length is a sap connector parameter that controls the additional length added to sap p-type columns. sometimes the length of the p type columns should be increased by this parameter. function use this setting to keep sap source handling consistent across the project. analyticscreator uses this value when no custom value is saved for the project. access the parameter is maintained from the parameters list in analyticscreator. how to access navigation tree parameters->list parameters toolbar options->parameter diagram not opened from the diagram. visual element parameter list default value 1 custom value not set. where it is used this parameter belongs to the sap connector group and is used when analyticscreator applies sap source handling. setting value technical parameter name sap_p_type_additional_length default value 1 custom value not set. parameter groups group sap connector sap settings sap related topics sap connector sap max record count sap ssis custom function name parameters previous sap substitution maxdate value nextsap deltaq transfermode"}
,{"id":389871309003,"name":"SAP Deltaq Transfermode","type":"topic","path":"/docs/reference/parameters/parameters-sap-connector/parameters-sap-connector-sap-deltaq-transfermode","breadcrumb":"Reference › Parameters › SAP Connector › SAP Deltaq Transfermode","description":"","searchText":"reference parameters sap connector sap deltaq transfermode overview sap deltaq transfermode is a sap connector parameter that controls the sap deltaq transfer mode: i - idoc, t - trfc. function use this setting to keep sap source handling consistent across the project. analyticscreator uses this value when no custom value is saved for the project. access the parameter is maintained from the parameters list in analyticscreator. how to access navigation tree parameters->list parameters toolbar options->parameter diagram not opened from the diagram. visual element parameter list default value t custom value not set. where it is used this parameter belongs to the sap connector group and is used when analyticscreator applies sap source handling. setting value technical parameter name sap_deltaq_transfermode default value t custom value not set. parameter groups group sap connector sap settings sap related topics sap connector sap deltaq autosync sap description language parameters previous sap p type additional length nextsap deltaq autosync"}
,{"id":389871309004,"name":"SAP Deltaq Autosync","type":"topic","path":"/docs/reference/parameters/parameters-sap-connector/parameters-sap-connector-sap-deltaq-autosync","breadcrumb":"Reference › Parameters › SAP Connector › SAP Deltaq Autosync","description":"","searchText":"reference parameters sap connector sap deltaq autosync overview sap deltaq autosync is a sap connector parameter that enables or disables automatic synchronization for sap deltaq extraction. 0 - disable, 1 - enable. function use this setting to keep sap source handling consistent across the project. analyticscreator uses this value when no custom value is saved for the project. access the parameter is maintained from the parameters list in analyticscreator. how to access navigation tree parameters->list parameters toolbar options->parameter diagram not opened from the diagram. visual element parameter list default value 1 custom value not set. where it is used this parameter belongs to the sap connector group and is used when analyticscreator applies sap source handling. setting value technical parameter name sap_deltaq_autosync default value 1 custom value not set. parameter groups group sap connector sap settings sap related topics sap connector sap automatic date conversion sap deltaq transfermode parameters previous sap deltaq transfermode nextsap max record count"}
,{"id":389871309005,"name":"SAP Max Record Count","type":"topic","path":"/docs/reference/parameters/parameters-sap-connector/parameters-sap-connector-sap-max-record-count","breadcrumb":"Reference › Parameters › SAP Connector › SAP Max Record Count","description":"","searchText":"reference parameters sap connector sap max record count overview sap max record count is a sap connector parameter that controls the max count of records returned by sap. function use this setting to keep sap source handling consistent across the project. analyticscreator uses this value when no custom value is saved for the project. access the parameter is maintained from the parameters list in analyticscreator. how to access navigation tree parameters->list parameters toolbar options->parameter diagram not opened from the diagram. visual element parameter list default value 1000 custom value not set. where it is used this parameter belongs to the sap connector group and is used when analyticscreator applies sap source handling. setting value technical parameter name sap_max_record_count default value 1000 custom value not set. parameter groups group sap connector sap settings sap related topics sap connector sap description language sap p type additional length parameters previous sap deltaq autosync nextsap theobald version"}
,{"id":389871309006,"name":"SAP Theobald Version","type":"topic","path":"/docs/reference/parameters/parameters-sap-connector/parameters-sap-connector-sap-theobald-version","breadcrumb":"Reference › Parameters › SAP Connector › SAP Theobald Version","description":"","searchText":"reference parameters sap connector sap theobald version overview sap theobald version is a sap connector parameter that sets the theobald/sql server version used for sap extraction. 0 - match the sql server version, or a number (2008, 2012, etc.). function use this setting to keep sap source handling consistent across the project. analyticscreator uses this value when no custom value is saved for the project. access the parameter is maintained from the parameters list in analyticscreator. how to access navigation tree parameters->list parameters toolbar options->parameter diagram not opened from the diagram. visual element parameter list default value 0 custom value not set. where it is used this parameter belongs to the sap connector group and is used when analyticscreator applies sap source handling. setting value technical parameter name sap_theobald_version default value 0 custom value not set. parameter groups group sap connector sap settings sap related topics sap connector sap substitution mindate value parameters previous sap max record count nextsap description language"}
,{"id":389871309007,"name":"SAP Description Language","type":"topic","path":"/docs/reference/parameters/parameters-sap-connector/parameters-sap-connector-sap-description-language","breadcrumb":"Reference › Parameters › SAP Connector › SAP Description Language","description":"","searchText":"reference parameters sap connector sap description language overview sap description language is a sap connector parameter that controls the sap language used to get table and field descriptions. function use this setting to keep sap source handling consistent across the project. analyticscreator uses this value when no custom value is saved for the project. access the parameter is maintained from the parameters list in analyticscreator. how to access navigation tree parameters->list parameters toolbar options->parameter diagram not opened from the diagram. visual element parameter list default value e custom value not set. where it is used this parameter belongs to the sap connector group and is used when analyticscreator applies sap source handling. setting value technical parameter name sap_description_language default value e custom value not set. parameter groups group sap connector sap settings sap related topics sap connector sap deltaq transfermode sap max record count parameters previous sap theobald version nextsource refresh"}
,{"id":389870784707,"name":"Source Refresh","type":"subsection","path":"/docs/reference/parameters/parameters-source-refresh","breadcrumb":"Reference › Parameters › Source Refresh","description":"","searchText":"reference parameters source refresh controls metadata refresh and source-preview behavior. use this page to find the source refresh settings, review their defaults, and open the detailed parameter pages. available parameters parameter technical name default value purpose source preview rows source_preview_rows 100 count of rows returned during preview. source preview timeout source_preview_timeout 180 timeout for source preview, sec. source refresh del missing imp cols source_refresh_del_missing_imp_cols 0 source refresh - delete missing import columns: 0 - no, 1 - yes. source refresh del missing sources source_refresh_del_missing_sources 0 source refresh - delete missing sources: 0 - no, 1 - yes. source refresh existing columns source_refresh_existing_columns 0 source refresh - refresh existing source columns: 0 - no, 1 - yes. source refresh references source_refresh_references 0 source refresh - refresh source references: 0 - no, 1 - yes. source refresh refresh imp cols source_refresh_refresh_imp_cols 0 source refresh - refresh import columns: 0 - no, 1 - yes. source refresh refresh imp desc source_refresh_refresh_imp_desc 0 source refresh - refresh import descriptions: 0 - no, 1 - yes. source refresh refresh pk source_refresh_refresh_pk 0 source refresh - refresh primary keys in import tables: 0 - no, 1 - yes. source refresh refresh src desc source_refresh_refresh_src_desc 0 source refresh - refresh source descriptions: 0 - no, 1 - yes. previous sap description language nextsource preview rows"}
,{"id":389871309008,"name":"Source Preview Rows","type":"topic","path":"/docs/reference/parameters/parameters-source-refresh/parameters-source-refresh-source-preview-rows","breadcrumb":"Reference › Parameters › Source Refresh › Source Preview Rows","description":"","searchText":"reference parameters source refresh source preview rows overview source preview rows is a source refresh parameter that sets the number of rows returned during preview. function use this setting to keep source metadata refresh consistent across the project. analyticscreator uses this value when no custom value is saved for the project. access the parameter is maintained from the parameters list in analyticscreator. how to access navigation tree parameters->list parameters toolbar options->parameter diagram not opened from the diagram. visual element parameter list default value 100 custom value not set. where it is used this parameter belongs to the source refresh group and is used when analyticscreator applies source metadata refresh. setting value technical parameter name source_preview_rows default value 100 custom value not set. parameter groups group source refresh source preview refresh related topics source refresh source preview timeout parameters previous source refresh nextsource preview timeout"}
,{"id":389871309009,"name":"Source Preview Timeout","type":"topic","path":"/docs/reference/parameters/parameters-source-refresh/parameters-source-refresh-source-preview-timeout","breadcrumb":"Reference › Parameters › Source Refresh › Source Preview Timeout","description":"","searchText":"reference parameters source refresh source preview timeout overview source preview timeout is a source refresh parameter that controls the timeout for the source preview, in seconds. function use this setting to keep source metadata refresh consistent across the project. analyticscreator uses this value when no custom value is saved for the project. access the parameter is maintained from the parameters list in analyticscreator. how to access navigation tree parameters->list parameters toolbar options->parameter diagram not opened from the diagram. visual element parameter list default value 180 custom value not set. where it is used this parameter belongs to the source refresh group and is used when analyticscreator applies source metadata refresh. setting value technical parameter name source_preview_timeout default value 180 custom value not set. parameter groups group source refresh source preview refresh related topics source refresh source preview rows source refresh del missing imp cols parameters previous source preview rows nextsource refresh del missing sources"}
,{"id":389871309010,"name":"Source Refresh Del Missing Sources","type":"topic","path":"/docs/reference/parameters/parameters-source-refresh/parameters-source-refresh-source-refresh-del-missing-sources","breadcrumb":"Reference › Parameters › Source Refresh › Source Refresh Del Missing Sources","description":"","searchText":"reference parameters source refresh source refresh del missing sources overview source refresh del missing sources is a source refresh parameter that controls whether missing sources are deleted during source refresh. 0 - no, 1 - yes. function use this setting to keep source metadata refresh consistent across the project. numeric values in this parameter act as choices; use the description to interpret each option. access the parameter is maintained from the parameters list in analyticscreator. how to access navigation tree parameters->list parameters toolbar options->parameter diagram not opened from the diagram. visual element parameter list default value 0 custom value not set. where it is used this parameter belongs to the source refresh group and is used when analyticscreator applies source metadata refresh. setting value technical parameter name source_refresh_del_missing_sources default value 0 custom value not set. parameter groups group source refresh source preview refresh related topics source refresh source refresh del missing imp cols source refresh existing columns parameters previous source preview timeout nextsource refresh refresh src desc"}
,{"id":389871309011,"name":"Source Refresh Refresh Src Desc","type":"topic","path":"/docs/reference/parameters/parameters-source-refresh/parameters-source-refresh-source-refresh-refresh-src-desc","breadcrumb":"Reference › Parameters › Source Refresh › Source Refresh Refresh Src Desc","description":"","searchText":"reference parameters source refresh source refresh refresh src desc overview source refresh refresh src desc is a source refresh parameter that controls whether source descriptions are refreshed during a source refresh: 0 - no, 1 - yes. function use this setting to keep source metadata refresh consistent across the project. numeric values in this parameter act as choices; use the description to interpret each option. access the parameter is maintained from the parameters list in analyticscreator. how to access navigation tree parameters->list parameters toolbar options->parameter diagram not opened from the diagram. visual element parameter list default value 0 custom value not set. where it is used this parameter belongs to the source refresh group and is used when analyticscreator applies source metadata refresh. setting value technical parameter name source_refresh_refresh_src_desc default value 0 custom value not set. parameter groups group source refresh source preview refresh related topics source refresh source refresh refresh pk parameters previous source refresh del missing sources nextsource refresh refresh imp cols"}
,{"id":389871309012,"name":"Source Refresh Refresh Imp Cols","type":"topic","path":"/docs/reference/parameters/parameters-source-refresh/parameters-source-refresh-source-refresh-refresh-imp-cols","breadcrumb":"Reference › Parameters › Source Refresh › Source Refresh Refresh Imp Cols","description":"","searchText":"reference parameters source refresh source refresh refresh imp cols overview source refresh refresh imp cols is a source refresh parameter that controls whether import columns are refreshed during a source refresh: 0 - no, 1 - yes. function use this setting to keep source metadata refresh consistent across the project. numeric values in this parameter act as choices; use the description to interpret each option. access the parameter is maintained from the parameters list in analyticscreator. how to access navigation tree parameters->list parameters toolbar options->parameter diagram not opened from the diagram. visual element parameter list default value 0 custom value not set. where it is used this parameter belongs to the source refresh group and is used when analyticscreator applies source metadata refresh. setting value technical parameter name source_refresh_refresh_imp_cols default value 0 custom value not set. parameter groups group source refresh source preview refresh related topics source refresh source refresh references source refresh refresh imp desc parameters previous source refresh refresh src desc nextsource refresh del missing imp cols"}
,{"id":389871309013,"name":"Source Refresh Del Missing Imp Cols","type":"topic","path":"/docs/reference/parameters/parameters-source-refresh/parameters-source-refresh-source-refresh-del-missing-imp-cols","breadcrumb":"Reference › Parameters › Source Refresh › Source Refresh Del Missing Imp Cols","description":"","searchText":"reference parameters source refresh source refresh del missing imp cols overview source refresh del missing imp cols is a source refresh parameter that controls whether missing import columns are deleted during source refresh. 0 - no, 1 - yes. function use this setting to keep source metadata refresh consistent across the project. numeric values in this parameter act as choices; use the description to interpret each option. access the parameter is maintained from the parameters list in analyticscreator. how to access navigation tree parameters->list parameters toolbar options->parameter diagram not opened from the diagram. visual element parameter list default value 0 custom value not set. where it is used this parameter belongs to the source refresh group and is used when analyticscreator applies source metadata refresh. setting value technical parameter name source_refresh_del_missing_imp_cols default value 0 custom value not set. parameter groups group source refresh source preview refresh related topics source refresh source preview timeout source refresh del missing sources parameters previous source refresh refresh imp cols nextsource refresh refresh pk"}
,{"id":389871309014,"name":"Source Refresh Refresh PK","type":"topic","path":"/docs/reference/parameters/parameters-source-refresh/parameters-source-refresh-source-refresh-refresh-pk","breadcrumb":"Reference › Parameters › Source Refresh › Source Refresh Refresh PK","description":"","searchText":"reference parameters source refresh source refresh refresh pk overview source refresh refresh pk is a source refresh parameter that controls whether primary keys in import tables are refreshed during a source refresh: 0 - no, 1 - yes. function use this setting to keep source metadata refresh consistent across the project. numeric values in this parameter act as choices; use the description to interpret each option. access the parameter is maintained from the parameters list in analyticscreator. how to access navigation tree parameters->list parameters toolbar options->parameter diagram not opened from the diagram. visual element parameter list default value 0 custom value not set. where it is used this parameter belongs to the source refresh group and is used when analyticscreator applies source metadata refresh. setting value technical parameter name source_refresh_refresh_pk default value 0 custom value not set. parameter groups group source refresh source preview refresh related topics source refresh source refresh refresh imp desc source refresh refresh src desc parameters previous source refresh del missing imp cols nextsource refresh refresh imp desc"}
,{"id":389871309015,"name":"Source Refresh Refresh Imp Desc","type":"topic","path":"/docs/reference/parameters/parameters-source-refresh/parameters-source-refresh-source-refresh-refresh-imp-desc","breadcrumb":"Reference › Parameters › Source Refresh › Source Refresh Refresh Imp Desc","description":"","searchText":"reference parameters source refresh source refresh refresh imp desc overview source refresh refresh imp desc is a source refresh parameter that controls whether import descriptions are refreshed during a source refresh: 0 - no, 1 - yes. function use this setting to keep source metadata refresh consistent across the project. numeric values in this parameter act as choices; use the description to interpret each option. access the parameter is maintained from the parameters list in analyticscreator. how to access navigation tree parameters->list parameters toolbar options->parameter diagram not opened from the diagram. visual element parameter list default value 0 custom value not set. where it is used this parameter belongs to the source refresh group and is used when analyticscreator applies source metadata refresh. setting value technical parameter name source_refresh_refresh_imp_desc default value 0 custom value not set. parameter groups group source refresh source preview refresh related topics source refresh source refresh refresh imp cols source refresh refresh pk parameters previous source refresh refresh pk nextsource refresh existing columns"}
,{"id":389871309016,"name":"Source Refresh Existing Columns","type":"topic","path":"/docs/reference/parameters/parameters-source-refresh/parameters-source-refresh-source-refresh-existing-columns","breadcrumb":"Reference › Parameters › Source Refresh › Source Refresh Existing Columns","description":"","searchText":"reference parameters source refresh source refresh existing columns overview source refresh existing columns is a source refresh parameter that controls whether existing source columns are refreshed during source refresh. 0 - no, 1 - yes. function use this setting to keep source metadata refresh consistent across the project. numeric values in this parameter act as choices; use the description to interpret each option. access the parameter is maintained from the parameters list in analyticscreator. how to access navigation tree parameters->list parameters toolbar options->parameter diagram not opened from the diagram. visual element parameter list default value 0 custom value not set. where it is used this parameter belongs to the source refresh group and is used when analyticscreator applies source metadata refresh. setting value technical parameter name source_refresh_existing_columns default value 0 custom value not set. parameter groups group source refresh source preview refresh related topics source refresh source refresh del missing sources source refresh references parameters previous source refresh refresh imp desc nextsource refresh references"}
,{"id":389871309017,"name":"Source Refresh References","type":"topic","path":"/docs/reference/parameters/parameters-source-refresh/parameters-source-refresh-source-refresh-references","breadcrumb":"Reference › Parameters › Source Refresh › Source Refresh References","description":"","searchText":"reference parameters source refresh source refresh references overview source refresh references is a source refresh parameter that controls whether source references are refreshed during a source refresh: 0 - no, 1 - yes. function use this setting to keep source metadata refresh consistent across the project. numeric values in this parameter act as choices; use the description to interpret each option. access the parameter is maintained from the parameters list in analyticscreator. how to access navigation tree parameters->list parameters toolbar options->parameter diagram not opened from the diagram. visual element parameter list default value 0 custom value not set. where it is used this parameter belongs to the source refresh group and is used when analyticscreator applies source metadata refresh. setting value technical parameter name source_refresh_references default value 0 custom value not set. parameter groups group source refresh source preview refresh related topics source refresh source refresh existing columns source refresh refresh imp cols parameters previous source refresh existing columns nextdwh wizard"}
,{"id":389870784708,"name":"DWH Wizard","type":"subsection","path":"/docs/reference/parameters/parameters-dwh-wizard","breadcrumb":"Reference › Parameters › DWH Wizard","description":"","searchText":"reference parameters dwh wizard defines defaults used when the dwh wizard creates generated structures. use this page to find the dwh wizard settings, review their defaults, and open the detailed parameter pages. available parameters parameter technical name default value purpose dwh wizard calendar dwhwizard_calendar 1 1 - create, 0 - do not create. dwh wizard calendar from dwhwizard_calendar_from 19800101 calendar start date. dwh wizard calendar to dwhwizard_calendar_to 20401231 calendar end date. dwh wizard calendar transname dwhwizard_calendar_transname dim_calendar calendar dimension name. dwh wizard dimname dwhwizard_dimname dim_{src_name} template for generated dimensions. dwh wizard dwhtype dwhwizard_dwhtype 1 1 - classic, 2 - data vault 1.0, 3 - data vault 2.0. dwh wizard fact dwhwizard_fact 1 1 - n:1 directly related, 2 - all directly related, 3 - n:1 directly and indirectly related, 4 - all directly and indirectly related. dwh wizard fact calendar dwhwizard_fact_calendar 1 1 - use calendar in facts, 0 - do not use calendar in facts. dwh wizard factname dwhwizard_factname fact_{src_name} template for generated facts. dwh wizard histpackagename dwhwizard_histpackagename hist_{connector_name}{nr} template for generated historization package names. dwh wizard hub packagename dwhwizard_hub_packagename hist_{connector_name}_hub{nr} template for generated hub packages. dwh wizard hub table name dwhwizard_hub_tablename {src_name}_hub template for generated hub tables. dwh wizard hub transname dwhwizard_hub_transname {src_name}_hub template for generated hub transformations. dwh wizard imppackagename dwhwizard_imppackagename imp_{connector_name}{nr} template for generated import package names. dwh wizard link packagename dwhwizard_link_packagename hist_{connector_name}_link{nr} template for generated link packages. dwh wizard link table name dwhwizard_link_tablename {src_name}_link template for generated link tables. dwh wizard link transname dwhwizard_link_transname {src_name}_link template for generated link transformations. dwh wizard linksat transname dwhwizard_linksat_transname {link_name}sat template for generated linksat transformations. dwh wizard predefined transformations dwhwizard_predefined_transformations 2 0 - none, 1 - selected, 2 - all. dwh wizard sap deltaq dwhwizard_sap_deltaq 0 search in sap deltaq. dwh wizard sap odp dwhwizard_sap_odp 1 search in sap odp. dwh wizard sap tables dwhwizard_sap_tables 1 search in sap tables. dwh wizard sat packagename dwhwizard_sat_packagename hist_{connector_name}_sat{nr} template for generated sat packages. dwh wizard sat table name dwhwizard_sat_tablename {src_name}_sat template for generated sat tables. dwh wizard sat transname dwhwizard_sat_transname {src_name}_sat template for generated sat transformations. dwh wizard snapshot dwhwizard_snapshot 1 1 - create, 0 - do not create. dwh wizard table name dwhwizard_tablename {src_name} template for generated table names. dwh wizard tablesperpackage dwhwizard_tablesperpackage 10 tables per package. dwh wizard transname dwhwizard_transname {src_name}_v template for generated transformations. dwh wizard vaultlinksat dwhwizard_vaultlinksat 1 1 - create vault link satellite, 0 - do not create vault link satellite. previous source refresh references nextdwh wizard table name"}
,{"id":389871309018,"name":"DWH Wizard Table Name","type":"topic","path":"/docs/reference/parameters/parameters-dwh-wizard/parameters-dwh-wizard-dwh-wizard-table-name","breadcrumb":"Reference › Parameters › DWH Wizard › DWH Wizard Table Name","description":"","searchText":"reference parameters dwh wizard dwh wizard table name overview dwh wizard table name is a dwh wizard parameter that defines the template for generated table names. function use this setting to keep dwh wizard object generation consistent across the project. analyticscreator uses this value when no custom value is saved for the project. keep placeholder names unchanged when adapting the pattern. this value supports placeholders such as {src_name}. access the parameter is maintained from the parameters list in analyticscreator. how to access navigation tree parameters->list parameters toolbar options->parameter diagram not opened from the diagram. visual element parameter list default value {src_name} custom value not set. where it is used this parameter belongs to the dwh wizard group and is used when analyticscreator applies dwh wizard object generation. setting value technical parameter name dwhwizard_tablename default value {src_name} custom value not set. parameter groups group dwh wizard wizard defaults wizard related topics dwh wizard dwh wizard snapshot dwh wizard tablesperpackage parameters previous dwh wizard nextdwh wizard imppackagename"}
,{"id":389871309019,"name":"DWH Wizard Imppackagename","type":"topic","path":"/docs/reference/parameters/parameters-dwh-wizard/parameters-dwh-wizard-dwh-wizard-imppackagename","breadcrumb":"Reference › Parameters › DWH Wizard › DWH Wizard Imppackagename","description":"","searchText":"reference parameters dwh wizard dwh wizard imppackagename overview dwh wizard imppackagename is a dwh wizard parameter that defines the template for generated import package names. function use this setting to keep dwh wizard object generation consistent across the project. analyticscreator uses this value when no custom value is saved for the project. keep placeholder names unchanged when adapting the pattern. this value supports placeholders such as {connector_name}, {nr}. access the parameter is maintained from the parameters list in analyticscreator. how to access navigation tree parameters->list parameters toolbar options->parameter diagram not opened from the diagram. visual element parameter list default value imp_{connector_name}{nr} custom value not set. where it is used this parameter belongs to the dwh wizard group and is used when analyticscreator applies dwh wizard object generation. setting value technical parameter name dwhwizard_imppackagename default value imp_{connector_name}{nr} custom value not set. parameter groups group dwh wizard wizard defaults wizard related topics dwh wizard dwh wizard hub transname dwh wizard link packagename parameters previous dwh wizard table name nextdwh wizard histpackagename"}
,{"id":389871309020,"name":"DWH Wizard Histpackagename","type":"topic","path":"/docs/reference/parameters/parameters-dwh-wizard/parameters-dwh-wizard-dwh-wizard-histpackagename","breadcrumb":"Reference › Parameters › DWH Wizard › DWH Wizard Histpackagename","description":"","searchText":"reference parameters dwh wizard dwh wizard histpackagename overview dwh wizard histpackagename is a dwh wizard parameter that defines the template for generated historization package names. function use this setting to keep dwh wizard object generation consistent across the project. analyticscreator uses this value when no custom value is saved for the project. keep placeholder names unchanged when adapting the pattern. this value supports placeholders such as {connector_name}, {nr}. access the parameter is maintained from the parameters list in analyticscreator. how to access navigation tree parameters->list parameters toolbar options->parameter diagram not opened from the diagram. visual element parameter list default value hist_{connector_name}{nr} custom value not set. where it is used this parameter belongs to the dwh wizard group and is used when analyticscreator applies dwh wizard object generation. setting value technical parameter name dwhwizard_histpackagename default value hist_{connector_name}{nr} custom value not set. parameter groups group dwh wizard wizard defaults wizard related topics dwh wizard dwh wizard factname dwh wizard hub packagename parameters previous dwh wizard imppackagename nextdwh wizard transname"}
,{"id":389871309021,"name":"DWH Wizard Transname","type":"topic","path":"/docs/reference/parameters/parameters-dwh-wizard/parameters-dwh-wizard-dwh-wizard-transname","breadcrumb":"Reference › Parameters › DWH Wizard › DWH Wizard Transname","description":"","searchText":"reference parameters dwh wizard dwh wizard transname overview dwh wizard transname is a dwh wizard parameter that defines the template for generated transformations. function use this setting to keep dwh wizard object generation consistent across the project. analyticscreator uses this value when no custom value is saved for the project. keep placeholder names unchanged when adapting the pattern. this value supports placeholders such as {src_name}. access the parameter is maintained from the parameters list in analyticscreator. how to access navigation tree parameters->list parameters toolbar options->parameter diagram not opened from the diagram. visual element parameter list default value {src_name}_v custom value not set. where it is used this parameter belongs to the dwh wizard group and is used when analyticscreator applies dwh wizard object generation. setting value technical parameter name dwhwizard_transname default value {src_name}_v custom value not set. parameter groups group dwh wizard wizard defaults wizard related topics dwh wizard dwh wizard tablesperpackage dwh wizard vaultlinksat parameters previous dwh wizard histpackagename nextdwh wizard dimname"}
,{"id":389871309022,"name":"DWH Wizard Dimname","type":"topic","path":"/docs/reference/parameters/parameters-dwh-wizard/parameters-dwh-wizard-dwh-wizard-dimname","breadcrumb":"Reference › Parameters › DWH Wizard › DWH Wizard Dimname","description":"","searchText":"reference parameters dwh wizard dwh wizard dimname overview dwh wizard dimname is a dwh wizard parameter that defines the template for generated dimensions. function use this setting to keep dwh wizard object generation consistent across the project. analyticscreator uses this value when no custom value is saved for the project. keep placeholder names unchanged when adapting the pattern. this value supports placeholders such as {src_name}. access the parameter is maintained from the parameters list in analyticscreator. how to access navigation tree parameters->list parameters toolbar options->parameter diagram not opened from the diagram. visual element parameter list default value dim_{src_name} custom value not set. where it is used this parameter belongs to the dwh wizard group and is used when analyticscreator applies dwh wizard object generation. setting value technical parameter name dwhwizard_dimname default value dim_{src_name} custom value not set. parameter groups group dwh wizard wizard defaults wizard related topics dwh wizard dwh wizard calendar transname dwh wizard dwhtype parameters previous dwh wizard transname nextdwh wizard factname"}
,{"id":389871309023,"name":"DWH Wizard Factname","type":"topic","path":"/docs/reference/parameters/parameters-dwh-wizard/parameters-dwh-wizard-dwh-wizard-factname","breadcrumb":"Reference › Parameters › DWH Wizard › DWH Wizard Factname","description":"","searchText":"reference parameters dwh wizard dwh wizard factname overview dwh wizard factname is a dwh wizard parameter that defines the template for generated facts. function use this setting to keep dwh wizard object generation consistent across the project. analyticscreator uses this value when no custom value is saved for the project. keep placeholder names unchanged when adapting the pattern. this value supports placeholders such as {src_name}. access the parameter is maintained from the parameters list in analyticscreator. how to access navigation tree parameters->list parameters toolbar options->parameter diagram not opened from the diagram. visual element parameter list default value fact_{src_name} custom value not set. where it is used this parameter belongs to the dwh wizard group and is used when analyticscreator applies dwh wizard object generation. setting value technical parameter name dwhwizard_factname default value fact_{src_name} custom value not set. parameter groups group dwh wizard wizard defaults wizard related topics dwh wizard dwh wizard fact calendar dwh wizard histpackagename parameters previous dwh wizard dimname nextdwh wizard tablesperpackage"}
,{"id":389871309024,"name":"DWH Wizard Tablesperpackage","type":"topic","path":"/docs/reference/parameters/parameters-dwh-wizard/parameters-dwh-wizard-dwh-wizard-tablesperpackage","breadcrumb":"Reference › Parameters › DWH Wizard › DWH Wizard Tablesperpackage","description":"","searchText":"reference parameters dwh wizard dwh wizard tablesperpackage overview dwh wizard tablesperpackage is a dwh wizard parameter that controls the number of tables included in each generated package. function use this setting to keep dwh wizard object generation consistent across the project. analyticscreator uses this value when no custom value is saved for the project. access the parameter is maintained from the parameters list in analyticscreator. how to access navigation tree parameters->list parameters toolbar options->parameter diagram not opened from the diagram. visual element parameter list default value 10 custom value not set. where it is used this parameter belongs to the dwh wizard group and is used when analyticscreator applies dwh wizard object generation. setting value technical parameter name dwhwizard_tablesperpackage default value 10 custom value not set. parameter groups group dwh wizard wizard defaults wizard related topics dwh wizard dwh wizard table name dwh wizard transname parameters previous dwh wizard factname nextdwh wizard hub packagename"}
,{"id":389871309025,"name":"DWH Wizard Hub Packagename","type":"topic","path":"/docs/reference/parameters/parameters-dwh-wizard/parameters-dwh-wizard-dwh-wizard-hub-packagename","breadcrumb":"Reference › Parameters › DWH Wizard › DWH Wizard Hub Packagename","description":"","searchText":"reference parameters dwh wizard dwh wizard hub packagename overview dwh wizard hub packagename is a dwh wizard parameter that defines the template for generated hub packages. function use this setting to keep dwh wizard object generation consistent across the project. analyticscreator uses this value when no custom value is saved for the project. keep placeholder names unchanged when adapting the pattern. this value supports placeholders such as {connector_name}, {nr}. access the parameter is maintained from the parameters list in analyticscreator. how to access navigation tree parameters->list parameters toolbar options->parameter diagram not opened from the diagram. visual element parameter list default value hist_{connector_name}_hub{nr} custom value not set. where it is used this parameter belongs to the dwh wizard group and is used when analyticscreator applies dwh wizard object generation. setting value technical parameter name dwhwizard_hub_packagename default value hist_{connector_name}_hub{nr} custom value not set. parameter groups group dwh wizard wizard defaults wizard related topics dwh wizard dwh wizard histpackagename dwh wizard hub table name parameters previous dwh wizard tablesperpackage nextdwh wizard sat packagename"}
,{"id":389871309026,"name":"DWH Wizard SAT Packagename","type":"topic","path":"/docs/reference/parameters/parameters-dwh-wizard/parameters-dwh-wizard-dwh-wizard-sat-packagename","breadcrumb":"Reference › Parameters › DWH Wizard › DWH Wizard SAT Packagename","description":"","searchText":"reference parameters dwh wizard dwh wizard sat packagename overview dwh wizard sat packagename is a dwh wizard parameter that defines the template for generated sat packages. function use this setting to keep dwh wizard object generation consistent across the project. analyticscreator uses this value when no custom value is saved for the project. keep placeholder names unchanged when adapting the pattern. this value supports placeholders such as {connector_name}, {nr}. access the parameter is maintained from the parameters list in analyticscreator. how to access navigation tree parameters->list parameters toolbar options->parameter diagram not opened from the diagram. visual element parameter list default value hist_{connector_name}_sat{nr} custom value not set. where it is used this parameter belongs to the dwh wizard group and is used when analyticscreator applies dwh wizard object generation. setting value technical parameter name dwhwizard_sat_packagename default value hist_{connector_name}_sat{nr} custom value not set. parameter groups group dwh wizard wizard defaults wizard related topics dwh wizard dwh wizard sap tables dwh wizard sat table name parameters previous dwh wizard hub packagename nextdwh wizard link packagename"}
,{"id":389871309027,"name":"DWH Wizard Link Packagename","type":"topic","path":"/docs/reference/parameters/parameters-dwh-wizard/parameters-dwh-wizard-dwh-wizard-link-packagename","breadcrumb":"Reference › Parameters › DWH Wizard › DWH Wizard Link Packagename","description":"","searchText":"reference parameters dwh wizard dwh wizard link packagename overview dwh wizard link packagename is a dwh wizard parameter that defines the template for generated link packages. function use this setting to keep dwh wizard object generation consistent across the project. analyticscreator uses this value when no custom value is saved for the project. keep placeholder names unchanged when adapting the pattern. this value supports placeholders such as {connector_name}, {nr}. access the parameter is maintained from the parameters list in analyticscreator. how to access navigation tree parameters->list parameters toolbar options->parameter diagram not opened from the diagram. visual element parameter list default value hist_{connector_name}_link{nr} custom value not set. where it is used this parameter belongs to the dwh wizard group and is used when analyticscreator applies dwh wizard object generation. setting value technical parameter name dwhwizard_link_packagename default value hist_{connector_name}_link{nr} custom value not set. parameter groups group dwh wizard wizard defaults wizard related topics dwh wizard dwh wizard imppackagename dwh wizard link table name parameters previous dwh wizard sat packagename nextdwh wizard hub transname"}
,{"id":389871309028,"name":"DWH Wizard Hub Transname","type":"topic","path":"/docs/reference/parameters/parameters-dwh-wizard/parameters-dwh-wizard-dwh-wizard-hub-transname","breadcrumb":"Reference › Parameters › DWH Wizard › DWH Wizard Hub Transname","description":"","searchText":"reference parameters dwh wizard dwh wizard hub transname overview dwh wizard hub transname is a dwh wizard parameter that defines the template for generated hub transformations. function use this setting to keep dwh wizard object generation consistent across the project. analyticscreator uses this value when no custom value is saved for the project. keep placeholder names unchanged when adapting the pattern. this value supports placeholders such as {src_name}. access the parameter is maintained from the parameters list in analyticscreator. how to access navigation tree parameters->list parameters toolbar options->parameter diagram not opened from the diagram. visual element parameter list default value {src_name}_hub custom value not set. where it is used this parameter belongs to the dwh wizard group and is used when analyticscreator applies dwh wizard object generation. setting value technical parameter name dwhwizard_hub_transname default value {src_name}_hub custom value not set. parameter groups group dwh wizard wizard defaults wizard related topics dwh wizard dwh wizard hub table name dwh wizard imppackagename parameters previous dwh wizard link packagename nextdwh wizard sat transname"}
,{"id":389871309029,"name":"DWH Wizard SAT Transname","type":"topic","path":"/docs/reference/parameters/parameters-dwh-wizard/parameters-dwh-wizard-dwh-wizard-sat-transname","breadcrumb":"Reference › Parameters › DWH Wizard › DWH Wizard SAT Transname","description":"","searchText":"reference parameters dwh wizard dwh wizard sat transname overview dwh wizard sat transname is a dwh wizard parameter that defines the template for generated sat transformations. function use this setting to keep dwh wizard object generation consistent across the project. analyticscreator uses this value when no custom value is saved for the project. keep placeholder names unchanged when adapting the pattern. this value supports placeholders such as {src_name}. access the parameter is maintained from the parameters list in analyticscreator. how to access navigation tree parameters->list parameters toolbar options->parameter diagram not opened from the diagram. visual element parameter list default value {src_name}_sat custom value not set. where it is used this parameter belongs to the dwh wizard group and is used when analyticscreator applies dwh wizard object generation. setting value technical parameter name dwhwizard_sat_transname default value {src_name}_sat custom value not set. parameter groups group dwh wizard wizard defaults wizard related topics dwh wizard dwh wizard sat table name dwh wizard snapshot parameters previous dwh wizard hub transname nextdwh wizard link transname"}
,{"id":389871309030,"name":"DWH Wizard Link Transname","type":"topic","path":"/docs/reference/parameters/parameters-dwh-wizard/parameters-dwh-wizard-dwh-wizard-link-transname","breadcrumb":"Reference › Parameters › DWH Wizard › DWH Wizard Link Transname","description":"","searchText":"reference parameters dwh wizard dwh wizard link transname overview dwh wizard link transname is a dwh wizard parameter that defines the template for generated link transformations. function use this setting to keep dwh wizard object generation consistent across the project. analyticscreator uses this value when no custom value is saved for the project. keep placeholder names unchanged when adapting the pattern. this value supports placeholders such as {src_name}. access the parameter is maintained from the parameters list in analyticscreator. how to access navigation tree parameters->list parameters toolbar options->parameter diagram not opened from the diagram. visual element parameter list default value {src_name}_link custom value not set. where it is used this parameter belongs to the dwh wizard group and is used when analyticscreator applies dwh wizard object generation. setting value technical parameter name dwhwizard_link_transname default value {src_name}_link custom value not set. parameter groups group dwh wizard wizard defaults wizard related topics dwh wizard dwh wizard link table name dwh wizard linksat transname parameters previous dwh wizard sat transname nextdwh wizard linksat transname"}
,{"id":389871309031,"name":"DWH Wizard Linksat Transname","type":"topic","path":"/docs/reference/parameters/parameters-dwh-wizard/parameters-dwh-wizard-dwh-wizard-linksat-transname","breadcrumb":"Reference › Parameters › DWH Wizard › DWH Wizard Linksat Transname","description":"","searchText":"reference parameters dwh wizard dwh wizard linksat transname overview dwh wizard linksat transname is a dwh wizard parameter that defines the template for generated linksat transformations. function use this setting to keep dwh wizard object generation consistent across the project. analyticscreator uses this value when no custom value is saved for the project. keep placeholder names unchanged when adapting the pattern. this value supports placeholders such as {link_name}. access the parameter is maintained from the parameters list in analyticscreator. how to access navigation tree parameters->list parameters toolbar options->parameter diagram not opened from the diagram. visual element parameter list default value {link_name}sat custom value not set. where it is used this parameter belongs to the dwh wizard group and is used when analyticscreator applies dwh wizard object generation. setting value technical parameter name dwhwizard_linksat_transname default value {link_name}sat custom value not set. parameter groups group dwh wizard wizard defaults wizard related topics dwh wizard dwh wizard link transname dwh wizard predefined transformations parameters previous dwh wizard link transname nextdwh wizard hub table name"}
,{"id":389871309032,"name":"DWH Wizard Hub Table Name","type":"topic","path":"/docs/reference/parameters/parameters-dwh-wizard/parameters-dwh-wizard-dwh-wizard-hub-table-name","breadcrumb":"Reference › Parameters › DWH Wizard › DWH Wizard Hub Table Name","description":"","searchText":"reference parameters dwh wizard dwh wizard hub table name overview dwh wizard hub table name is a dwh wizard parameter that defines the template for generated hub tables. function use this setting to keep dwh wizard object generation consistent across the project. analyticscreator uses this value when no custom value is saved for the project. keep placeholder names unchanged when adapting the pattern. this value supports placeholders such as {src_name}. access the parameter is maintained from the parameters list in analyticscreator. how to access navigation tree parameters->list parameters toolbar options->parameter diagram not opened from the diagram. visual element parameter list default value {src_name}_hub custom value not set. where it is used this parameter belongs to the dwh wizard group and is used when analyticscreator applies dwh wizard object generation. setting value technical parameter name dwhwizard_hub_tablename default value {src_name}_hub custom value not set. parameter groups group dwh wizard wizard defaults wizard related topics dwh wizard dwh wizard hub packagename dwh wizard hub transname parameters previous dwh wizard linksat transname nextdwh wizard sat table name"}
,{"id":389871309033,"name":"DWH Wizard SAT Table Name","type":"topic","path":"/docs/reference/parameters/parameters-dwh-wizard/parameters-dwh-wizard-dwh-wizard-sat-table-name","breadcrumb":"Reference › Parameters › DWH Wizard › DWH Wizard SAT Table Name","description":"","searchText":"reference parameters dwh wizard dwh wizard sat table name overview dwh wizard sat table name is a dwh wizard parameter that defines the template for generated sat tables. function use this setting to keep dwh wizard object generation consistent across the project. analyticscreator uses this value when no custom value is saved for the project. keep placeholder names unchanged when adapting the pattern. this value supports placeholders such as {src_name}. access the parameter is maintained from the parameters list in analyticscreator. how to access navigation tree parameters->list parameters toolbar options->parameter diagram not opened from the diagram. visual element parameter list default value {src_name}_sat custom value not set. where it is used this parameter belongs to the dwh wizard group and is used when analyticscreator applies dwh wizard object generation. setting value technical parameter name dwhwizard_sat_tablename default value {src_name}_sat custom value not set. parameter groups group dwh wizard wizard defaults wizard related topics dwh wizard dwh wizard sat packagename dwh wizard sat transname parameters previous dwh wizard hub table name nextdwh wizard link table name"}
,{"id":389871309034,"name":"DWH Wizard Link Table Name","type":"topic","path":"/docs/reference/parameters/parameters-dwh-wizard/parameters-dwh-wizard-dwh-wizard-link-table-name","breadcrumb":"Reference › Parameters › DWH Wizard › DWH Wizard Link Table Name","description":"","searchText":"reference parameters dwh wizard dwh wizard link table name overview dwh wizard link table name is a dwh wizard parameter that defines the template for generated link tables. function use this setting to keep dwh wizard object generation consistent across the project. analyticscreator uses this value when no custom value is saved for the project. keep placeholder names unchanged when adapting the pattern. this value supports placeholders such as {src_name}. access the parameter is maintained from the parameters list in analyticscreator. how to access navigation tree parameters->list parameters toolbar options->parameter diagram not opened from the diagram. visual element parameter list default value {src_name}_link custom value not set. where it is used this parameter belongs to the dwh wizard group and is used when analyticscreator applies dwh wizard object generation. setting value technical parameter name dwhwizard_link_tablename default value {src_name}_link custom value not set. parameter groups group dwh wizard wizard defaults wizard related topics dwh wizard dwh wizard link packagename dwh wizard link transname parameters previous dwh wizard sat table name nextdwh wizard dwhtype"}
,{"id":389871309035,"name":"DWH Wizard Dwhtype","type":"topic","path":"/docs/reference/parameters/parameters-dwh-wizard/parameters-dwh-wizard-dwh-wizard-dwhtype","breadcrumb":"Reference › Parameters › DWH Wizard › DWH Wizard Dwhtype","description":"","searchText":"reference parameters dwh wizard dwh wizard dwhtype overview dwh wizard dwhtype is a dwh wizard parameter that sets the dwh type used by the dwh wizard. function use this setting to keep dwh wizard object generation consistent across the project. analyticscreator uses this value when no custom value is saved for the project. access the parameter is maintained from the parameters list in analyticscreator. how to access navigation tree parameters->list parameters toolbar options->parameter diagram not opened from the diagram. visual element parameter list default value 1 custom value not set. where it is used this parameter belongs to the dwh wizard group and is used when analyticscreator applies dwh wizard object generation. setting value technical parameter name dwhwizard_dwhtype default value 1 custom value not set. parameter groups group dwh wizard wizard defaults wizard related topics dwh wizard dwh wizard dimname dwh wizard fact parameters previous dwh wizard link table name nextdwh wizard snapshot"}
,{"id":389871309036,"name":"DWH Wizard Snapshot","type":"topic","path":"/docs/reference/parameters/parameters-dwh-wizard/parameters-dwh-wizard-dwh-wizard-snapshot","breadcrumb":"Reference › Parameters › DWH Wizard › DWH Wizard Snapshot","description":"","searchText":"reference parameters dwh wizard dwh wizard snapshot overview dwh wizard snapshot is a dwh wizard parameter that controls whether the wizard creates snapshot objects. function use this setting to keep dwh wizard object generation consistent across the project. analyticscreator uses this value when no custom value is saved for the project. access the parameter is maintained from the parameters list in analyticscreator. how to access navigation tree parameters->list parameters toolbar options->parameter diagram not opened from the diagram. visual element parameter list default value 1 custom value not set. where it is used this parameter belongs to the dwh wizard group and is used when analyticscreator applies dwh wizard object generation. setting value technical parameter name dwhwizard_snapshot default value 1 custom value not set. parameter groups group dwh wizard wizard defaults wizard related topics dwh wizard dwh wizard sat transname dwh wizard table name parameters previous dwh wizard dwhtype nextdwh wizard calendar"}
,{"id":389871309037,"name":"DWH Wizard Calendar","type":"topic","path":"/docs/reference/parameters/parameters-dwh-wizard/parameters-dwh-wizard-dwh-wizard-calendar","breadcrumb":"Reference › Parameters › DWH Wizard › DWH Wizard Calendar","description":"","searchText":"reference parameters dwh wizard dwh wizard calendar overview dwh wizard calendar is a dwh wizard parameter that sets the option used for the dwh wizard calendar. function use this setting to keep dwh wizard object generation consistent across the project. analyticscreator uses this value when no custom value is saved for the project. access the parameter is maintained from the parameters list in analyticscreator. how to access navigation tree parameters->list parameters toolbar options->parameter diagram not opened from the diagram. visual element parameter list default value 1 custom value not set. where it is used this parameter belongs to the dwh wizard group and is used when analyticscreator applies dwh wizard object generation. setting value technical parameter name dwhwizard_calendar default value 1 custom value not set. parameter groups group dwh wizard wizard defaults wizard related topics dwh wizard dwh wizard calendar from parameters previous dwh wizard snapshot nextdwh wizard calendar transname"}
,{"id":389871309038,"name":"DWH Wizard Calendar Transname","type":"topic","path":"/docs/reference/parameters/parameters-dwh-wizard/parameters-dwh-wizard-dwh-wizard-calendar-transname","breadcrumb":"Reference › Parameters › DWH Wizard › DWH Wizard Calendar Transname","description":"","searchText":"reference parameters dwh wizard dwh wizard calendar transname overview dwh wizard calendar transname is a dwh wizard parameter that controls the calendar dimension name. function use this setting to keep dwh wizard object generation consistent across the project. analyticscreator uses this value when no custom value is saved for the project. access the parameter is maintained from the parameters list in analyticscreator. how to access navigation tree parameters->list parameters toolbar options->parameter diagram not opened from the diagram. visual element parameter list default value dim_calendar custom value not set. where it is used this parameter belongs to the dwh wizard group and is used when analyticscreator applies dwh wizard object generation. setting value technical parameter name dwhwizard_calendar_transname default value dim_calendar custom value not set. parameter groups group dwh wizard wizard defaults wizard related topics dwh wizard dwh wizard calendar to dwh wizard dimname parameters previous dwh wizard calendar nextdwh wizard calendar from"}
,{"id":389871309039,"name":"DWH Wizard Calendar From","type":"topic","path":"/docs/reference/parameters/parameters-dwh-wizard/parameters-dwh-wizard-dwh-wizard-calendar-from","breadcrumb":"Reference › Parameters › DWH Wizard › DWH Wizard Calendar From","description":"","searchText":"reference parameters dwh wizard dwh wizard calendar from overview dwh wizard calendar from is a dwh wizard parameter that controls the calendar start date. function use this setting to keep dwh wizard object generation consistent across the project. analyticscreator uses this value when no custom value is saved for the project. access the parameter is maintained from the parameters list in analyticscreator. how to access navigation tree parameters->list parameters toolbar options->parameter diagram not opened from the diagram. visual element parameter list default value 19800101 custom value not set. where it is used this parameter belongs to the dwh wizard group and is used when analyticscreator applies dwh wizard object generation. setting value technical parameter name dwhwizard_calendar_from default value 19800101 custom value not set. parameter groups group dwh wizard wizard defaults wizard related topics dwh wizard dwh wizard calendar dwh wizard calendar to parameters previous dwh wizard calendar transname nextdwh wizard calendar to"}
,{"id":389871309040,"name":"DWH Wizard Calendar To","type":"topic","path":"/docs/reference/parameters/parameters-dwh-wizard/parameters-dwh-wizard-dwh-wizard-calendar-to","breadcrumb":"Reference › Parameters › DWH Wizard › DWH Wizard Calendar To","description":"","searchText":"reference parameters dwh wizard dwh wizard calendar to overview dwh wizard calendar to is a dwh wizard parameter that controls the calendar end date. function use this setting to keep dwh wizard object generation consistent across the project. analyticscreator uses this value when no custom value is saved for the project. access the parameter is maintained from the parameters list in analyticscreator. how to access navigation tree parameters->list parameters toolbar options->parameter diagram not opened from the diagram. visual element parameter list default value 20401231 custom value not set. where it is used this parameter belongs to the dwh wizard group and is used when analyticscreator applies dwh wizard object generation. setting value technical parameter name dwhwizard_calendar_to default value 20401231 custom value not set. parameter groups group dwh wizard wizard defaults wizard related topics dwh wizard dwh wizard calendar from dwh wizard calendar transname parameters previous dwh wizard calendar from nextdwh wizard fact"}
,{"id":389871309041,"name":"DWH Wizard Fact","type":"topic","path":"/docs/reference/parameters/parameters-dwh-wizard/parameters-dwh-wizard-dwh-wizard-fact","breadcrumb":"Reference › Parameters › DWH Wizard › DWH Wizard Fact","description":"","searchText":"reference parameters dwh wizard dwh wizard fact overview dwh wizard fact is a dwh wizard parameter that sets the fact generation option of the dwh wizard. function use this setting to keep dwh wizard object generation consistent across the project. analyticscreator uses this value when no custom value is saved for the project. access the parameter is maintained from the parameters list in analyticscreator. how to access navigation tree parameters->list parameters toolbar options->parameter diagram not opened from the diagram. visual element parameter list default value 1 custom value not set. where it is used this parameter belongs to the dwh wizard group and is used when analyticscreator applies dwh wizard object generation. setting value technical parameter name dwhwizard_fact default value 1 custom value not set. parameter groups group dwh wizard wizard defaults wizard related topics dwh wizard dwh wizard dwhtype dwh wizard fact calendar parameters previous dwh wizard calendar to nextdwh wizard fact calendar"}
,{"id":389871309042,"name":"DWH Wizard Fact Calendar","type":"topic","path":"/docs/reference/parameters/parameters-dwh-wizard/parameters-dwh-wizard-dwh-wizard-fact-calendar","breadcrumb":"Reference › Parameters › DWH Wizard › DWH Wizard Fact Calendar","description":"","searchText":"reference parameters dwh wizard dwh wizard fact calendar overview dwh wizard fact calendar is a dwh wizard parameter that sets the calendar option for generated facts. function use this setting to keep dwh wizard object generation consistent across the project. analyticscreator uses this value when no custom value is saved for the project. access the parameter is maintained from the parameters list in analyticscreator. how to access navigation tree parameters->list parameters toolbar options->parameter diagram not opened from the diagram. visual element parameter list default value 1 custom value not set. where it is used this parameter belongs to the dwh wizard group and is used when analyticscreator applies dwh wizard object generation. setting value technical parameter name dwhwizard_fact_calendar default value 1 custom value not set. parameter groups group dwh wizard wizard defaults wizard related topics dwh wizard dwh wizard fact dwh wizard factname parameters previous dwh wizard fact nextdwh wizard vaultlinksat"}
,{"id":389872719057,"name":"DWH Wizard Vaultlinksat","type":"topic","path":"/docs/reference/parameters/parameters-dwh-wizard/parameters-dwh-wizard-dwh-wizard-vaultlinksat","breadcrumb":"Reference › Parameters › DWH Wizard › DWH Wizard Vaultlinksat","description":"","searchText":"reference parameters dwh wizard dwh wizard vaultlinksat overview dwh wizard vaultlinksat is a dwh wizard parameter that controls whether the wizard generates link sat objects in data vault models. function use this setting to keep dwh wizard object generation consistent across the project. analyticscreator uses this value when no custom value is saved for the project. access the parameter is maintained from the parameters list in analyticscreator. how to access navigation tree parameters->list parameters toolbar options->parameter diagram not opened from the diagram. visual element parameter list default value 1 custom value not set. where it is used this parameter belongs to the dwh wizard group and is used when analyticscreator applies dwh wizard object generation. setting value technical parameter name dwhwizard_vaultlinksat default value 1 custom value not set. parameter groups group dwh wizard wizard defaults wizard related topics dwh wizard dwh wizard transname parameters previous dwh wizard fact calendar nextdwh wizard predefined transformations"}
,{"id":389872719058,"name":"DWH Wizard Predefined Transformations","type":"topic","path":"/docs/reference/parameters/parameters-dwh-wizard/parameters-dwh-wizard-dwh-wizard-predefined-transformations","breadcrumb":"Reference › Parameters › DWH Wizard › DWH Wizard Predefined Transformations","description":"","searchText":"reference parameters dwh wizard dwh wizard predefined transformations overview dwh wizard predefined transformations is a dwh wizard parameter that sets the predefined transformations option of the dwh wizard. function use this setting to keep dwh wizard object generation consistent across the project. analyticscreator uses this value when no custom value is saved for the project. access the parameter is maintained from the parameters list in analyticscreator. how to access navigation tree parameters->list parameters toolbar options->parameter diagram not opened from the diagram. visual element parameter list default value 2 custom value not set. where it is used this parameter belongs to the dwh wizard group and is used when analyticscreator applies dwh wizard object generation. setting value technical parameter name dwhwizard_predefined_transformations default value 2 custom value not set. parameter groups group dwh wizard wizard defaults wizard related topics dwh wizard dwh wizard linksat transname dwh wizard sap deltaq parameters previous dwh wizard vaultlinksat nextdwh wizard sap tables"}
,{"id":389872719059,"name":"DWH Wizard SAP Tables","type":"topic","path":"/docs/reference/parameters/parameters-dwh-wizard/parameters-dwh-wizard-dwh-wizard-sap-tables","breadcrumb":"Reference › Parameters › DWH Wizard › DWH Wizard SAP Tables","description":"","searchText":"reference parameters dwh wizard dwh wizard sap tables overview dwh wizard sap tables is a dwh wizard parameter that controls the search in sap tables. function use this setting to keep dwh wizard object generation consistent across the project. analyticscreator uses this value when no custom value is saved for the project. access the parameter is maintained from the parameters list in analyticscreator. how to access navigation tree parameters->list parameters toolbar options->parameter diagram not opened from the diagram. visual element parameter list default value 1 custom value not set. where it is used this parameter belongs to the dwh wizard group and is used when analyticscreator applies dwh wizard object generation. setting value technical parameter name dwhwizard_sap_tables default value 1 custom value not set. parameter groups group dwh wizard wizard defaults wizard related topics dwh wizard dwh wizard sap odp dwh wizard sat packagename parameters previous dwh wizard predefined transformations nextdwh wizard sap deltaq"}
,{"id":389872719060,"name":"DWH Wizard SAP Deltaq","type":"topic","path":"/docs/reference/parameters/parameters-dwh-wizard/parameters-dwh-wizard-dwh-wizard-sap-deltaq","breadcrumb":"Reference › Parameters › DWH Wizard › DWH Wizard SAP Deltaq","description":"","searchText":"reference parameters dwh wizard dwh wizard sap deltaq overview dwh wizard sap deltaq is a dwh wizard parameter that controls search in sap deltaq. function use this setting to keep dwh wizard object generation consistent across the project. analyticscreator uses this value when no custom value is saved for the project. access the parameter is maintained from the parameters list in analyticscreator. how to access navigation tree parameters->list parameters toolbar options->parameter diagram not opened from the diagram. visual element parameter list default value 0 custom value not set. where it is used this parameter belongs to the dwh wizard group and is used when analyticscreator applies dwh wizard object generation. setting value technical parameter name dwhwizard_sap_deltaq default value 0 custom value not set. parameter groups group dwh wizard wizard defaults wizard related topics dwh wizard dwh wizard predefined transformations dwh wizard sap odp parameters previous dwh wizard sap tables nextdwh wizard sap odp"}
,{"id":389872719061,"name":"DWH Wizard SAP ODP","type":"topic","path":"/docs/reference/parameters/parameters-dwh-wizard/parameters-dwh-wizard-dwh-wizard-sap-odp","breadcrumb":"Reference › Parameters › DWH Wizard › DWH Wizard SAP ODP","description":"","searchText":"reference parameters dwh wizard dwh wizard sap odp overview dwh wizard sap odp is a dwh wizard parameter that controls search in sap odp. function use this setting to keep dwh wizard object generation consistent across the project. analyticscreator uses this value when no custom value is saved for the project. access the parameter is maintained from the parameters list in analyticscreator. how to access navigation tree parameters->list parameters toolbar options->parameter diagram not opened from the diagram. visual element parameter list default value 1 custom value not set. where it is used this parameter belongs to the dwh wizard group and is used when analyticscreator applies dwh wizard object generation. setting value technical parameter name dwhwizard_sap_odp default value 1 custom value not set. parameter groups group dwh wizard wizard defaults wizard related topics dwh wizard dwh wizard sap deltaq dwh wizard sap tables parameters previous dwh wizard sap deltaq nexttransformations"}
,{"id":389870784709,"name":"Transformations","type":"subsection","path":"/docs/reference/parameters/parameters-transformations","breadcrumb":"Reference › Parameters › Transformations","description":"","searchText":"reference parameters transformations controls transformation naming, relation use, calendar fields, and generated views. use this page to find the transformations settings, review their defaults, and open the detailed parameter pages. available parameters parameter technical name default value purpose default calendar macro default_calendar_macro not set. name of default calendar macro. trans alias alias trans_alias_alias @thisalias alias to use as the current alias name. trans column alias trans_column_alias @thiscol alias to use as the current column name. trans default use relations trans_default_use_relations 2 1 - use business key references rather than hash key references. 2 - use hash key references rather than business key references. 3 - use hash key references only. 4 - use business key references only. trans field alias trans_field_alias @this alias to use as the current field name. trans friendly names as column names trans_friendly_names_as_column_names 1 use friendly names as column names in transformations: 0 - no, 1 - yes. trans use no lock trans_use_nolock 1 use nolock hint in regular transformations: 0 - no, 1 - yes. transformation calendar fact pattern transformation_calendar_fact_pattern fk_{tablename}_{columnname} pattern of calendar fields in transformations. you can use {schemaname}, {tablename}, {friendlyname}, {schemaid}, {tableid} and {columnname} placeholders. transformation hist id pattern transformation_hist_id_pattern fk_{tablename} pattern of key fields in transformations. you can use {schemaname}, {tablename}, {friendlyname}, {schemaid}, {tableid} and {columnname} placeholders. transformation key null to zero transformation_key_null_to_zero 1 transformation wizard defaults: key fields null to zero. 0 - no, 1 - yes. transformation unknown members transformation_unknown_members 1 transformation wizard defaults. create unknown members. 0 - no, 1 - yes. transformations createviews transformations_createviews 0 create view when saving transformation: 2-yes, 1-compile only, 0-no. previous dwh wizard sap odp nexttransformation unknown members"}
,{"id":389872719062,"name":"Transformation Unknown Members","type":"topic","path":"/docs/reference/parameters/parameters-transformations/parameters-transformations-transformation-unknown-members","breadcrumb":"Reference › Parameters › Transformations › Transformation Unknown Members","description":"","searchText":"reference parameters transformations transformation unknown members overview transformation unknown members is a transformations parameter that controls whether the transformation wizard creates unknown members: 0 - no, 1 - yes. function use this setting to keep transformation generation and execution consistent across the project. analyticscreator uses this value when no custom value is saved for the project. access the parameter is maintained from the parameters list in analyticscreator. how to access navigation tree parameters->list parameters toolbar options->parameter diagram not opened from the diagram. visual element parameter list default value 1 custom value not set. where it is used this parameter belongs to the transformations group and is used when analyticscreator applies transformation generation and execution. setting value technical parameter name transformation_unknown_members default value 1 custom value not set. parameter groups group transformations modeling transform related topics transformations transformation key null to zero transformations createviews parameters previous transformations nexttransformation key null to zero"}
,{"id":389872719063,"name":"Transformation Key Null To Zero","type":"topic","path":"/docs/reference/parameters/parameters-transformations/parameters-transformations-transformation-key-null-to-zero","breadcrumb":"Reference › Parameters › Transformations › Transformation Key Null To Zero","description":"","searchText":"reference parameters transformations transformation key null to zero overview transformation key null to zero is a transformations parameter that controls whether null key fields are converted to zero by the transformation wizard: 0 - no, 1 - yes. function use this setting to keep transformation generation and execution consistent across the project. analyticscreator uses this value when no custom value is saved for the project. access the parameter is maintained from the parameters list in analyticscreator. how to access navigation tree parameters->list parameters toolbar options->parameter diagram not opened from the diagram. visual element parameter list default value 1 custom value not set. where it is used this parameter belongs to the transformations group and is used when analyticscreator applies transformation generation and execution. setting value technical parameter name transformation_key_null_to_zero default value 1 custom value not set. parameter groups group transformations modeling transform related topics transformations transformation hist id pattern transformation unknown members parameters previous transformation unknown members nexttransformation hist id pattern"}
,{"id":389872719064,"name":"Transformation Hist ID Pattern","type":"topic","path":"/docs/reference/parameters/parameters-transformations/parameters-transformations-transformation-hist-id-pattern","breadcrumb":"Reference › Parameters › Transformations › Transformation Hist ID Pattern","description":"","searchText":"reference parameters transformations transformation hist id pattern overview transformation hist id pattern is a transformations parameter that defines the naming pattern for key fields in transformations. you can use {schemaname}, {tablename}, {friendlyname}, {schemaid}, {tableid} and {columnname} placeholders. function use this setting to keep transformation generation and execution consistent across the project. analyticscreator uses this value when no custom value is saved for the project. keep placeholder names unchanged when adapting the pattern. this value supports placeholders such as {tablename}, {schemaname}, {friendlyname}, {schemaid}, {tableid}, {columnname}. access the parameter is maintained from the parameters list in analyticscreator. how to access navigation tree parameters->list parameters toolbar options->parameter diagram not opened from the diagram. visual element parameter list default value fk_{tablename} custom value not set. where it is used this parameter belongs to the transformations group and is used when analyticscreator applies transformation generation and execution. setting value technical parameter name transformation_hist_id_pattern default value fk_{tablename} custom value not set. parameter groups group transformations modeling transform related topics transformations transformation calendar fact pattern transformation key null to zero parameters previous transformation key null to zero nexttransformation calendar fact pattern"}
,{"id":389872719065,"name":"Transformation Calendar Fact Pattern","type":"topic","path":"/docs/reference/parameters/parameters-transformations/parameters-transformations-transformation-calendar-fact-pattern","breadcrumb":"Reference › Parameters › Transformations › Transformation Calendar Fact Pattern","description":"","searchText":"reference parameters transformations transformation calendar fact pattern overview transformation calendar fact pattern is a transformations parameter that defines the naming pattern for calendar fields in transformations. you can use {schemaname}, {tablename}, {friendlyname}, {schemaid}, {tableid} and {columnname} placeholders. function use this setting to keep transformation generation and execution consistent across the project. analyticscreator uses this value when no custom value is saved for the project. keep placeholder names unchanged when adapting the pattern. this value supports placeholders such as {tablename}, {columnname}, {schemaname}, {friendlyname}, {schemaid}, {tableid}. access the parameter is maintained from the parameters list in analyticscreator. how to access navigation tree parameters->list parameters toolbar options->parameter diagram not opened from the diagram. visual element parameter list default value fk_{tablename}_{columnname} custom value not set. where it is used this parameter belongs to the transformations group and is used when analyticscreator applies transformation generation and execution. setting value technical parameter name transformation_calendar_fact_pattern default value fk_{tablename}_{columnname} custom value not set. parameter groups group transformations modeling transform related topics transformations trans use no lock transformation hist id pattern parameters previous transformation hist id pattern nexttransformations createviews"}
,{"id":389872719066,"name":"Transformations Createviews","type":"topic","path":"/docs/reference/parameters/parameters-transformations/parameters-transformations-transformations-createviews","breadcrumb":"Reference › Parameters › Transformations › Transformations Createviews","description":"","searchText":"reference parameters transformations transformations createviews overview transformations create views is a transformations parameter that controls whether analyticscreator creates a view when saving a transformation: 2 - yes, 1 - compile only, 0 - no. function use this setting to keep transformation generation and execution consistent across the project. analyticscreator uses this value when no custom value is saved for the project. access the parameter is maintained from the parameters list in analyticscreator. how to access navigation tree parameters->list parameters toolbar options->parameter diagram not opened from the diagram. visual element parameter list default value 0 custom value not set. where it is used this parameter belongs to the transformations group and is used when analyticscreator applies transformation generation and execution. setting value technical parameter name transformations_createviews default value 0 custom value not set. parameter groups group transformations modeling transform related topics transformations transformation unknown members parameters previous transformation calendar fact pattern nextdefault calendar macro"}
,{"id":389872719067,"name":"Default Calendar Macro","type":"topic","path":"/docs/reference/parameters/parameters-transformations/parameters-transformations-default-calendar-macro","breadcrumb":"Reference › Parameters › Transformations › Default Calendar Macro","description":"","searchText":"reference parameters transformations default calendar macro overview default calendar macro is a transformations parameter that controls the name of the default calendar macro. function use this setting to keep transformation generation and execution consistent across the project. analyticscreator uses this value when no custom value is saved for the project. access the parameter is maintained from the parameters list in analyticscreator. how to access navigation tree parameters->list parameters toolbar options->parameter diagram not opened from the diagram. visual element parameter list default value not set. custom value not set. where it is used this parameter belongs to the transformations group and is used when analyticscreator applies transformation generation and execution. setting value technical parameter name default_calendar_macro default value not set. custom value not set. parameter groups group transformations modeling transform related topics transformations trans alias alias parameters previous transformations createviews nexttrans default use relations"}
,{"id":389872719068,"name":"Trans Default Use Relations","type":"topic","path":"/docs/reference/parameters/parameters-transformations/parameters-transformations-trans-default-use-relations","breadcrumb":"Reference › Parameters › Transformations › Trans Default Use Relations","description":"","searchText":"reference parameters transformations trans default use relations overview trans default use relations is a transformations parameter that controls which reference type transformations use by default (business key vs. hash key references). function use this setting to keep transformation generation and execution consistent across the project. analyticscreator uses this value when no custom value is saved for the project. access the parameter is maintained from the parameters list in analyticscreator. how to access navigation tree parameters->list parameters toolbar options->parameter diagram not opened from the diagram. visual element parameter list default value 2 custom value not set. where it is used this parameter belongs to the transformations group and is used when analyticscreator applies transformation generation and execution. setting value technical parameter name trans_default_use_relations default value 2 custom value not set. parameter groups group transformations modeling transform related topics transformations trans column alias trans field alias parameters previous default calendar macro nexttrans friendly names as column names"}
,{"id":389872719069,"name":"Trans Friendly Names As Column Names","type":"topic","path":"/docs/reference/parameters/parameters-transformations/parameters-transformations-trans-friendly-names-as-column-names","breadcrumb":"Reference › Parameters › Transformations › Trans Friendly Names As Column Names","description":"","searchText":"reference parameters transformations trans friendly names as column names overview trans friendly names as column names is a transformations parameter that controls whether friendly names are used as column names in transformations: 0 - no, 1 - yes. function use this setting to keep transformation generation and execution consistent across the project. numeric values in this parameter act as choices; use the description to interpret each option. access the parameter is maintained from the parameters list in analyticscreator. how to access navigation tree parameters->list parameters toolbar options->parameter diagram not opened from the diagram. visual element parameter list default value 1 custom value not set. where it is used this parameter belongs to the transformations group and is used when analyticscreator applies transformation generation and execution. setting value technical parameter name trans_friendly_names_as_column_names default value 1 custom value not set. parameter groups group transformations modeling transform related topics transformations trans field alias trans use no lock parameters previous trans default use relations nexttrans field alias"}
,{"id":389872719070,"name":"Trans Field Alias","type":"topic","path":"/docs/reference/parameters/parameters-transformations/parameters-transformations-trans-field-alias","breadcrumb":"Reference › Parameters › Transformations › Trans Field Alias","description":"","searchText":"reference parameters transformations trans field alias overview trans field alias is a transformations parameter that defines the alias used to refer to the current field in transformation expressions (default @this). function use this setting to keep transformation generation and execution consistent across the project. analyticscreator uses this value when no custom value is saved for the project. access the parameter is maintained from the parameters list in analyticscreator. how to access navigation tree parameters->list parameters toolbar options->parameter diagram not opened from the diagram. visual element parameter list default value @this custom value not set. where it is used this parameter belongs to the transformations group and is used when analyticscreator applies transformation generation and execution. setting value technical parameter name trans_field_alias default value @this custom value not set. parameter groups group transformations modeling transform related topics transformations trans default use relations trans friendly names as column names parameters previous trans friendly names as column names nexttrans column alias"}
,{"id":389872719071,"name":"Trans Column Alias","type":"topic","path":"/docs/reference/parameters/parameters-transformations/parameters-transformations-trans-column-alias","breadcrumb":"Reference › Parameters › Transformations › Trans Column Alias","description":"","searchText":"reference parameters transformations trans column alias overview trans column alias is a transformations parameter that defines the alias used to refer to the current column in transformation expressions (default @thiscol). function use this setting to keep transformation generation and execution consistent across the project. analyticscreator uses this value when no custom value is saved for the project. access the parameter is maintained from the parameters list in analyticscreator. how to access navigation tree parameters->list parameters toolbar options->parameter diagram not opened from the diagram. visual element parameter list default value @thiscol custom value not set. where it is used this parameter belongs to the transformations group and is used when analyticscreator applies transformation generation and execution. setting value technical parameter name trans_column_alias default value @thiscol custom value not set. parameter groups group transformations modeling transform related topics transformations trans alias alias trans default use relations parameters previous trans field alias nexttrans alias alias"}
,{"id":389872719072,"name":"Trans Alias Alias","type":"topic","path":"/docs/reference/parameters/parameters-transformations/parameters-transformations-trans-alias-alias","breadcrumb":"Reference › Parameters › Transformations › Trans Alias Alias","description":"","searchText":"reference parameters transformations trans alias alias overview trans alias alias is a transformations parameter that defines the alias used to refer to the current alias name in transformation expressions (default @thisalias). function use this setting to keep transformation generation and execution consistent across the project. analyticscreator uses this value when no custom value is saved for the project. access the parameter is maintained from the parameters list in analyticscreator. how to access navigation tree parameters->list parameters toolbar options->parameter diagram not opened from the diagram. visual element parameter list default value @thisalias custom value not set. where it is used this parameter belongs to the transformations group and is used when analyticscreator applies transformation generation and execution. setting value technical parameter name trans_alias_alias default value @thisalias custom value not set. parameter groups group transformations modeling transform related topics transformations default calendar macro trans column alias parameters previous trans column alias nexttrans use no lock"}
,{"id":389872719073,"name":"Trans Use No Lock","type":"topic","path":"/docs/reference/parameters/parameters-transformations/parameters-transformations-trans-use-no-lock","breadcrumb":"Reference › Parameters › Transformations › Trans Use No Lock","description":"","searchText":"reference parameters transformations trans use no lock overview trans use no lock is a transformations parameter that controls use nolock hint in regular transformations: 0 - no, 1 - yes. function use this setting to keep transformation generation and execution consistent across the project. analyticscreator uses this value when no custom value is saved for the project. access the parameter is maintained from the parameters list in analyticscreator. how to access navigation tree parameters->list parameters toolbar options->parameter diagram not opened from the diagram. visual element parameter list default value 1 custom value not set. where it is used this parameter belongs to the transformations group and is used when analyticscreator applies transformation generation and execution. setting value technical parameter name trans_use_nolock default value 1 custom value not set. parameter groups group transformations modeling transform related topics transformations trans friendly names as column names transformation calendar fact pattern parameters previous trans alias alias nextssis packages"}
,{"id":389870784710,"name":"SSIS Packages","type":"subsection","path":"/docs/reference/parameters/parameters-ssis-packages","breadcrumb":"Reference › Parameters › SSIS Packages","description":"","searchText":"reference parameters ssis packages controls generated ssis package buffering, fast-load, and execution behavior. use this page to find the ssis packages settings, review their defaults, and open the detailed parameter pages. available parameters parameter technical name default value purpose ssis command timeout ssis_command_timeout not set. ssis commandtimeout property. will not be set if empty. ssis delay connection validation ssis_delay_connection_validation 0 delay ssis connection validation. 0 - no, 1 - yes. ssis export bulk insert ssis_export_bulk_insert 1 ssis parameter for export package. ssis export default buffer max rows ssis_export_defaultbuffermaxrows 10000 ssis parameter for export package. ssis export default buffer size ssis_export_defaultbuffersize 10485760 ssis parameter for export package. ssis export fastload check constraints ssis_export_fastload_checkconstraints 0 ssis parameter for export package. ssis export fastload keep identity ssis_export_fastload_keepidentity 0 ssis parameter for export package. ssis export fastload keep nulls ssis_export_fastload_keepnulls 0 ssis parameter for export package. ssis export fastload max insert commit size ssis_export_fastload_maxinsertcommitsize 50000 ssis parameter for export package. ssis export fastload rows per batch ssis_export_fastload_rowsperbatch 10000 ssis parameter for export package. ssis export fastload table lock ssis_export_fastload_tablelock 1 ssis parameter for export package. ssis hist default buffer max rows ssis_hist_defaultbuffermaxrows 10000 ssis parameter for historization package. ssis hist default buffer size ssis_hist_defaultbuffersize 10485760 ssis parameter for historization package. ssis hist fastload check constraints ssis_hist_fastload_checkconstraints 1 ssis parameter for historization package. ssis hist fastload keep identity ssis_hist_fastload_keepidentity 0 ssis parameter for historization package. ssis hist fastload keep nulls ssis_hist_fastload_keepnulls 0 ssis parameter for historization package. ssis hist fastload max insert commit size ssis_hist_fastload_maxinsertcommitsize 50000 ssis parameter for historization package. ssis hist fastload rows per batch ssis_hist_fastload_rowsperbatch 10000 ssis parameter for historization package. ssis hist fastload table lock ssis_hist_fastload_tablelock 1 ssis parameter for historization package. ssis imp default buffer max rows ssis_imp_defaultbuffermaxrows 10000 ssis parameter for import package. ssis imp default buffer size ssis_imp_defaultbuffersize 10485760 ssis parameter for import package. ssis imp fastload check constraints ssis_imp_fastload_checkconstraints 0 ssis parameter for import package. ssis imp fastload keep identity ssis_imp_fastload_keepidentity 0 ssis parameter for import package. ssis imp fastload keep nulls ssis_imp_fastload_keepnulls 0 ssis parameter for import package. ssis imp fastload max insert commit size ssis_imp_fastload_maxinsertcommitsize 50000 ssis parameter for import package. ssis imp fastload rows per batch ssis_imp_fastload_rowsperbatch 10000 ssis parameter for import package. ssis imp fastload table lock ssis_imp_fastload_tablelock 1 ssis parameter for import package. ssis not store connection strings in package ssis_not_store_connection_strings_in_package 0 do not store connection strings in the ssis package. 0 - store, 1 - not store. ssis replace decimal separator ssis_replace_decimal_separator 1 0 - do not replace, 1 - replace point by comma, 2 - replace comma by point. previous trans use no lock nextssis replace decimal separator"}
,{"id":389872719074,"name":"SSIS Replace Decimal Separator","type":"topic","path":"/docs/reference/parameters/parameters-ssis-packages/parameters-ssis-packages-ssis-replace-decimal-separator","breadcrumb":"Reference › Parameters › SSIS Packages › SSIS Replace Decimal Separator","description":"","searchText":"reference parameters ssis packages ssis replace decimal separator overview ssis replace decimal separator is an ssis packages parameter that controls whether the decimal separator is replaced in generated ssis packages. function use this setting to keep generated ssis package execution consistent across the project. analyticscreator uses this value when no custom value is saved for the project. access the parameter is maintained from the parameters list in analyticscreator. how to access navigation tree parameters->list parameters toolbar options->parameter diagram not opened from the diagram. visual element parameter list default value 1 custom value not set. where it is used this parameter belongs to the ssis packages group and is used when analyticscreator applies generated ssis package execution. setting value technical parameter name ssis_replace_decimal_separator default value 1 custom value not set. parameter groups group ssis packages ssis runtime ssis related topics ssis packages ssis not store connection strings in package parameters previous ssis packages nextssis command timeout"}
,{"id":389872719075,"name":"SSIS Command Timeout","type":"topic","path":"/docs/reference/parameters/parameters-ssis-packages/parameters-ssis-packages-ssis-command-timeout","breadcrumb":"Reference › Parameters › SSIS Packages › SSIS Command Timeout","description":"","searchText":"reference parameters ssis packages ssis command timeout overview ssis command timeout is a ssis packages parameter that controls the ssis commandtimeout property. will not be set if empty. function use this setting to keep generated ssis package execution consistent across the project. analyticscreator uses this value when no custom value is saved for the project. access the parameter is maintained from the parameters list in analyticscreator. how to access navigation tree parameters->list parameters toolbar options->parameter diagram not opened from the diagram. visual element parameter list default value not set. custom value not set. where it is used this parameter belongs to the ssis packages group and is used when analyticscreator applies generated ssis package execution. setting value technical parameter name ssis_command_timeout default value not set. custom value not set. parameter groups group ssis packages ssis runtime ssis related topics ssis packages ssis delay connection validation parameters previous ssis replace decimal separator nextssis imp default buffer max rows"}
,{"id":389872719076,"name":"SSIS Imp Default Buffer Max Rows","type":"topic","path":"/docs/reference/parameters/parameters-ssis-packages/parameters-ssis-packages-ssis-imp-default-buffer-max-rows","breadcrumb":"Reference › Parameters › SSIS Packages › SSIS Imp Default Buffer Max Rows","description":"","searchText":"reference parameters ssis packages ssis imp default buffer max rows overview ssis imp default buffer max rows is a ssis packages parameter that controls the defaultbuffermaxrows property of the generated ssis import package. function use this setting to keep generated ssis package execution consistent across the project. analyticscreator uses this value when no custom value is saved for the project. access the parameter is maintained from the parameters list in analyticscreator. how to access navigation tree parameters->list parameters toolbar options->parameter diagram not opened from the diagram. visual element parameter list default value 10000 custom value not set. where it is used this parameter belongs to the ssis packages group and is used when analyticscreator applies generated ssis package execution. setting value technical parameter name ssis_imp_defaultbuffermaxrows default value 10000 custom value not set. parameter groups group ssis packages ssis runtime ssis related topics ssis packages ssis hist fastload table lock ssis imp default buffer size parameters previous ssis command timeout nextssis imp default buffer size"}
,{"id":389872719077,"name":"SSIS Imp Default Buffer Size","type":"topic","path":"/docs/reference/parameters/parameters-ssis-packages/parameters-ssis-packages-ssis-imp-default-buffer-size","breadcrumb":"Reference › Parameters › SSIS Packages › SSIS Imp Default Buffer Size","description":"","searchText":"reference parameters ssis packages ssis imp default buffer size overview ssis imp default buffer size is a ssis packages parameter that controls the defaultbuffersize property of the generated ssis import package. function use this setting to keep generated ssis package execution consistent across the project. analyticscreator uses this value when no custom value is saved for the project. access the parameter is maintained from the parameters list in analyticscreator. how to access navigation tree parameters->list parameters toolbar options->parameter diagram not opened from the diagram. visual element parameter list default value 10485760 custom value not set. where it is used this parameter belongs to the ssis packages group and is used when analyticscreator applies generated ssis package execution. setting value technical parameter name ssis_imp_defaultbuffersize default value 10485760 custom value not set. parameter groups group ssis packages ssis runtime ssis related topics ssis packages ssis imp default buffer max rows ssis imp fastload check constraints parameters previous ssis imp default buffer max rows nextssis imp fastload max insert commit size"}
,{"id":389872719078,"name":"SSIS Imp Fastload Max Insert Commit Size","type":"topic","path":"/docs/reference/parameters/parameters-ssis-packages/parameters-ssis-packages-ssis-imp-fastload-max-insert-commit-size","breadcrumb":"Reference › Parameters › SSIS Packages › SSIS Imp Fastload Max Insert Commit Size","description":"","searchText":"reference parameters ssis packages ssis imp fastload max insert commit size overview ssis imp fastload max insert commit size is an ssis packages parameter that controls the maximum insert commit size used during fast load in the generated ssis import package. function use this setting to keep generated ssis package execution consistent across the project. analyticscreator uses this value when no custom value is saved for the project. access the parameter is maintained from the parameters list in analyticscreator. how to access navigation tree parameters->list parameters toolbar options->parameter diagram not opened from the diagram. visual element parameter list default value 50000 custom value not set. where it is used this parameter belongs to the ssis packages group and is used when analyticscreator applies generated ssis package execution. setting value technical parameter name ssis_imp_fastload_maxinsertcommitsize default value 50000 custom value not set. parameter groups group ssis packages ssis runtime ssis related topics ssis packages ssis imp fastload keep nulls ssis imp fastload rows per batch parameters previous ssis imp default buffer size nextssis imp fastload keep identity"}
,{"id":389872719079,"name":"SSIS Imp Fastload Keep Identity","type":"topic","path":"/docs/reference/parameters/parameters-ssis-packages/parameters-ssis-packages-ssis-imp-fastload-keep-identity","breadcrumb":"Reference › Parameters › SSIS Packages › SSIS Imp Fastload Keep Identity","description":"","searchText":"reference parameters ssis packages ssis imp fastload keep identity overview ssis imp fastload keep identity is a ssis packages parameter that controls the fast-load keep_identity option of the generated ssis import package. function use this setting to keep generated ssis package execution consistent across the project. analyticscreator uses this value when no custom value is saved for the project. access the parameter is maintained from the parameters list in analyticscreator. how to access navigation tree parameters->list parameters toolbar options->parameter diagram not opened from the diagram. visual element parameter list default value 0 custom value not set. where it is used this parameter belongs to the ssis packages group and is used when analyticscreator applies generated ssis package execution. setting value technical parameter name ssis_imp_fastload_keepidentity default value 0 custom value not set. parameter groups group ssis packages ssis runtime ssis related topics ssis packages ssis imp fastload check constraints ssis imp fastload keep nulls parameters previous ssis imp fastload max insert commit size nextssis imp fastload keep nulls"}
,{"id":389872719080,"name":"SSIS Imp Fastload Keep Nulls","type":"topic","path":"/docs/reference/parameters/parameters-ssis-packages/parameters-ssis-packages-ssis-imp-fastload-keep-nulls","breadcrumb":"Reference › Parameters › SSIS Packages › SSIS Imp Fastload Keep Nulls","description":"","searchText":"reference parameters ssis packages ssis imp fastload keep nulls overview ssis imp fastload keep nulls is an ssis packages parameter that controls whether null values are kept during fast load in the generated ssis import package. function use this setting to keep generated ssis package execution consistent across the project. analyticscreator uses this value when no custom value is saved for the project. access the parameter is maintained from the parameters list in analyticscreator. how to access navigation tree parameters->list parameters toolbar options->parameter diagram not opened from the diagram. visual element parameter list default value 0 custom value not set. where it is used this parameter belongs to the ssis packages group and is used when analyticscreator applies generated ssis package execution. setting value technical parameter name ssis_imp_fastload_keepnulls default value 0 custom value not set. parameter groups group ssis packages ssis runtime ssis related topics ssis packages ssis imp fastload keep identity ssis imp fastload max insert commit size parameters previous ssis imp fastload keep identity nextssis imp fastload table lock"}
,{"id":389872719081,"name":"SSIS Imp Fastload Table Lock","type":"topic","path":"/docs/reference/parameters/parameters-ssis-packages/parameters-ssis-packages-ssis-imp-fastload-table-lock","breadcrumb":"Reference › Parameters › SSIS Packages › SSIS Imp Fastload Table Lock","description":"","searchText":"reference parameters ssis packages ssis imp fastload table lock overview ssis imp fastload table lock is an ssis packages parameter that controls whether a table lock is taken during fast load in the generated ssis import package. function use this setting to keep generated ssis package execution consistent across the project. analyticscreator uses this value when no custom value is saved for the project. access the parameter is maintained from the parameters list in analyticscreator. how to access navigation tree parameters->list parameters toolbar options->parameter diagram not opened from the diagram. visual element parameter list default value 1 custom value not set. where it is used this parameter belongs to the ssis packages group and is used when analyticscreator applies generated ssis package execution. setting value technical parameter name ssis_imp_fastload_tablelock default value 1 custom value not set. parameter groups group ssis packages ssis runtime ssis related topics ssis packages ssis imp fastload rows per batch ssis not store connection strings in package parameters previous ssis imp fastload keep nulls nextssis imp fastload check constraints"}
,{"id":389872719082,"name":"SSIS Imp Fastload Check Constraints","type":"topic","path":"/docs/reference/parameters/parameters-ssis-packages/parameters-ssis-packages-ssis-imp-fastload-check-constraints","breadcrumb":"Reference › Parameters › SSIS Packages › SSIS Imp Fastload Check Constraints","description":"","searchText":"reference parameters ssis packages ssis imp fastload check constraints overview ssis imp fastload check constraints is a ssis packages parameter that controls the fast-load check_constraints option of the generated ssis import package. function use this setting to keep generated ssis package execution consistent across the project. analyticscreator uses this value when no custom value is saved for the project. access the parameter is maintained from the parameters list in analyticscreator. how to access navigation tree parameters->list parameters toolbar options->parameter diagram not opened from the diagram. visual element parameter list default value 0 custom value not set. where it is used this parameter belongs to the ssis packages group and is used when analyticscreator applies generated ssis package execution. setting value technical parameter name ssis_imp_fastload_checkconstraints default value 0 custom value not set. parameter groups group ssis packages ssis runtime ssis related topics ssis packages ssis imp default buffer size ssis imp fastload keep identity parameters previous ssis imp fastload table lock nextssis imp fastload rows per batch"}
,{"id":389872719083,"name":"SSIS Imp Fastload Rows Per Batch","type":"topic","path":"/docs/reference/parameters/parameters-ssis-packages/parameters-ssis-packages-ssis-imp-fastload-rows-per-batch","breadcrumb":"Reference › Parameters › SSIS Packages › SSIS Imp Fastload Rows Per Batch","description":"","searchText":"reference parameters ssis packages ssis imp fastload rows per batch overview ssis imp fastload rows per batch is an ssis packages parameter that controls the rows-per-batch setting used during fast load in the generated ssis import package. function use this setting to keep generated ssis package execution consistent across the project. analyticscreator uses this value when no custom value is saved for the project. access the parameter is maintained from the parameters list in analyticscreator. how to access navigation tree parameters->list parameters toolbar options->parameter diagram not opened from the diagram. visual element parameter list default value 10000 custom value not set. where it is used this parameter belongs to the ssis packages group and is used when analyticscreator applies generated ssis package execution. setting value technical parameter name ssis_imp_fastload_rowsperbatch default value 10000 custom value not set. parameter groups group ssis packages ssis runtime ssis related topics ssis packages ssis imp fastload max insert commit size ssis imp fastload table lock parameters previous ssis imp fastload check constraints nextssis export default buffer max rows"}
,{"id":389872719084,"name":"SSIS Export Default Buffer Max Rows","type":"topic","path":"/docs/reference/parameters/parameters-ssis-packages/parameters-ssis-packages-ssis-export-default-buffer-max-rows","breadcrumb":"Reference › Parameters › SSIS Packages › SSIS Export Default Buffer Max Rows","description":"","searchText":"reference parameters ssis packages ssis export default buffer max rows overview ssis export default buffer max rows is a ssis packages parameter that controls the defaultbuffermaxrows property of the generated ssis export package. function use this setting to keep generated ssis package execution consistent across the project. analyticscreator uses this value when no custom value is saved for the project. access the parameter is maintained from the parameters list in analyticscreator. how to access navigation tree parameters->list parameters toolbar options->parameter diagram not opened from the diagram. visual element parameter list default value 10000 custom value not set. where it is used this parameter belongs to the ssis packages group and is used when analyticscreator applies generated ssis package execution. setting value technical parameter name ssis_export_defaultbuffermaxrows default value 10000 custom value not set. parameter groups group ssis packages ssis runtime ssis related topics ssis packages ssis export bulk insert ssis export default buffer size parameters previous ssis imp fastload rows per batch nextssis export default buffer size"}
,{"id":389872719085,"name":"SSIS Export Default Buffer Size","type":"topic","path":"/docs/reference/parameters/parameters-ssis-packages/parameters-ssis-packages-ssis-export-default-buffer-size","breadcrumb":"Reference › Parameters › SSIS Packages › SSIS Export Default Buffer Size","description":"","searchText":"reference parameters ssis packages ssis export default buffer size overview ssis export default buffer size is a ssis packages parameter that controls the defaultbuffersize property of the generated ssis export package. function use this setting to keep generated ssis package execution consistent across the project. analyticscreator uses this value when no custom value is saved for the project. access the parameter is maintained from the parameters list in analyticscreator. how to access navigation tree parameters->list parameters toolbar options->parameter diagram not opened from the diagram. visual element parameter list default value 10485760 custom value not set. where it is used this parameter belongs to the ssis packages group and is used when analyticscreator applies generated ssis package execution. setting value technical parameter name ssis_export_defaultbuffersize default value 10485760 custom value not set. parameter groups group ssis packages ssis runtime ssis related topics ssis packages ssis export default buffer max rows ssis export fastload check constraints parameters previous ssis export default buffer max rows nextssis export fastload max insert commit size"}
,{"id":389872719086,"name":"SSIS Export Fastload Max Insert Commit Size","type":"topic","path":"/docs/reference/parameters/parameters-ssis-packages/parameters-ssis-packages-ssis-export-fastload-max-insert-commit-size","breadcrumb":"Reference › Parameters › SSIS Packages › SSIS Export Fastload Max Insert Commit Size","description":"","searchText":"reference parameters ssis packages ssis export fastload max insert commit size overview ssis export fastload max insert commit size is a ssis packages parameter that controls the fast-load maximum insert commit size of the generated ssis export package. function use this setting to keep generated ssis package execution consistent across the project. analyticscreator uses this value when no custom value is saved for the project. access the parameter is maintained from the parameters list in analyticscreator. how to access navigation tree parameters->list parameters toolbar options->parameter diagram not opened from the diagram. visual element parameter list default value 50000 custom value not set. where it is used this parameter belongs to the ssis packages group and is used when analyticscreator applies generated ssis package execution. setting value technical parameter name ssis_export_fastload_maxinsertcommitsize default value 50000 custom value not set. parameter groups group ssis packages ssis runtime ssis related topics ssis packages ssis export fastload keep nulls ssis export fastload rows per batch parameters previous ssis export default buffer size nextssis export fastload keep identity"}
,{"id":389872719087,"name":"SSIS Export Fastload Keep Identity","type":"topic","path":"/docs/reference/parameters/parameters-ssis-packages/parameters-ssis-packages-ssis-export-fastload-keep-identity","breadcrumb":"Reference › Parameters › SSIS Packages › SSIS Export Fastload Keep Identity","description":"","searchText":"reference parameters ssis packages ssis export fastload keep identity overview ssis export fastload keep identity is a ssis packages parameter that controls the fast-load keep_identity option of the generated ssis export package. function use this setting to keep generated ssis package execution consistent across the project. analyticscreator uses this value when no custom value is saved for the project. access the parameter is maintained from the parameters list in analyticscreator. how to access navigation tree parameters->list parameters toolbar options->parameter diagram not opened from the diagram. visual element parameter list default value 0 custom value not set. where it is used this parameter belongs to the ssis packages group and is used when analyticscreator applies generated ssis package execution. setting value technical parameter name ssis_export_fastload_keepidentity default value 0 custom value not set. parameter groups group ssis packages ssis runtime ssis related topics ssis packages ssis export fastload check constraints ssis export fastload keep nulls parameters previous ssis export fastload max insert commit size nextssis export fastload keep nulls"}
,{"id":389872719088,"name":"SSIS Export Fastload Keep Nulls","type":"topic","path":"/docs/reference/parameters/parameters-ssis-packages/parameters-ssis-packages-ssis-export-fastload-keep-nulls","breadcrumb":"Reference › Parameters › SSIS Packages › SSIS Export Fastload Keep Nulls","description":"","searchText":"reference parameters ssis packages ssis export fastload keep nulls overview ssis export fastload keep nulls is a ssis packages parameter that controls the fast-load keep_nulls option of the generated ssis export package. function use this setting to keep generated ssis package execution consistent across the project. analyticscreator uses this value when no custom value is saved for the project. access the parameter is maintained from the parameters list in analyticscreator. how to access navigation tree parameters->list parameters toolbar options->parameter diagram not opened from the diagram. visual element parameter list default value 0 custom value not set. where it is used this parameter belongs to the ssis packages group and is used when analyticscreator applies generated ssis package execution. setting value technical parameter name ssis_export_fastload_keepnulls default value 0 custom value not set. parameter groups group ssis packages ssis runtime ssis related topics ssis packages ssis export fastload keep identity ssis export fastload max insert commit size parameters previous ssis export fastload keep identity nextssis export fastload table lock"}
,{"id":389872719089,"name":"SSIS Export Fastload Table Lock","type":"topic","path":"/docs/reference/parameters/parameters-ssis-packages/parameters-ssis-packages-ssis-export-fastload-table-lock","breadcrumb":"Reference › Parameters › SSIS Packages › SSIS Export Fastload Table Lock","description":"","searchText":"reference parameters ssis packages ssis export fastload table lock overview ssis export fastload table lock is a ssis packages parameter that controls the fast-load tablock option of the generated ssis export package. function use this setting to keep generated ssis package execution consistent across the project. analyticscreator uses this value when no custom value is saved for the project. access the parameter is maintained from the parameters list in analyticscreator. how to access navigation tree parameters->list parameters toolbar options->parameter diagram not opened from the diagram. visual element parameter list default value 1 custom value not set. where it is used this parameter belongs to the ssis packages group and is used when analyticscreator applies generated ssis package execution. setting value technical parameter name ssis_export_fastload_tablelock default value 1 custom value not set. parameter groups group ssis packages ssis runtime ssis related topics ssis packages ssis export fastload rows per batch ssis hist default buffer max rows parameters previous ssis export fastload keep nulls nextssis export fastload check constraints"}
,{"id":389872719090,"name":"SSIS Export Fastload Check Constraints","type":"topic","path":"/docs/reference/parameters/parameters-ssis-packages/parameters-ssis-packages-ssis-export-fastload-check-constraints","breadcrumb":"Reference › Parameters › SSIS Packages › SSIS Export Fastload Check Constraints","description":"","searchText":"reference parameters ssis packages ssis export fastload check constraints overview ssis export fastload check constraints is a ssis packages parameter that controls the fast-load check_constraints option of the generated ssis export package. function use this setting to keep generated ssis package execution consistent across the project. analyticscreator uses this value when no custom value is saved for the project. access the parameter is maintained from the parameters list in analyticscreator. how to access navigation tree parameters->list parameters toolbar options->parameter diagram not opened from the diagram. visual element parameter list default value 0 custom value not set. where it is used this parameter belongs to the ssis packages group and is used when analyticscreator applies generated ssis package execution. setting value technical parameter name ssis_export_fastload_checkconstraints default value 0 custom value not set. parameter groups group ssis packages ssis runtime ssis related topics ssis packages ssis export default buffer size ssis export fastload keep identity parameters previous ssis export fastload table lock nextssis export fastload rows per batch"}
,{"id":389872719091,"name":"SSIS Export Fastload Rows Per Batch","type":"topic","path":"/docs/reference/parameters/parameters-ssis-packages/parameters-ssis-packages-ssis-export-fastload-rows-per-batch","breadcrumb":"Reference › Parameters › SSIS Packages › SSIS Export Fastload Rows Per Batch","description":"","searchText":"reference parameters ssis packages ssis export fastload rows per batch overview ssis export fastload rows per batch is a ssis packages parameter that controls the fast-load rows per batch setting of the generated ssis export package. function use this setting to keep generated ssis package execution consistent across the project. analyticscreator uses this value when no custom value is saved for the project. access the parameter is maintained from the parameters list in analyticscreator. how to access navigation tree parameters->list parameters toolbar options->parameter diagram not opened from the diagram. visual element parameter list default value 10000 custom value not set. where it is used this parameter belongs to the ssis packages group and is used when analyticscreator applies generated ssis package execution. setting value technical parameter name ssis_export_fastload_rowsperbatch default value 10000 custom value not set. parameter groups group ssis packages ssis runtime ssis related topics ssis packages ssis export fastload max insert commit size ssis export fastload table lock parameters previous ssis export fastload check constraints nextssis export bulk insert"}
,{"id":389872719092,"name":"SSIS Export Bulk Insert","type":"topic","path":"/docs/reference/parameters/parameters-ssis-packages/parameters-ssis-packages-ssis-export-bulk-insert","breadcrumb":"Reference › Parameters › SSIS Packages › SSIS Export Bulk Insert","description":"","searchText":"reference parameters ssis packages ssis export bulk insert overview ssis export bulk insert is a ssis packages parameter that controls the bulk insert behavior of the generated ssis export package. function use this setting to keep generated ssis package execution consistent across the project. analyticscreator uses this value when no custom value is saved for the project. access the parameter is maintained from the parameters list in analyticscreator. how to access navigation tree parameters->list parameters toolbar options->parameter diagram not opened from the diagram. visual element parameter list default value 1 custom value not set. where it is used this parameter belongs to the ssis packages group and is used when analyticscreator applies generated ssis package execution. setting value technical parameter name ssis_export_bulk_insert default value 1 custom value not set. parameter groups group ssis packages ssis runtime ssis related topics ssis packages ssis delay connection validation ssis export default buffer max rows parameters previous ssis export fastload rows per batch nextssis hist default buffer max rows"}
,{"id":389872719093,"name":"SSIS Hist Default Buffer Max Rows","type":"topic","path":"/docs/reference/parameters/parameters-ssis-packages/parameters-ssis-packages-ssis-hist-default-buffer-max-rows","breadcrumb":"Reference › Parameters › SSIS Packages › SSIS Hist Default Buffer Max Rows","description":"","searchText":"reference parameters ssis packages ssis hist default buffer max rows overview ssis hist default buffer max rows is a ssis packages parameter that controls the defaultbuffermaxrows property of the generated ssis historization package. function use this setting to keep generated ssis package execution consistent across the project. analyticscreator uses this value when no custom value is saved for the project. access the parameter is maintained from the parameters list in analyticscreator. how to access navigation tree parameters->list parameters toolbar options->parameter diagram not opened from the diagram. visual element parameter list default value 10000 custom value not set. where it is used this parameter belongs to the ssis packages group and is used when analyticscreator applies generated ssis package execution. setting value technical parameter name ssis_hist_defaultbuffermaxrows default value 10000 custom value not set. parameter groups group ssis packages ssis runtime ssis related topics ssis packages ssis export fastload table lock ssis hist default buffer size parameters previous ssis export bulk insert nextssis hist default buffer size"}
,{"id":389872719094,"name":"SSIS Hist Default Buffer Size","type":"topic","path":"/docs/reference/parameters/parameters-ssis-packages/parameters-ssis-packages-ssis-hist-default-buffer-size","breadcrumb":"Reference › Parameters › SSIS Packages › SSIS Hist Default Buffer Size","description":"","searchText":"reference parameters ssis packages ssis hist default buffer size overview ssis hist default buffer size is a ssis packages parameter that controls the defaultbuffersize property of the generated ssis historization package. function use this setting to keep generated ssis package execution consistent across the project. analyticscreator uses this value when no custom value is saved for the project. access the parameter is maintained from the parameters list in analyticscreator. how to access navigation tree parameters->list parameters toolbar options->parameter diagram not opened from the diagram. visual element parameter list default value 10485760 custom value not set. where it is used this parameter belongs to the ssis packages group and is used when analyticscreator applies generated ssis package execution. setting value technical parameter name ssis_hist_defaultbuffersize default value 10485760 custom value not set. parameter groups group ssis packages ssis runtime ssis related topics ssis packages ssis hist default buffer max rows ssis hist fastload check constraints parameters previous ssis hist default buffer max rows nextssis hist fastload max insert commit size"}
,{"id":389872719095,"name":"SSIS Hist Fastload Max Insert Commit Size","type":"topic","path":"/docs/reference/parameters/parameters-ssis-packages/parameters-ssis-packages-ssis-hist-fastload-max-insert-commit-size","breadcrumb":"Reference › Parameters › SSIS Packages › SSIS Hist Fastload Max Insert Commit Size","description":"","searchText":"reference parameters ssis packages ssis hist fastload max insert commit size overview ssis hist fastload max insert commit size is a ssis packages parameter that controls the fast-load maximum insert commit size of the generated ssis historization package. function use this setting to keep generated ssis package execution consistent across the project. analyticscreator uses this value when no custom value is saved for the project. access the parameter is maintained from the parameters list in analyticscreator. how to access navigation tree parameters->list parameters toolbar options->parameter diagram not opened from the diagram. visual element parameter list default value 50000 custom value not set. where it is used this parameter belongs to the ssis packages group and is used when analyticscreator applies generated ssis package execution. setting value technical parameter name ssis_hist_fastload_maxinsertcommitsize default value 50000 custom value not set. parameter groups group ssis packages ssis runtime ssis related topics ssis packages ssis hist fastload keep nulls ssis hist fastload rows per batch parameters previous ssis hist default buffer size nextssis hist fastload keep identity"}
,{"id":389872719096,"name":"SSIS Hist Fastload Keep Identity","type":"topic","path":"/docs/reference/parameters/parameters-ssis-packages/parameters-ssis-packages-ssis-hist-fastload-keep-identity","breadcrumb":"Reference › Parameters › SSIS Packages › SSIS Hist Fastload Keep Identity","description":"","searchText":"reference parameters ssis packages ssis hist fastload keep identity overview ssis hist fastload keep identity is a ssis packages parameter that controls the fast-load keep_identity option of the generated ssis historization package. function use this setting to keep generated ssis package execution consistent across the project. analyticscreator uses this value when no custom value is saved for the project. access the parameter is maintained from the parameters list in analyticscreator. how to access navigation tree parameters->list parameters toolbar options->parameter diagram not opened from the diagram. visual element parameter list default value 0 custom value not set. where it is used this parameter belongs to the ssis packages group and is used when analyticscreator applies generated ssis package execution. setting value technical parameter name ssis_hist_fastload_keepidentity default value 0 custom value not set. parameter groups group ssis packages ssis runtime ssis related topics ssis packages ssis hist fastload check constraints ssis hist fastload keep nulls parameters previous ssis hist fastload max insert commit size nextssis hist fastload keep nulls"}
,{"id":389872719097,"name":"SSIS Hist Fastload Keep Nulls","type":"topic","path":"/docs/reference/parameters/parameters-ssis-packages/parameters-ssis-packages-ssis-hist-fastload-keep-nulls","breadcrumb":"Reference › Parameters › SSIS Packages › SSIS Hist Fastload Keep Nulls","description":"","searchText":"reference parameters ssis packages ssis hist fastload keep nulls overview ssis hist fastload keep nulls is a ssis packages parameter that controls the fast-load keep_nulls option of the generated ssis historization package. function use this setting to keep generated ssis package execution consistent across the project. analyticscreator uses this value when no custom value is saved for the project. access the parameter is maintained from the parameters list in analyticscreator. how to access navigation tree parameters->list parameters toolbar options->parameter diagram not opened from the diagram. visual element parameter list default value 0 custom value not set. where it is used this parameter belongs to the ssis packages group and is used when analyticscreator applies generated ssis package execution. setting value technical parameter name ssis_hist_fastload_keepnulls default value 0 custom value not set. parameter groups group ssis packages ssis runtime ssis related topics ssis packages ssis hist fastload keep identity ssis hist fastload max insert commit size parameters previous ssis hist fastload keep identity nextssis hist fastload table lock"}
,{"id":389872720058,"name":"SSIS Hist Fastload Table Lock","type":"topic","path":"/docs/reference/parameters/parameters-ssis-packages/parameters-ssis-packages-ssis-hist-fastload-table-lock","breadcrumb":"Reference › Parameters › SSIS Packages › SSIS Hist Fastload Table Lock","description":"","searchText":"reference parameters ssis packages ssis hist fastload table lock overview ssis hist fastload table lock is a ssis packages parameter that controls the fast-load tablock option of the generated ssis historization package. function use this setting to keep generated ssis package execution consistent across the project. analyticscreator uses this value when no custom value is saved for the project. access the parameter is maintained from the parameters list in analyticscreator. how to access navigation tree parameters->list parameters toolbar options->parameter diagram not opened from the diagram. visual element parameter list default value 1 custom value not set. where it is used this parameter belongs to the ssis packages group and is used when analyticscreator applies generated ssis package execution. setting value technical parameter name ssis_hist_fastload_tablelock default value 1 custom value not set. parameter groups group ssis packages ssis runtime ssis related topics ssis packages ssis hist fastload rows per batch ssis imp default buffer max rows parameters previous ssis hist fastload keep nulls nextssis hist fastload check constraints"}
,{"id":389872720059,"name":"SSIS Hist Fastload Check Constraints","type":"topic","path":"/docs/reference/parameters/parameters-ssis-packages/parameters-ssis-packages-ssis-hist-fastload-check-constraints","breadcrumb":"Reference › Parameters › SSIS Packages › SSIS Hist Fastload Check Constraints","description":"","searchText":"reference parameters ssis packages ssis hist fastload check constraints overview ssis hist fastload check constraints is a ssis packages parameter that controls the fast-load check_constraints option of the generated ssis historization package. function use this setting to keep generated ssis package execution consistent across the project. analyticscreator uses this value when no custom value is saved for the project. access the parameter is maintained from the parameters list in analyticscreator. how to access navigation tree parameters->list parameters toolbar options->parameter diagram not opened from the diagram. visual element parameter list default value 1 custom value not set. where it is used this parameter belongs to the ssis packages group and is used when analyticscreator applies generated ssis package execution. setting value technical parameter name ssis_hist_fastload_checkconstraints default value 1 custom value not set. parameter groups group ssis packages ssis runtime ssis related topics ssis packages ssis hist default buffer size ssis hist fastload keep identity parameters previous ssis hist fastload table lock nextssis hist fastload rows per batch"}
,{"id":389872720060,"name":"SSIS Hist Fastload Rows Per Batch","type":"topic","path":"/docs/reference/parameters/parameters-ssis-packages/parameters-ssis-packages-ssis-hist-fastload-rows-per-batch","breadcrumb":"Reference › Parameters › SSIS Packages › SSIS Hist Fastload Rows Per Batch","description":"","searchText":"reference parameters ssis packages ssis hist fastload rows per batch overview ssis hist fastload rows per batch is a ssis packages parameter that controls the fast-load rows per batch setting of the generated ssis historization package. function use this setting to keep generated ssis package execution consistent across the project. analyticscreator uses this value when no custom value is saved for the project. access the parameter is maintained from the parameters list in analyticscreator. how to access navigation tree parameters->list parameters toolbar options->parameter diagram not opened from the diagram. visual element parameter list default value 10000 custom value not set. where it is used this parameter belongs to the ssis packages group and is used when analyticscreator applies generated ssis package execution. setting value technical parameter name ssis_hist_fastload_rowsperbatch default value 10000 custom value not set. parameter groups group ssis packages ssis runtime ssis related topics ssis packages ssis hist fastload max insert commit size ssis hist fastload table lock parameters previous ssis hist fastload check constraints nextssis delay connection validation"}
,{"id":389872720061,"name":"SSIS Delay Connection Validation","type":"topic","path":"/docs/reference/parameters/parameters-ssis-packages/parameters-ssis-packages-ssis-delay-connection-validation","breadcrumb":"Reference › Parameters › SSIS Packages › SSIS Delay Connection Validation","description":"","searchText":"reference parameters ssis packages ssis delay connection validation overview ssis delay connection validation is a ssis packages parameter that controls whether analyticscreator delays ssis connection validation. 0 - no, 1 - yes. function use this setting to keep generated ssis package execution consistent across the project. numeric values in this parameter act as choices; use the description to interpret each option. access the parameter is maintained from the parameters list in analyticscreator. how to access navigation tree parameters->list parameters toolbar options->parameter diagram not opened from the diagram. visual element parameter list default value 0 custom value not set. where it is used this parameter belongs to the ssis packages group and is used when analyticscreator applies generated ssis package execution. setting value technical parameter name ssis_delay_connection_validation default value 0 custom value not set. parameter groups group ssis packages ssis runtime ssis related topics ssis packages ssis command timeout ssis export bulk insert parameters previous ssis hist fastload rows per batch nextssis not store connection strings in package"}
,{"id":389872720062,"name":"SSIS Not Store Connection Strings In Package","type":"topic","path":"/docs/reference/parameters/parameters-ssis-packages/parameters-ssis-packages-ssis-not-store-connection-strings-in-package","breadcrumb":"Reference › Parameters › SSIS Packages › SSIS Not Store Connection Strings In Package","description":"","searchText":"reference parameters ssis packages ssis not store connection strings in package overview ssis not store connection strings in package is an ssis packages parameter that controls whether connection strings are stored in the ssis package: 0 - store, 1 - do not store. function use this setting to keep generated ssis package execution consistent across the project. analyticscreator uses this value when no custom value is saved for the project. access the parameter is maintained from the parameters list in analyticscreator. how to access navigation tree parameters->list parameters toolbar options->parameter diagram not opened from the diagram. visual element parameter list default value 0 custom value not set. where it is used this parameter belongs to the ssis packages group and is used when analyticscreator applies generated ssis package execution. setting value technical parameter name ssis_not_store_connection_strings_in_package default value 0 custom value not set. parameter groups group ssis packages ssis runtime ssis related topics ssis packages ssis imp fastload table lock ssis replace decimal separator parameters previous ssis delay connection validation nextcsv import"}
,{"id":389870784711,"name":"CSV Import","type":"subsection","path":"/docs/reference/parameters/parameters-csv-import","breadcrumb":"Reference › Parameters › CSV Import","description":"","searchText":"reference parameters csv import controls how csv files are scanned and interpreted during source import. use this page to find the csv import settings, review their defaults, and open the detailed parameter pages. available parameters parameter technical name default value purpose csv empty string length csv_empty_string_length 50 length of empty string fields. csv min string length csv_min_string_length 50 minimum length of string fields. csv scan rows csv_scan_rows 500 count of rows scanned to get the field properties. previous ssis not store connection strings in package nextcsv scan rows"}
,{"id":389872720063,"name":"CSV Scan Rows","type":"topic","path":"/docs/reference/parameters/parameters-csv-import/parameters-csv-import-csv-scan-rows","breadcrumb":"Reference › Parameters › CSV Import › CSV Scan Rows","description":"","searchText":"reference parameters csv import csv scan rows overview csv scan rows is a csv import parameter that sets the number of rows scanned to get the field properties. function use this setting to keep csv import profiling and field detection consistent across the project. analyticscreator uses this value when no custom value is saved for the project. access the parameter is maintained from the parameters list in analyticscreator. how to access navigation tree parameters->list parameters toolbar options->parameter diagram not opened from the diagram. visual element parameter list default value 500 custom value not set. where it is used this parameter belongs to the csv import group and is used when analyticscreator applies csv import profiling and field detection. setting value technical parameter name csv_scan_rows default value 500 custom value not set. parameter groups group csv import csv profiling csv related topics csv import csv min string length parameters previous csv import nextcsv empty string length"}
,{"id":389872720064,"name":"CSV Empty String Length","type":"topic","path":"/docs/reference/parameters/parameters-csv-import/parameters-csv-import-csv-empty-string-length","breadcrumb":"Reference › Parameters › CSV Import › CSV Empty String Length","description":"","searchText":"reference parameters csv import csv empty string length overview csv empty string length is a csv import parameter that sets the length of empty string fields. function use this setting to keep csv import profiling and field detection consistent across the project. analyticscreator uses this value when no custom value is saved for the project. access the parameter is maintained from the parameters list in analyticscreator. how to access navigation tree parameters->list parameters toolbar options->parameter diagram not opened from the diagram. visual element parameter list default value 50 custom value not set. where it is used this parameter belongs to the csv import group and is used when analyticscreator applies csv import profiling and field detection. setting value technical parameter name csv_empty_string_length default value 50 custom value not set. parameter groups group csv import csv profiling csv related topics csv import csv min string length parameters previous csv scan rows nextcsv min string length"}
,{"id":389872720065,"name":"CSV Min String Length","type":"topic","path":"/docs/reference/parameters/parameters-csv-import/parameters-csv-import-csv-min-string-length","breadcrumb":"Reference › Parameters › CSV Import › CSV Min String Length","description":"","searchText":"reference parameters csv import csv min string length overview csv min string length is a csv import parameter that sets the minimum length of string fields. function use this setting to keep csv import profiling and field detection consistent across the project. analyticscreator uses this value when no custom value is saved for the project. access the parameter is maintained from the parameters list in analyticscreator. how to access navigation tree parameters->list parameters toolbar options->parameter diagram not opened from the diagram. visual element parameter list default value 50 custom value not set. where it is used this parameter belongs to the csv import group and is used when analyticscreator applies csv import profiling and field detection. setting value technical parameter name csv_min_string_length default value 50 custom value not set. parameter groups group csv import csv profiling csv related topics csv import csv empty string length csv scan rows parameters previous csv empty string length nextsynchronization"}
,{"id":389870784712,"name":"Synchronization","type":"subsection","path":"/docs/reference/parameters/parameters-synchronization","breadcrumb":"Reference › Parameters › Synchronization","description":"","searchText":"reference parameters synchronization configures synchronization, retry, and metadata-update behavior. use this page to find the synchronization settings, review their defaults, and open the detailed parameter pages. available parameters parameter technical name default value purpose sync timeout sync_timeout 900 timeout for dwh synchronization, sec. synchronization fix repo synchronization_fix_repo 1 check and fix repository. 0 - no, 1 - yes. synchronization refresh synchronization_refresh 0 refresh diagram: 0-full, 1-selected group, 2-new objects, 3-none. synchronization renew relations synchronization_renew_relations 1 recalculate relations. 0 - no, 1 - yes. synchronization sync synchronization_sync 0 synchronization: 0-full, 1-selected group. synchronization update anonymization synchronization_update_anonymization 1 update anonymization properties. 0 - no, 1 - yes. synchronization update column dependencies synchronization_update_column_dependencies 1 recalculate column dependencies. 0 - no, 1 - yes. synchronization update descriptions synchronization_update_descriptions 1 update object descriptions. 0 - no, 1 - yes. synchronization update friendly names synchronization_update_friendly_names 1 update object friendly names. 0 - no, 1 - yes. synchronization update object groups synchronization_update_object_groups 1 update object group membership. 0 - no, 1 - yes. synchronization update olap references synchronization_update_olap_references 1 set empty olap references based on relations between datamart objects. 0 - no, 1 - yes. synchronization update test cases synchronization_update_test_cases 1 update test case stored procedures. 0 - no, 1 - yes. synchronize num attempts synchronize_num_attempts 6 count of attempts to create a transformation during synchronization. previous csv min string length nextsync timeout"}
,{"id":389872720066,"name":"Sync Timeout","type":"topic","path":"/docs/reference/parameters/parameters-synchronization/parameters-synchronization-sync-timeout","breadcrumb":"Reference › Parameters › Synchronization › Sync Timeout","description":"","searchText":"reference parameters synchronization sync timeout overview sync timeout is a synchronization parameter that controls the timeout (in seconds) for dwh synchronization. function use this setting to keep repository synchronization consistent across the project. analyticscreator uses this value when no custom value is saved for the project. access the parameter is maintained from the parameters list in analyticscreator. how to access navigation tree parameters->list parameters toolbar options->parameter diagram not opened from the diagram. visual element parameter list default value 900 custom value not set. where it is used this parameter belongs to the synchronization group and is used when analyticscreator applies repository synchronization. setting value technical parameter name sync_timeout default value 900 custom value not set. parameter groups group synchronization sync & retry sync related topics synchronization synchronization fix repo parameters previous synchronization nextsynchronize num attempts"}
,{"id":389871309043,"name":"Synchronize Num Attempts","type":"topic","path":"/docs/reference/parameters/parameters-synchronization/parameters-synchronization-synchronize-num-attempts","breadcrumb":"Reference › Parameters › Synchronization › Synchronize Num Attempts","description":"","searchText":"reference parameters synchronization synchronize num attempts overview synchronize num attempts is a synchronization parameter that sets the number of attempts to create a transformation during synchronization. function use this setting to keep repository synchronization consistent across the project. analyticscreator uses this value when no custom value is saved for the project. access the parameter is maintained from the parameters list in analyticscreator. how to access navigation tree parameters->list parameters toolbar options->parameter diagram not opened from the diagram. visual element parameter list default value 6 custom value not set. where it is used this parameter belongs to the synchronization group and is used when analyticscreator applies repository synchronization. setting value technical parameter name synchronize_num_attempts default value 6 custom value not set. parameter groups group synchronization sync & retry sync related topics synchronization synchronization update test cases parameters previous sync timeout nextsynchronization fix repo"}
,{"id":389871309044,"name":"Synchronization Fix Repo","type":"topic","path":"/docs/reference/parameters/parameters-synchronization/parameters-synchronization-synchronization-fix-repo","breadcrumb":"Reference › Parameters › Synchronization › Synchronization Fix Repo","description":"","searchText":"reference parameters synchronization synchronization fix repo overview synchronization fix repo is a synchronization parameter that controls whether the repository is checked and fixed: 0 - no, 1 - yes. function use this setting to keep repository synchronization consistent across the project. numeric values in this parameter act as choices; use the description to interpret each option. access the parameter is maintained from the parameters list in analyticscreator. how to access navigation tree parameters->list parameters toolbar options->parameter diagram not opened from the diagram. visual element parameter list default value 1 custom value not set. where it is used this parameter belongs to the synchronization group and is used when analyticscreator applies repository synchronization. setting value technical parameter name synchronization_fix_repo default value 1 custom value not set. parameter groups group synchronization sync & retry sync related topics synchronization sync timeout synchronization refresh parameters previous synchronize num attempts nextsynchronization renew relations"}
,{"id":389871309045,"name":"Synchronization Renew Relations","type":"topic","path":"/docs/reference/parameters/parameters-synchronization/parameters-synchronization-synchronization-renew-relations","breadcrumb":"Reference › Parameters › Synchronization › Synchronization Renew Relations","description":"","searchText":"reference parameters synchronization synchronization renew relations overview synchronization renew relations is a synchronization parameter that controls whether relations are recalculated: 0 - no, 1 - yes. function use this setting to keep repository synchronization consistent across the project. numeric values in this parameter act as choices; use the description to interpret each option. access the parameter is maintained from the parameters list in analyticscreator. how to access navigation tree parameters->list parameters toolbar options->parameter diagram not opened from the diagram. visual element parameter list default value 1 custom value not set. where it is used this parameter belongs to the synchronization group and is used when analyticscreator applies repository synchronization. setting value technical parameter name synchronization_renew_relations default value 1 custom value not set. parameter groups group synchronization sync & retry sync related topics synchronization synchronization refresh synchronization sync parameters previous synchronization fix repo nextsynchronization update descriptions"}
,{"id":389871309046,"name":"Synchronization Update Descriptions","type":"topic","path":"/docs/reference/parameters/parameters-synchronization/parameters-synchronization-synchronization-update-descriptions","breadcrumb":"Reference › Parameters › Synchronization › Synchronization Update Descriptions","description":"","searchText":"reference parameters synchronization synchronization update descriptions overview synchronization update descriptions is a synchronization parameter that controls whether object descriptions are updated: 0 - no, 1 - yes. function use this setting to keep repository synchronization consistent across the project. numeric values in this parameter act as choices; use the description to interpret each option. access the parameter is maintained from the parameters list in analyticscreator. how to access navigation tree parameters->list parameters toolbar options->parameter diagram not opened from the diagram. visual element parameter list default value 1 custom value not set. where it is used this parameter belongs to the synchronization group and is used when analyticscreator applies repository synchronization. setting value technical parameter name synchronization_update_descriptions default value 1 custom value not set. parameter groups group synchronization sync & retry sync related topics synchronization synchronization update column dependencies synchronization update friendly names parameters previous synchronization renew relations nextsynchronization update friendly names"}
,{"id":389871309047,"name":"Synchronization Update Friendly Names","type":"topic","path":"/docs/reference/parameters/parameters-synchronization/parameters-synchronization-synchronization-update-friendly-names","breadcrumb":"Reference › Parameters › Synchronization › Synchronization Update Friendly Names","description":"","searchText":"reference parameters synchronization synchronization update friendly names overview synchronization update friendly names is a synchronization parameter that controls whether object friendly names are updated: 0 - no, 1 - yes. function use this setting to keep repository synchronization consistent across the project. numeric values in this parameter act as choices; use the description to interpret each option. access the parameter is maintained from the parameters list in analyticscreator. how to access navigation tree parameters->list parameters toolbar options->parameter diagram not opened from the diagram. visual element parameter list default value 1 custom value not set. where it is used this parameter belongs to the synchronization group and is used when analyticscreator applies repository synchronization. setting value technical parameter name synchronization_update_friendly_names default value 1 custom value not set. parameter groups group synchronization sync & retry sync related topics synchronization synchronization update descriptions synchronization update object groups parameters previous synchronization update descriptions nextsynchronization update anonymization"}
,{"id":389871309048,"name":"Synchronization Update Anonymization","type":"topic","path":"/docs/reference/parameters/parameters-synchronization/parameters-synchronization-synchronization-update-anonymization","breadcrumb":"Reference › Parameters › Synchronization › Synchronization Update Anonymization","description":"","searchText":"reference parameters synchronization synchronization update anonymization overview synchronization update anonymization is a synchronization parameter that controls whether anonymization properties are updated: 0 - no, 1 - yes. function use this setting to keep repository synchronization consistent across the project. numeric values in this parameter act as choices; use the description to interpret each option. access the parameter is maintained from the parameters list in analyticscreator. how to access navigation tree parameters->list parameters toolbar options->parameter diagram not opened from the diagram. visual element parameter list default value 1 custom value not set. where it is used this parameter belongs to the synchronization group and is used when analyticscreator applies repository synchronization. setting value technical parameter name synchronization_update_anonymization default value 1 custom value not set. parameter groups group synchronization sync & retry sync related topics synchronization synchronization sync synchronization update column dependencies parameters previous synchronization update friendly names nextsynchronization update column dependencies"}
,{"id":389871309049,"name":"Synchronization Update Column Dependencies","type":"topic","path":"/docs/reference/parameters/parameters-synchronization/parameters-synchronization-synchronization-update-column-dependencies","breadcrumb":"Reference › Parameters › Synchronization › Synchronization Update Column Dependencies","description":"","searchText":"reference parameters synchronization synchronization update column dependencies overview synchronization update column dependencies is a synchronization parameter that controls whether column dependencies are recalculated: 0 - no, 1 - yes. function use this setting to keep repository synchronization consistent across the project. numeric values in this parameter act as choices; use the description to interpret each option. access the parameter is maintained from the parameters list in analyticscreator. how to access navigation tree parameters->list parameters toolbar options->parameter diagram not opened from the diagram. visual element parameter list default value 1 custom value not set. where it is used this parameter belongs to the synchronization group and is used when analyticscreator applies repository synchronization. setting value technical parameter name synchronization_update_column_dependencies default value 1 custom value not set. parameter groups group synchronization sync & retry sync related topics synchronization synchronization update anonymization synchronization update descriptions parameters previous synchronization update anonymization nextsynchronization update object groups"}
,{"id":389871310010,"name":"Synchronization Update Object Groups","type":"topic","path":"/docs/reference/parameters/parameters-synchronization/parameters-synchronization-synchronization-update-object-groups","breadcrumb":"Reference › Parameters › Synchronization › Synchronization Update Object Groups","description":"","searchText":"reference parameters synchronization synchronization update object groups overview synchronization update object groups is a synchronization parameter that controls whether object group membership is updated: 0 - no, 1 - yes. function use this setting to keep repository synchronization consistent across the project. numeric values in this parameter act as choices; use the description to interpret each option. access the parameter is maintained from the parameters list in analyticscreator. how to access navigation tree parameters->list parameters toolbar options->parameter diagram not opened from the diagram. visual element parameter list default value 1 custom value not set. where it is used this parameter belongs to the synchronization group and is used when analyticscreator applies repository synchronization. setting value technical parameter name synchronization_update_object_groups default value 1 custom value not set. parameter groups group synchronization sync & retry sync related topics synchronization synchronization update friendly names synchronization update olap references parameters previous synchronization update column dependencies nextsynchronization update olap references"}
,{"id":389871310011,"name":"Synchronization Update OLAP References","type":"topic","path":"/docs/reference/parameters/parameters-synchronization/parameters-synchronization-synchronization-update-olap-references","breadcrumb":"Reference › Parameters › Synchronization › Synchronization Update OLAP References","description":"","searchText":"reference parameters synchronization synchronization update olap references overview synchronization update olap references is a synchronization parameter that controls whether empty olap references are set based on relations between datamart objects: 0 - no, 1 - yes. function use this setting to keep repository synchronization consistent across the project. numeric values in this parameter act as choices; use the description to interpret each option. access the parameter is maintained from the parameters list in analyticscreator. how to access navigation tree parameters->list parameters toolbar options->parameter diagram not opened from the diagram. visual element parameter list default value 1 custom value not set. where it is used this parameter belongs to the synchronization group and is used when analyticscreator applies repository synchronization. setting value technical parameter name synchronization_update_olap_references default value 1 custom value not set. parameter groups group synchronization sync & retry sync related topics synchronization synchronization update object groups synchronization update test cases parameters previous synchronization update object groups nextsynchronization update test cases"}
,{"id":389871310012,"name":"Synchronization Update Test Cases","type":"topic","path":"/docs/reference/parameters/parameters-synchronization/parameters-synchronization-synchronization-update-test-cases","breadcrumb":"Reference › Parameters › Synchronization › Synchronization Update Test Cases","description":"","searchText":"reference parameters synchronization synchronization update test cases overview synchronization update test cases is a synchronization parameter that controls whether test case stored procedures are updated: 0 - no, 1 - yes. function use this setting to keep repository synchronization consistent across the project. numeric values in this parameter act as choices; use the description to interpret each option. access the parameter is maintained from the parameters list in analyticscreator. how to access navigation tree parameters->list parameters toolbar options->parameter diagram not opened from the diagram. visual element parameter list default value 1 custom value not set. where it is used this parameter belongs to the synchronization group and is used when analyticscreator applies repository synchronization. setting value technical parameter name synchronization_update_test_cases default value 1 custom value not set. parameter groups group synchronization sync & retry sync related topics synchronization synchronization update olap references synchronize num attempts parameters previous synchronization update olap references nextsynchronization sync"}
,{"id":389871310013,"name":"Synchronization Sync","type":"topic","path":"/docs/reference/parameters/parameters-synchronization/parameters-synchronization-synchronization-sync","breadcrumb":"Reference › Parameters › Synchronization › Synchronization Sync","description":"","searchText":"reference parameters synchronization synchronization sync overview synchronization sync is a synchronization parameter that controls the scope of synchronization: 0 - full, 1 - selected group. function use this setting to keep repository synchronization consistent across the project. analyticscreator uses this value when no custom value is saved for the project. access the parameter is maintained from the parameters list in analyticscreator. how to access navigation tree parameters->list parameters toolbar options->parameter diagram not opened from the diagram. visual element parameter list default value 0 custom value not set. where it is used this parameter belongs to the synchronization group and is used when analyticscreator applies repository synchronization. setting value technical parameter name synchronization_sync default value 0 custom value not set. parameter groups group synchronization sync & retry sync related topics synchronization synchronization renew relations synchronization update anonymization parameters previous synchronization update test cases nextsynchronization refresh"}
,{"id":389871310014,"name":"Synchronization Refresh","type":"topic","path":"/docs/reference/parameters/parameters-synchronization/parameters-synchronization-synchronization-refresh","breadcrumb":"Reference › Parameters › Synchronization › Synchronization Refresh","description":"","searchText":"reference parameters synchronization synchronization refresh overview synchronization refresh is a synchronization parameter that controls how the diagram is refreshed: 0 - full, 1 - selected group, 2 - new objects, 3 - none. function use this setting to keep repository synchronization consistent across the project. analyticscreator uses this value when no custom value is saved for the project. access the parameter is maintained from the parameters list in analyticscreator. how to access navigation tree parameters->list parameters toolbar options->parameter diagram not opened from the diagram. visual element parameter list default value 0 custom value not set. where it is used this parameter belongs to the synchronization group and is used when analyticscreator applies repository synchronization. setting value technical parameter name synchronization_refresh default value 0 custom value not set. parameter groups group synchronization sync & retry sync related topics synchronization synchronization fix repo synchronization renew relations parameters previous synchronization sync nextengine timeout"}
,{"id":389870784713,"name":"Engine Timeout","type":"subsection","path":"/docs/reference/parameters/parameters-engine-timeout","breadcrumb":"Reference › Parameters › Engine Timeout","description":"","searchText":"reference parameters engine timeout defines timeout behavior for engine-driven execution tasks. use this page to find the engine timeout settings, review their defaults, and open the detailed parameter pages. available parameters parameter technical name default value purpose objectscript timeout objectscript_timeout 180 timeout for object scripts, sec. previous synchronization refresh nextobjectscript timeout"}
,{"id":389871310015,"name":"Objectscript Timeout","type":"topic","path":"/docs/reference/parameters/parameters-engine-timeout/parameters-engine-timeout-objectscript-timeout","breadcrumb":"Reference › Parameters › Engine Timeout › Objectscript Timeout","description":"","searchText":"reference parameters engine timeout objectscript timeout overview objectscript timeout is an engine timeout parameter that controls the timeout (in seconds) for object scripts. function use this setting to keep long-running engine tasks consistent across the project. analyticscreator uses this value when no custom value is saved for the project. access the parameter is maintained from the parameters list in analyticscreator. how to access navigation tree parameters->list parameters toolbar options->parameter diagram not opened from the diagram. visual element parameter list default value 180 custom value not set. where it is used this parameter belongs to the engine timeout group and is used when analyticscreator applies long-running engine tasks. setting value technical parameter name objectscript_timeout default value 180 custom value not set. parameter groups group engine timeout runtime timeout related topics engine timeout parameters previous engine timeout nextdeployment"}
,{"id":389870784714,"name":"Deployment","type":"subsection","path":"/docs/reference/parameters/parameters-deployment","breadcrumb":"Reference › Parameters › Deployment","description":"","searchText":"reference parameters deployment configures generated database objects and deployment artifacts. use this page to find the deployment settings, review their defaults, and open the detailed parameter pages. available parameters parameter technical name default value purpose dacpac model storage type dacpac_model_storage_type 1 dacpac model storage type: 0-file, 1-memory. deployment create subdirectory deployment_create_subdirectory 1 create a subdirectory for every created deployment package. 0-no (all files in output directory will be deleted), 1-yes. default - 1. deployment do not drop object types deployment_do_not_drop_object_types aggregates,applicationroles,assemblies,asymmetrickeys,brokerpriorities,certificates,contracts,databaseroles,databasetriggers,fulltextcatalogs,fulltextstoplists,messagetypes,partitionfunctions,partitionschemes,permissions,queues,remoteservicebindings,rolemembership,rules,searchpropertylists,sequences,services,signatures,symmetrickeys,synonyms,userdefineddatatypes,userdefinedtabletypes,clruserdefinedtypes,users,xmlschemacollections,audits,credentials,cryptographicproviders,databaseauditspecifications,endpoints,errormessages,eventnotifications,eventsessions,linkedserverlogins,linkedservers,logins,routes,serverauditspecifications,serverrolemembership,serverroles,servertriggers comma-separated list of object types (see description of sqlpackage.exe). dwh metadata in extended properties dwh_metadata_in_extended_properties 1 store metadata as extended properties of database objects. index compression type index_compression_type 1 default index compression type in case table compression type is none or columnstore index (otherwise indexes will have the same compression type as tables): 1-none, 2-page, 3-row. table compression type table_compression_type 1 default table compression type: 1-none, 2-page, 3-row, 4-columnstore index. previous objectscript timeout nexttable compression type"}
,{"id":388515715288,"name":"Table Compression Type","type":"topic","path":"/docs/reference/parameters/parameters-deployment/parameters-deployment-table-compression-type","breadcrumb":"Reference › Parameters › Deployment › Table Compression Type","description":"","searchText":"reference parameters deployment table compression type overview table compression type is a deployment parameter that controls the default table compression type: 1 - none, 2 - page, 3 - row, 4 - columnstore index. function use this setting to keep deployment and generated database artifact creation consistent across the project. analyticscreator uses this value when no custom value is saved for the project. access the parameter is maintained from the parameters list in analyticscreator. how to access navigation tree parameters->list parameters toolbar options->parameter diagram not opened from the diagram. visual element parameter list default value 1 custom value not set. where it is used this parameter belongs to the deployment group and is used when analyticscreator applies deployment and generated database artifact creation. setting value technical parameter name table_compression_type default value 1 custom value not set. parameter groups group deployment database options storage related topics deployment index compression type parameters previous deployment nextindex compression type"}
,{"id":389871310016,"name":"Index Compression Type","type":"topic","path":"/docs/reference/parameters/parameters-deployment/parameters-deployment-index-compression-type","breadcrumb":"Reference › Parameters › Deployment › Index Compression Type","description":"","searchText":"reference parameters deployment index compression type overview index compression type is a deployment parameter that controls the default index compression type when the table compression type is none or columnstore index (otherwise indexes will have the same compression type as tables): 1-none, 2-page, 3-row. function use this setting to keep deployment and generated database artifact creation consistent across the project. analyticscreator uses this value when no custom value is saved for the project. access the parameter is maintained from the parameters list in analyticscreator. how to access navigation tree parameters->list parameters toolbar options->parameter diagram not opened from the diagram. visual element parameter list default value 1 custom value not set. where it is used this parameter belongs to the deployment group and is used when analyticscreator applies deployment and generated database artifact creation. setting value technical parameter name index_compression_type default value 1 custom value not set. parameter groups group deployment database options storage related topics deployment dwh metadata in extended properties table compression type parameters previous table compression type nextdeployment do not drop object types"}
,{"id":389871310017,"name":"Deployment Do Not Drop Object Types","type":"topic","path":"/docs/reference/parameters/parameters-deployment/parameters-deployment-deployment-do-not-drop-object-types","breadcrumb":"Reference › Parameters › Deployment › Deployment Do Not Drop Object Types","description":"","searchText":"reference parameters deployment deployment do not drop object types overview deployment do not drop object types is a deployment parameter that controls the comma-separated list of object types (see the description of sqlpackage.exe). function use this setting to keep deployment and generated database artifact creation consistent across the project. analyticscreator uses this value when no custom value is saved for the project. access the parameter is maintained from the parameters list in analyticscreator. how to access navigation tree parameters->list parameters toolbar options->parameter diagram not opened from the diagram. visual element parameter list default value aggregates,applicationroles,assemblies,asymmetrickeys,brokerpriorities,certificates,contracts,databaseroles,databasetriggers,fulltextcatalogs,fulltextstoplists,messagetypes,partitionfunctions,partitionschemes,permissions,queues,remoteservicebindings,rolemembership,rules,searchpropertylists,sequences,services,signatures,symmetrickeys,synonyms,userdefineddatatypes,userdefinedtabletypes,clruserdefinedtypes,users,xmlschemacollections,audits,credentials,cryptographicproviders,databaseauditspecifications,endpoints,errormessages,eventnotifications,eventsessions,linkedserverlogins,linkedservers,logins,routes,serverauditspecifications,serverrolemembership,serverroles,servertriggers custom value not set. where it is used this parameter belongs to the deployment group and is used when analyticscreator applies deployment and generated database artifact creation. setting value technical parameter name deployment_do_not_drop_object_types default value aggregates,applicationroles,assemblies,asymmetrickeys,brokerpriorities,certificates,contracts,databaseroles,databasetriggers,fulltextcatalogs,fulltextstoplists,messagetypes,partitionfunctions,partitionschemes,permissions,queues,remoteservicebindings,rolemembership,rules,searchpropertylists,sequences,services,signatures,symmetrickeys,synonyms,userdefineddatatypes,userdefinedtabletypes,clruserdefinedtypes,users,xmlschemacollections,audits,credentials,cryptographicproviders,databaseauditspecifications,endpoints,errormessages,eventnotifications,eventsessions,linkedserverlogins,linkedservers,logins,routes,serverauditspecifications,serverrolemembership,serverroles,servertriggers custom value not set. parameter groups group deployment database options storage related topics deployment deployment create subdirectory dwh metadata in extended properties parameters previous index compression type nextdeployment create subdirectory"}
,{"id":388515715281,"name":"Deployment Create Subdirectory","type":"topic","path":"/docs/reference/parameters/parameters-deployment/parameters-deployment-deployment-create-subdirectory","breadcrumb":"Reference › Parameters › Deployment › Deployment Create Subdirectory","description":"","searchText":"reference parameters deployment deployment create subdirectory overview deployment create subdirectory is a deployment parameter that controls whether analyticscreator creates a subdirectory for every created deployment package. 0-no (all files in output directory will be deleted), 1-yes. default - 1. function use this setting to keep deployment and generated database artifact creation consistent across the project. analyticscreator uses this value when no custom value is saved for the project. access the parameter is maintained from the parameters list in analyticscreator. how to access navigation tree parameters->list parameters toolbar options->parameter diagram not opened from the diagram. visual element parameter list default value 1 custom value not set. where it is used this parameter belongs to the deployment group and is used when analyticscreator applies deployment and generated database artifact creation. setting value technical parameter name deployment_create_subdirectory default value 1 custom value not set. parameter groups group deployment database options storage related topics deployment dacpac model storage type deployment do not drop object types parameters previous deployment do not drop object types nextdacpac model storage type"}
,{"id":389871310018,"name":"DACPAC Model Storage Type","type":"topic","path":"/docs/reference/parameters/parameters-deployment/parameters-deployment-dacpac-model-storage-type","breadcrumb":"Reference › Parameters › Deployment › DACPAC Model Storage Type","description":"","searchText":"reference parameters deployment dacpac model storage type overview dacpac model storage type is a deployment parameter that controls the dacpac model storage type: 0 - file, 1 - memory. function use this setting to keep deployment and generated database artifact creation consistent across the project. analyticscreator uses this value when no custom value is saved for the project. access the parameter is maintained from the parameters list in analyticscreator. how to access navigation tree parameters->list parameters toolbar options->parameter diagram not opened from the diagram. visual element parameter list default value 1 custom value not set. where it is used this parameter belongs to the deployment group and is used when analyticscreator applies deployment and generated database artifact creation. setting value technical parameter name dacpac_model_storage_type default value 1 custom value not set. parameter groups group deployment database options storage related topics deployment deployment create subdirectory parameters previous deployment create subdirectory nextdwh metadata in extended properties"}
,{"id":388515715283,"name":"DWH Metadata In Extended Properties","type":"topic","path":"/docs/reference/parameters/parameters-deployment/parameters-deployment-dwh-metadata-in-extended-properties","breadcrumb":"Reference › Parameters › Deployment › DWH Metadata In Extended Properties","description":"","searchText":"reference parameters deployment dwh metadata in extended properties overview dwh metadata in extended properties is a deployment parameter that controls whether metadata is stored as extended properties of database objects. function use this setting to keep deployment and generated database artifact creation consistent across the project. analyticscreator uses this value when no custom value is saved for the project. access the parameter is maintained from the parameters list in analyticscreator. how to access navigation tree parameters->list parameters toolbar options->parameter diagram not opened from the diagram. visual element parameter list default value 1 custom value not set. where it is used this parameter belongs to the deployment group and is used when analyticscreator applies deployment and generated database artifact creation. setting value technical parameter name dwh_metadata_in_extended_properties default value 1 custom value not set. parameter groups group deployment database options storage related topics deployment deployment do not drop object types index compression type parameters previous dacpac model storage type nexthistorization"}
,{"id":389870784715,"name":"Historization","type":"subsection","path":"/docs/reference/parameters/parameters-historization","breadcrumb":"Reference › Parameters › Historization","description":"","searchText":"reference parameters historization configures historization and persisting behavior. use this page to find the historization settings, review their defaults, and open the detailed parameter pages. available parameters parameter technical name default value purpose hist default type hist_default_type 2 1- ssis package, 2 - stored procedure. hist default use vaultid hist_default_use_vaultid 1 0 - don't use vault_hub_id as primary key. 1 - use vault_hub_id as primary key. hist do not close hist_do_not_close 0 default value of \"missing record behaviour\" parameter for new historizations. 0 - close, 1 - don't close. hist empty record field name hist_empty_record_fieldname is_empty_record name of the column to identify empty records in the historized tables. hist proc use hash join hist_proc_use_hash_join 1 use hash join hint in historizing sp to speed up sql except command. 0 - no, 1 - yes. hist proc use no lock hist_proc_use_nolock 1 use nolock hint in historizing stored procedures: 0 - no, 1 - yes. hist valid to mode hist_valid_to_mode 0 subtract 2 milliseconds from the valid-to date: 0 - yes, 1 - no. pers default part switch pers_default_partswitch 2 0 - none, 1 - partition switching, 2 - renaming. persist num attempts persist_num_attempts 5 number of attempts to persist transformation in persisting stored procedure. persist pause between attempts persist_pause_between_attempts 00:00:10 pause between attempts to persist transformation in persisting stored procedure. format: hh:mm:ss. persist use transactions persist_use_transactions 1 use transactions in persisting procedures. 0 - no, 1 - yes (default). previous dwh metadata in extended properties nextpers default part switch"}
,{"id":388515715286,"name":"Pers Default Part Switch","type":"topic","path":"/docs/reference/parameters/parameters-historization/parameters-historization-pers-default-part-switch","breadcrumb":"Reference › Parameters › Historization › Pers Default Part Switch","description":"","searchText":"reference parameters historization pers default part switch overview pers default part switch is a historization parameter that sets the default partition switch mode: 0 - none, 1 - partition switching, 2 - renaming. function use this setting to keep historization and persisting processing consistent across the project. analyticscreator uses this value when no custom value is saved for the project. access the parameter is maintained from the parameters list in analyticscreator. how to access navigation tree parameters->list parameters toolbar options->parameter diagram not opened from the diagram. visual element parameter list default value 2 custom value not set. where it is used this parameter belongs to the historization group and is used when analyticscreator applies historization and persisting processing. setting value technical parameter name pers_default_partswitch default value 2 custom value not set. parameter groups group historization persisting history related topics historization hist valid to mode persist num attempts parameters previous historization nexthist default type"}
,{"id":389871310019,"name":"Hist Default Type","type":"topic","path":"/docs/reference/parameters/parameters-historization/parameters-historization-hist-default-type","breadcrumb":"Reference › Parameters › Historization › Hist Default Type","description":"","searchText":"reference parameters historization hist default type overview hist default type is a historization parameter that sets the default historization object type: 1 - ssis package, 2 - stored procedure. function use this setting to keep historization and persisting processing consistent across the project. analyticscreator uses this value when no custom value is saved for the project. access the parameter is maintained from the parameters list in analyticscreator. how to access navigation tree parameters->list parameters toolbar options->parameter diagram not opened from the diagram. visual element parameter list default value 2 custom value not set. where it is used this parameter belongs to the historization group and is used when analyticscreator applies historization and persisting processing. setting value technical parameter name hist_default_type default value 2 custom value not set. parameter groups group historization persisting history related topics historization hist default use vaultid parameters previous pers default part switch nexthist do not close"}
,{"id":389871310020,"name":"Hist Do Not Close","type":"topic","path":"/docs/reference/parameters/parameters-historization/parameters-historization-hist-do-not-close","breadcrumb":"Reference › Parameters › Historization › Hist Do Not Close","description":"","searchText":"reference parameters historization hist do not close overview hist do not close is a historization parameter that controls the default value of the \"missing record behaviour\" parameter for new historizations. 0 - close, 1 - don't close. function use this setting to keep historization and persisting processing consistent across the project. analyticscreator uses this value when no custom value is saved for the project. access the parameter is maintained from the parameters list in analyticscreator. how to access navigation tree parameters->list parameters toolbar options->parameter diagram not opened from the diagram. visual element parameter list default value 0 custom value not set. where it is used this parameter belongs to the historization group and is used when analyticscreator applies historization and persisting processing. setting value technical parameter name hist_do_not_close default value 0 custom value not set. parameter groups group historization persisting history related topics historization hist default use vaultid hist empty record field name parameters previous hist default type nexthist default use vaultid"}
,{"id":389871310021,"name":"Hist Default Use Vaultid","type":"topic","path":"/docs/reference/parameters/parameters-historization/parameters-historization-hist-default-use-vaultid","breadcrumb":"Reference › Parameters › Historization › Hist Default Use Vaultid","description":"","searchText":"reference parameters historization hist default use vaultid overview hist default use vaultid is a historization parameter that controls whether vault_hub_id is used as the primary key: 0 - no, 1 - yes. function use this setting to keep historization and persisting processing consistent across the project. analyticscreator uses this value when no custom value is saved for the project. access the parameter is maintained from the parameters list in analyticscreator. how to access navigation tree parameters->list parameters toolbar options->parameter diagram not opened from the diagram. visual element parameter list default value 1 custom value not set. where it is used this parameter belongs to the historization group and is used when analyticscreator applies historization and persisting processing. setting value technical parameter name hist_default_use_vaultid default value 1 custom value not set. parameter groups group historization persisting history related topics historization hist default type hist do not close parameters previous hist do not close nexthist valid to mode"}
,{"id":389871310022,"name":"Hist Valid To Mode","type":"topic","path":"/docs/reference/parameters/parameters-historization/parameters-historization-hist-valid-to-mode","breadcrumb":"Reference › Parameters › Historization › Hist Valid To Mode","description":"","searchText":"reference parameters historization hist valid to mode overview hist valid to mode is a historization parameter that controls whether 2 milliseconds are subtracted from the valid-to date: 0 - yes, 1 - no. function use this setting to keep historization and persisting processing consistent across the project. numeric values in this parameter act as choices; use the description to interpret each option. access the parameter is maintained from the parameters list in analyticscreator. how to access navigation tree parameters->list parameters toolbar options->parameter diagram not opened from the diagram. visual element parameter list default value 0 custom value not set. where it is used this parameter belongs to the historization group and is used when analyticscreator applies historization and persisting processing. setting value technical parameter name hist_valid_to_mode default value 0 custom value not set. parameter groups group historization persisting history related topics historization hist proc use no lock pers default part switch parameters previous hist default use vaultid nexthist proc use hash join"}
,{"id":388515715284,"name":"Hist Proc Use Hash Join","type":"topic","path":"/docs/reference/parameters/parameters-historization/parameters-historization-hist-proc-use-hash-join","breadcrumb":"Reference › Parameters › Historization › Hist Proc Use Hash Join","description":"","searchText":"reference parameters historization hist proc use hash join overview hist proc use hash join is a historization parameter that controls whether the hash join hint is used in the historizing stored procedure to speed up the sql except command. 0 - no, 1 - yes. function use this setting to keep historization and persisting processing consistent across the project. numeric values in this parameter act as choices; use the description to interpret each option. access the parameter is maintained from the parameters list in analyticscreator. how to access navigation tree parameters->list parameters toolbar options->parameter diagram not opened from the diagram. visual element parameter list default value 1 custom value not set. where it is used this parameter belongs to the historization group and is used when analyticscreator applies historization and persisting processing. setting value technical parameter name hist_proc_use_hash_join default value 1 custom value not set. parameter groups group historization persisting history related topics historization hist empty record field name hist proc use no lock parameters previous hist valid to mode nexthist proc use no lock"}
,{"id":389871310023,"name":"Hist Proc Use No Lock","type":"topic","path":"/docs/reference/parameters/parameters-historization/parameters-historization-hist-proc-use-no-lock","breadcrumb":"Reference › Parameters › Historization › Hist Proc Use No Lock","description":"","searchText":"reference parameters historization hist proc use no lock overview hist proc use no lock is a historization parameter that controls whether the nolock hint is used in historizing stored procedures: 0 - no, 1 - yes function use this setting to keep historization and persisting processing consistent across the project. analyticscreator uses this value when no custom value is saved for the project. access the parameter is maintained from the parameters list in analyticscreator. how to access navigation tree parameters->list parameters toolbar options->parameter diagram not opened from the diagram. visual element parameter list default value 1 custom value not set. where it is used this parameter belongs to the historization group and is used when analyticscreator applies historization and persisting processing. setting value technical parameter name hist_proc_use_nolock default value 1 custom value not set. parameter groups group historization persisting history related topics historization hist proc use hash join hist valid to mode parameters previous hist proc use hash join nextpersist num attempts"}
,{"id":389871310024,"name":"Persist Num Attempts","type":"topic","path":"/docs/reference/parameters/parameters-historization/parameters-historization-persist-num-attempts","breadcrumb":"Reference › Parameters › Historization › Persist Num Attempts","description":"","searchText":"reference parameters historization persist num attempts overview persist num attempts is a historization parameter that controls the number of attempts to persist a transformation in the persisting stored procedure. function use this setting to keep historization and persisting processing consistent across the project. analyticscreator uses this value when no custom value is saved for the project. access the parameter is maintained from the parameters list in analyticscreator. how to access navigation tree parameters->list parameters toolbar options->parameter diagram not opened from the diagram. visual element parameter list default value 5 custom value not set. where it is used this parameter belongs to the historization group and is used when analyticscreator applies historization and persisting processing. setting value technical parameter name persist_num_attempts default value 5 custom value not set. parameter groups group historization persisting history related topics historization pers default part switch persist pause between attempts parameters previous hist proc use no lock nextpersist pause between attempts"}
,{"id":389871310025,"name":"Persist Pause Between Attempts","type":"topic","path":"/docs/reference/parameters/parameters-historization/parameters-historization-persist-pause-between-attempts","breadcrumb":"Reference › Parameters › Historization › Persist Pause Between Attempts","description":"","searchText":"reference parameters historization persist pause between attempts overview persist pause between attempts is a historization parameter that controls the pause between attempts to persist a transformation in the persisting stored procedure. format: hh:mm:ss. function use this setting to keep historization and persisting processing consistent across the project. analyticscreator uses this value when no custom value is saved for the project. access the parameter is maintained from the parameters list in analyticscreator. how to access navigation tree parameters->list parameters toolbar options->parameter diagram not opened from the diagram. visual element parameter list default value 00:00:10 custom value not set. where it is used this parameter belongs to the historization group and is used when analyticscreator applies historization and persisting processing. setting value technical parameter name persist_pause_between_attempts default value 00:00:10 custom value not set. parameter groups group historization persisting history related topics historization persist num attempts persist use transactions parameters previous persist num attempts nextpersist use transactions"}
,{"id":389871310026,"name":"Persist Use Transactions","type":"topic","path":"/docs/reference/parameters/parameters-historization/parameters-historization-persist-use-transactions","breadcrumb":"Reference › Parameters › Historization › Persist Use Transactions","description":"","searchText":"reference parameters historization persist use transactions overview persist use transactions is a historization parameter that controls whether transactions are used in persisting procedures: 0 - no, 1 - yes (default). function use this setting to keep historization and persisting processing consistent across the project. numeric values in this parameter act as choices; use the description to interpret each option. access the parameter is maintained from the parameters list in analyticscreator. how to access navigation tree parameters->list parameters toolbar options->parameter diagram not opened from the diagram. visual element parameter list default value 1 custom value not set. where it is used this parameter belongs to the historization group and is used when analyticscreator applies historization and persisting processing. setting value technical parameter name persist_use_transactions default value 1 custom value not set. parameter groups group historization persisting history related topics historization persist pause between attempts parameters previous persist pause between attempts nexthist empty record field name"}
,{"id":389871310027,"name":"Hist Empty Record Field Name","type":"topic","path":"/docs/reference/parameters/parameters-historization/parameters-historization-hist-empty-record-field-name","breadcrumb":"Reference › Parameters › Historization › Hist Empty Record Field Name","description":"","searchText":"reference parameters historization hist empty record field name overview hist empty record field name is a historization parameter that controls the name of the column used to identify empty records in the historized tables. function use this setting to keep historization and persisting processing consistent across the project. analyticscreator uses this value when no custom value is saved for the project. access the parameter is maintained from the parameters list in analyticscreator. how to access navigation tree parameters->list parameters toolbar options->parameter diagram not opened from the diagram. visual element parameter list default value is_empty_record custom value not set. where it is used this parameter belongs to the historization group and is used when analyticscreator applies historization and persisting processing. setting value technical parameter name hist_empty_record_fieldname default value is_empty_record custom value not set. parameter groups group historization persisting history related topics historization hist do not close hist proc use hash join parameters previous persist use transactions nextdiagrams"}
,{"id":389870784716,"name":"Diagrams","type":"subsection","path":"/docs/reference/parameters/parameters-diagrams","breadcrumb":"Reference › Parameters › Diagrams","description":"","searchText":"reference parameters diagrams controls diagram export behavior and thumbnail diagram display settings. use this page to find the diagrams settings, review their defaults, and open the detailed parameter pages. available parameters parameter technical name default value purpose diagram to picture scale diagram_to_picture_scale 1.0 scale of the diagram when saving it as a picture. floating number between 0.0 and 2.0 using dot as decimal separator. the higher the value, the better the picture quality and the greater the file size. when 0, the current diagram scale will be used. default: 1.0. thumbnail diagram dock thumbnail_diagram_dock 4 0 - no dock, 1 - left top corner, 2 - right top corner, 3 - left down corner, 4 - right down corner. thumbnail diagram height thumbnail_diagram_height 300 height (points). thumbnail diagram left thumbnail_diagram_left 0 left (points). thumbnail diagram margin thumbnail_diagram_margin 30 margin (points). thumbnail diagram show thumbnail_diagram_show 1 0 - do not show, 1 - show. thumbnail diagram top thumbnail_diagram_top 0 top (points). thumbnail diagram width thumbnail_diagram_width 300 width (points). previous hist empty record field name nextthumbnail diagram show"}
,{"id":389871310028,"name":"Thumbnail Diagram Show","type":"topic","path":"/docs/reference/parameters/parameters-diagrams/parameters-diagrams-thumbnail-diagram-show","breadcrumb":"Reference › Parameters › Diagrams › Thumbnail Diagram Show","description":"","searchText":"reference parameters diagrams thumbnail diagram show overview thumbnail diagram show is a diagrams parameter that controls whether the thumbnail diagram is shown. function use this setting to keep diagram rendering and export consistent across the project. analyticscreator uses this value when no custom value is saved for the project. access the parameter is maintained from the parameters list in analyticscreator. how to access navigation tree parameters->list parameters toolbar options->parameter diagram not opened from the diagram. visual element parameter list default value 1 custom value not set. where it is used this parameter belongs to the diagrams group and is used when analyticscreator applies diagram rendering and export. setting value technical parameter name thumbnail_diagram_show default value 1 custom value not set. parameter groups group diagrams diagram view diagram related topics diagrams thumbnail diagram margin thumbnail diagram top parameters previous diagrams nextthumbnail diagram width"}
,{"id":389871310029,"name":"Thumbnail Diagram Width","type":"topic","path":"/docs/reference/parameters/parameters-diagrams/parameters-diagrams-thumbnail-diagram-width","breadcrumb":"Reference › Parameters › Diagrams › Thumbnail Diagram Width","description":"","searchText":"reference parameters diagrams thumbnail diagram width overview thumbnail diagram width is a diagrams parameter that controls the thumbnail diagram width in points. function use this setting to keep diagram rendering and export consistent across the project. analyticscreator uses this value when no custom value is saved for the project. access the parameter is maintained from the parameters list in analyticscreator. how to access navigation tree parameters->list parameters toolbar options->parameter diagram not opened from the diagram. visual element parameter list default value 300 custom value not set. where it is used this parameter belongs to the diagrams group and is used when analyticscreator applies diagram rendering and export. setting value technical parameter name thumbnail_diagram_width default value 300 custom value not set. parameter groups group diagrams diagram view diagram related topics diagrams thumbnail diagram top parameters previous thumbnail diagram show nextthumbnail diagram height"}
,{"id":389871310030,"name":"Thumbnail Diagram Height","type":"topic","path":"/docs/reference/parameters/parameters-diagrams/parameters-diagrams-thumbnail-diagram-height","breadcrumb":"Reference › Parameters › Diagrams › Thumbnail Diagram Height","description":"","searchText":"reference parameters diagrams thumbnail diagram height overview thumbnail diagram height is a diagrams parameter that controls the thumbnail diagram height in points. function use this setting to keep diagram rendering and export consistent across the project. analyticscreator uses this value when no custom value is saved for the project. access the parameter is maintained from the parameters list in analyticscreator. how to access navigation tree parameters->list parameters toolbar options->parameter diagram not opened from the diagram. visual element parameter list default value 300 custom value not set. where it is used this parameter belongs to the diagrams group and is used when analyticscreator applies diagram rendering and export. setting value technical parameter name thumbnail_diagram_height default value 300 custom value not set. parameter groups group diagrams diagram view diagram related topics diagrams thumbnail diagram dock thumbnail diagram left parameters previous thumbnail diagram width nextthumbnail diagram left"}
,{"id":389871310031,"name":"Thumbnail Diagram Left","type":"topic","path":"/docs/reference/parameters/parameters-diagrams/parameters-diagrams-thumbnail-diagram-left","breadcrumb":"Reference › Parameters › Diagrams › Thumbnail Diagram Left","description":"","searchText":"reference parameters diagrams thumbnail diagram left overview thumbnail diagram left is a diagrams parameter that controls the left position of the thumbnail diagram in points. function use this setting to keep diagram rendering and export consistent across the project. analyticscreator uses this value when no custom value is saved for the project. access the parameter is maintained from the parameters list in analyticscreator. how to access navigation tree parameters->list parameters toolbar options->parameter diagram not opened from the diagram. visual element parameter list default value 0 custom value not set. where it is used this parameter belongs to the diagrams group and is used when analyticscreator applies diagram rendering and export. setting value technical parameter name thumbnail_diagram_left default value 0 custom value not set. parameter groups group diagrams diagram view diagram related topics diagrams thumbnail diagram height thumbnail diagram margin parameters previous thumbnail diagram height nextthumbnail diagram top"}
,{"id":389871310032,"name":"Thumbnail Diagram Top","type":"topic","path":"/docs/reference/parameters/parameters-diagrams/parameters-diagrams-thumbnail-diagram-top","breadcrumb":"Reference › Parameters › Diagrams › Thumbnail Diagram Top","description":"","searchText":"reference parameters diagrams thumbnail diagram top overview thumbnail diagram top is a diagrams parameter that controls the top position of the thumbnail diagram in points. function use this setting to keep diagram rendering and export consistent across the project. analyticscreator uses this value when no custom value is saved for the project. access the parameter is maintained from the parameters list in analyticscreator. how to access navigation tree parameters->list parameters toolbar options->parameter diagram not opened from the diagram. visual element parameter list default value 0 custom value not set. where it is used this parameter belongs to the diagrams group and is used when analyticscreator applies diagram rendering and export. setting value technical parameter name thumbnail_diagram_top default value 0 custom value not set. parameter groups group diagrams diagram view diagram related topics diagrams thumbnail diagram show thumbnail diagram width parameters previous thumbnail diagram left nextthumbnail diagram dock"}
,{"id":389871310033,"name":"Thumbnail Diagram Dock","type":"topic","path":"/docs/reference/parameters/parameters-diagrams/parameters-diagrams-thumbnail-diagram-dock","breadcrumb":"Reference › Parameters › Diagrams › Thumbnail Diagram Dock","description":"","searchText":"reference parameters diagrams thumbnail diagram dock overview thumbnail diagram dock is a diagrams parameter that sets the option used for thumbnail diagram dock. function use this setting to keep diagram rendering and export consistent across the project. analyticscreator uses this value when no custom value is saved for the project. access the parameter is maintained from the parameters list in analyticscreator. how to access navigation tree parameters->list parameters toolbar options->parameter diagram not opened from the diagram. visual element parameter list default value 4 custom value not set. where it is used this parameter belongs to the diagrams group and is used when analyticscreator applies diagram rendering and export. setting value technical parameter name thumbnail_diagram_dock default value 4 custom value not set. parameter groups group diagrams diagram view diagram related topics diagrams diagram to picture scale thumbnail diagram height parameters previous thumbnail diagram top nextthumbnail diagram margin"}
,{"id":389871310034,"name":"Thumbnail Diagram Margin","type":"topic","path":"/docs/reference/parameters/parameters-diagrams/parameters-diagrams-thumbnail-diagram-margin","breadcrumb":"Reference › Parameters › Diagrams › Thumbnail Diagram Margin","description":"","searchText":"reference parameters diagrams thumbnail diagram margin overview thumbnail diagram margin is a diagrams parameter that controls the thumbnail diagram margin in points. function use this setting to keep diagram rendering and export consistent across the project. analyticscreator uses this value when no custom value is saved for the project. access the parameter is maintained from the parameters list in analyticscreator. how to access navigation tree parameters->list parameters toolbar options->parameter diagram not opened from the diagram. visual element parameter list default value 30 custom value not set. where it is used this parameter belongs to the diagrams group and is used when analyticscreator applies diagram rendering and export. setting value technical parameter name thumbnail_diagram_margin default value 30 custom value not set. parameter groups group diagrams diagram view diagram related topics diagrams thumbnail diagram left thumbnail diagram show parameters previous thumbnail diagram dock nextdiagram to picture scale"}
,{"id":389871310035,"name":"Diagram To Picture Scale","type":"topic","path":"/docs/reference/parameters/parameters-diagrams/parameters-diagrams-diagram-to-picture-scale","breadcrumb":"Reference › Parameters › Diagrams › Diagram To Picture Scale","description":"","searchText":"reference parameters diagrams diagram to picture scale overview diagram to picture scale is a diagrams parameter that controls the scale of the diagram when saving it as a picture. floating number between 0.0 and 2.0 using dot as decimal separator. the higher the value, the better the picture quality and the greater the file size. when 0, the current diagram scale will be used. default: 1.0. function use this setting to keep diagram rendering and export consistent across the project. analyticscreator uses this value when no custom value is saved for the project. access the parameter is maintained from the parameters list in analyticscreator. how to access navigation tree parameters->list parameters toolbar options->parameter diagram not opened from the diagram. visual element parameter list default value 1.0 custom value not set. where it is used this parameter belongs to the diagrams group and is used when analyticscreator applies diagram rendering and export. setting value technical parameter name diagram_to_picture_scale default value 1.0 custom value not set. parameter groups group diagrams diagram view diagram related topics diagrams thumbnail diagram dock parameters previous thumbnail diagram margin nextgovernance"}
,{"id":389870784717,"name":"Governance","type":"subsection","path":"/docs/reference/parameters/parameters-governance","breadcrumb":"Reference › Parameters › Governance","description":"","searchText":"reference parameters governance controls inheritance and anonymization behavior for governed metadata. use this page to find the governance settings, review their defaults, and open the detailed parameter pages. available parameters parameter technical name default value purpose columns anonymization types columns_anonymization_types 0,no,1,yes comma-separated list of anonymization types and names. force anonymization inheritance force_anonymization_inheritance 0 force inheritance of anonymization properties: 0 - no, 1 - yes. force display folder inheritance force_displayfolder_inheritance 0 force inheritance of column display folders: 0 - no, 1 - yes. force friendlynames inheritance force_friendlynames_inheritance 0 force inheritance of table and column friendly names: 0 - no, 1 - yes. previous diagram to picture scale nextforce anonymization inheritance"}
,{"id":389871310036,"name":"Force Anonymization Inheritance","type":"topic","path":"/docs/reference/parameters/parameters-governance/parameters-governance-force-anonymization-inheritance","breadcrumb":"Reference › Parameters › Governance › Force Anonymization Inheritance","description":"","searchText":"reference parameters governance force anonymization inheritance overview force anonymization inheritance is a governance parameter that controls whether inheritance of anonymization properties is forced: 0 - no, 1 - yes. function use this setting to keep metadata inheritance and anonymization rules consistent across the project. numeric values in this parameter act as choices; use the description to interpret each option. access the parameter is maintained from the parameters list in analyticscreator. how to access navigation tree parameters->list parameters toolbar options->parameter diagram not opened from the diagram. visual element parameter list default value 0 custom value not set. where it is used this parameter belongs to the governance group and is used when analyticscreator applies metadata inheritance and anonymization rules. setting value technical parameter name force_anonymization_inheritance default value 0 custom value not set. parameter groups group governance object rules inheritance related topics governance columns anonymization types force display folder inheritance parameters previous governance nextforce friendlynames inheritance"}
,{"id":389871310037,"name":"Force Friendlynames Inheritance","type":"topic","path":"/docs/reference/parameters/parameters-governance/parameters-governance-force-friendlynames-inheritance","breadcrumb":"Reference › Parameters › Governance › Force Friendlynames Inheritance","description":"","searchText":"reference parameters governance force friendlynames inheritance overview force friendlynames inheritance is a governance parameter that controls whether inheritance of table and column friendly names is forced: 0 - no, 1 - yes function use this setting to keep metadata inheritance and anonymization rules consistent across the project. numeric values in this parameter act as choices; use the description to interpret each option. access the parameter is maintained from the parameters list in analyticscreator. how to access navigation tree parameters->list parameters toolbar options->parameter diagram not opened from the diagram. visual element parameter list default value 0 custom value not set. where it is used this parameter belongs to the governance group and is used when analyticscreator applies metadata inheritance and anonymization rules. setting value technical parameter name force_friendlynames_inheritance default value 0 custom value not set. parameter groups group governance object rules inheritance related topics governance force display folder inheritance parameters previous force anonymization inheritance nextforce display folder inheritance"}
,{"id":389871310038,"name":"Force Display Folder Inheritance","type":"topic","path":"/docs/reference/parameters/parameters-governance/parameters-governance-force-display-folder-inheritance","breadcrumb":"Reference › Parameters › Governance › Force Display Folder Inheritance","description":"","searchText":"reference parameters governance force display folder inheritance overview force display folder inheritance is a governance parameter that controls whether inheritance of column display folders is forced: 0 - no, 1 - yes. function use this setting to keep metadata inheritance and anonymization rules consistent across the project. numeric values in this parameter act as choices; use the description to interpret each option. access the parameter is maintained from the parameters list in analyticscreator. how to access navigation tree parameters->list parameters toolbar options->parameter diagram not opened from the diagram. visual element parameter list default value 0 custom value not set. where it is used this parameter belongs to the governance group and is used when analyticscreator applies metadata inheritance and anonymization rules. setting value technical parameter name force_displayfolder_inheritance default value 0 custom value not set. parameter groups group governance object rules inheritance related topics governance force anonymization inheritance force friendlynames inheritance parameters previous force friendlynames inheritance nextcolumns anonymization types"}
,{"id":389871310039,"name":"Columns Anonymization Types","type":"topic","path":"/docs/reference/parameters/parameters-governance/parameters-governance-columns-anonymization-types","breadcrumb":"Reference › Parameters › Governance › Columns Anonymization Types","description":"","searchText":"reference parameters governance columns anonymization types overview columns anonymization types is a governance parameter that defines the comma-separated list of anonymization types and names. function use this setting to keep metadata inheritance and anonymization rules consistent across the project. analyticscreator uses this value when no custom value is saved for the project. access the parameter is maintained from the parameters list in analyticscreator. how to access navigation tree parameters->list parameters toolbar options->parameter diagram not opened from the diagram. visual element parameter list default value 0,no,1,yes custom value not set. where it is used this parameter belongs to the governance group and is used when analyticscreator applies metadata inheritance and anonymization rules. setting value technical parameter name columns_anonymization_types default value 0,no,1,yes custom value not set. parameter groups group governance object rules inheritance related topics governance force anonymization inheritance parameters previous force display folder inheritance nextnaming & metadata"}
,{"id":389870784718,"name":"Naming & Metadata","type":"subsection","path":"/docs/reference/parameters/parameters-naming-and-metadata","breadcrumb":"Reference › Parameters › Naming & Metadata","description":"","searchText":"reference parameters naming & metadata defines naming, friendly-name, description, and display-folder patterns. use this page to find the naming & metadata settings, review their defaults, and open the detailed parameter pages. available parameters parameter technical name default value purpose description inherit table columns description_inherit_tablecolumns 0 description inheritance from the table columns to the dependent table columns: 0 - inherit if empty, 1 - always, 2 - never. description inherit tables description_inherit_tables 0 description inheritance from the tables to the dependent tables: 0 - inherit if empty, 1 - always, 2 - never. description inherit trans description_inherit_trans 0 description inheritance from the first transformation table to the transformation: 0 - inherit if empty, 1 - always, 2 - never. description inherit trans columns description_inherit_transcolumns 0 description inheritance from the table columns of the data source to the transformation columns: 0 - inherit if empty, 1 - always, 2 - never. description inherit trans table columns description_inherit_transtable_columns 1 description inheritance from the transformation columns to the transtable columns and persisted table columns: 0 - inherit if empty, 1 - always, 2 - never. description inherit trans tables description_inherit_transtables 1 description inheritance from the transformations to the transtables and persisted tables: 0 - inherit if empty, 1 - always, 2 - never. description pattern calendar id description_pattern_calendar_id calendar id autogenerated description of hist_id (satz_id) field in calendar dimension. you can use {schemaname}, {tablename}, {friendlyname}, {schemaid} and {tableid} placeholders. description pattern date from description_pattern_datefrom {tablename}: start of validity period autogenerated description of datefrom (dat_von_hist) field. you can use {schemaname}, {tablename}, {friendlyname}, {schemaid} and {tableid} placeholders. description pattern date to description_pattern_dateto {tablename}: end of validity period autogenerated description of dateto (dat_bis_hist) field. you can use {schemaname}, {tablename}, {friendlyname}, {schemaid} and {tableid} placeholders. description pattern hist id description_pattern_hist_id {tablename}: surrogate key autogenerated description of hist_id (satz_id) field. you can use {schemaname}, {tablename}, {friendlyname}, {schemaid} and {tableid} placeholders. description pattern snapshot id description_pattern_snapshot_id snapshot id autogenerated description of hist_id (satz_id) field in snapshot dimension. you can use {schemaname}, {tablename}, {friendlyname}, {schemaid} and {tableid} placeholders. description pattern statement description_pattern_statement {statement} autogenerated description in case of using statement as description of transformation fields. you can use {statement}, {friendlyname}, {columnname}, {columnid} and {cr} placeholders. description set special description_set_special 0 automatically set description of special columns (snapshotid, surrogate key, calendarid): 0 - yes if empty, 1 - always, 2 - never. description use statements description_use_statements 0 use statement as description: 0 - yes if empty (priority over inherited description), 1 - always, 2 - yes if empty (inherited description has priority), 3 - never. diagram name pattern diagram_name_pattern {fullfriendlynamecr} object name in diagram. you can use {name}, {friendlyname}, {fullfriendlyname}, {fullfriendlynamecr}, {id} and {cr} placeholders. display folder inherit table columns displayfolder_inherit_tablecolumns 0 olap display folder inheritance from the table columns to the dependent table columns: 0 - inherit if empty, 1 - always, 2 - never. display folder inherit trans columns displayfolder_inherit_transcolumns 0 olap display folder inheritance from the table columns to the transformation columns: 0 - inherit if empty, 1 - always, 2 - never. display folder inherit trans table columns displayfolder_inherit_transtable_columns 1 olap display folder inheritance from the transformation columns to the transtable columns and persisted table columns: 0 - inherit if empty, 1 - always, 2 - never. friendly name inherit table columns friendlyname_inherit_tablecolumns 0 friendly name inheritance from the table columns to the dependent table columns: 0 - inherit if empty, 1 - always, 2 - never. friendly name inherit tables friendlyname_inherit_tables 0 friendly name inheritance from the tables to the dependent tables: 0 - inherit if empty, 1 - always, 2 - never. friendly name inherit trans friendlyname_inherit_trans 0 friendly name inheritance from the first transformation table to the transformation: 0 - inherit if empty, 1 - always, 2 - never. friendly name inherit trans columns friendlyname_inherit_transcolumns 0 friendly name inheritance from the table columns to the transformation columns: 0 - inherit if empty, 1 - always, 2 - never. friendly name inherit trans table columns friendlyname_inherit_transtable_columns 1 friendly name inheritance from the transformation columns to the transtable columns and persisted table columns: 0 - inherit if empty, 1 - always, 2 - never. friendly name inherit trans tables friendlyname_inherit_transtables 1 friendly name inheritance from the transformations to the transtables and persisted tables: 0 - inherit if empty, 1 - always, 2 - never. friendly name pattern calendar id friendlyname_pattern_calendar_id calendar autogenerated friendly name of hist_id (satz_id) field in calendar dimension. you can use {schemaname}, {tablename}, {friendlyname}, {schemaid} and {tableid} placeholders. friendly name pattern date from friendlyname_pattern_datefrom {friendlyname}_validfrom autogenerated friendly name of datefrom (dat_von_hist) field. you can use {schemaname}, {tablename}, {friendlyname}, {schemaid} and {tableid} placeholders. friendly name pattern date to friendlyname_pattern_dateto {friendlyname}_validto autogenerated friendly name of dateto (dat_bis_hist) field. you can use {schemaname}, {tablename}, {friendlyname}, {schemaid} and {tableid} placeholders. friendly name pattern duplicated columns friendlyname_pattern_duplicated_columns {friendlyname}{nr} autogenerated replacement of duplicated friendly names. you can use {friendlyname}, {columnname}, {columnid} and {nr} (autoincrement number) placeholders. friendly name pattern duplicated tables friendlyname_pattern_duplicated_tables {friendlyname}{nr} autogenerated replacement of duplicated friendly names. you can use {schemaname}, {tablename}, {friendlyname}, {schemaid}, {tableid} and {nr} (autoincrement number) placeholders. friendly name pattern hist id friendlyname_pattern_hist_id {friendlyname} autogenerated friendly name of hist_id (satz_id) field. you can use {schemaname}, {tablename}, {friendlyname}, {schemaid} and {tableid} placeholders. friendly name pattern snapshot id friendlyname_pattern_snapshot_id snapshot autogenerated friendly name of hist_id (satz_id) field in snapshot dimension . you can use {schemaname}, {tablename}, {friendlyname}, {schemaid} and {tableid} placeholders. friendly name set special friendlyname_set_special 0 automatically set friendly name of special columns (snapshotid, surrogate key, calendarid): 0 - yes if empty, 1 - always, 2 - never. source reference description pattern source_reference_description_pattern fk_{sourcename1}_{sourcename2} autogenerated source reference description. you can use {sourceschema1}, {sourcename1}, {sourceid1}, {friendlyname1}, {sourceschema2}, {sourcename2}, {sourceid2} and {friendlyname2} placeholders. source reference onecol description pattern source_reference_onecol_description_pattern rc_{sourcename1}_{sourcename2}_{columnname} autogenerated one-column source reference description. you can use {sourceschema1}, {sourcename1}, {sourceid1}, {friendlyname1}, {sourceschema2}, {sourcename2}, {sourceid2}, {friendlyname2}, {columnname}, {columnid} and {columnfriendlyname} placeholders. table reference description pattern table_reference_description_pattern fk_{tablename1}_{tablename2} autogenerated table reference description. you can use {tableschema1}, {tablename1}, {tableid1}, {friendlyname1}, {tableschema2}, {tablename2}, {tableid2} and {friendlyname2} placeholders. table reference onecol description pattern table_reference_onecol_description_pattern rc_{tablename1}_{tablename2}_{columnname} autogenerated one-column table reference description. you can use {tableschema1}, {tablename1}, {tableid1}, {friendlyname1}, {tableschema2}, {tablename2}, {tableid2}, {friendlyname2}, {columnname}, {columnid} and {columnfriendlyname} placeholders. previous columns anonymization types nextdiagram name pattern"}
,{"id":388515715282,"name":"Diagram Name Pattern","type":"topic","path":"/docs/reference/parameters/parameters-naming-and-metadata/parameters-naming-and-metadata-diagram-name-pattern","breadcrumb":"Reference › Parameters › Naming & Metadata › Diagram Name Pattern","description":"","searchText":"reference parameters naming & metadata diagram name pattern overview diagram name pattern is a naming & metadata parameter that controls the object name in the diagram. you can use {name}, {friendlyname}, {fullfriendlyname}, {fullfriendlynamecr}, {id} and {cr} placeholders. function use this setting to keep generated names, descriptions, and display folders consistent across the project. analyticscreator uses this value when no custom value is saved for the project. keep placeholder names unchanged when adapting the pattern. this value supports placeholders such as {fullfriendlynamecr}, {name}, {friendly name}, {fullfriendlyname}, {id}, {cr}. access the parameter is maintained from the parameters list in analyticscreator. how to access navigation tree parameters->list parameters toolbar options->parameter diagram not opened from the diagram. visual element parameter list default value {fullfriendlynamecr} custom value not set. where it is used this parameter belongs to the naming & metadata group and is used when analyticscreator applies generated names, descriptions, and display folders. setting value technical parameter name diagram_name_pattern default value {fullfriendlynamecr} custom value not set. parameter groups group naming & metadata names & metadata naming related topics naming & metadata description use statements display folder inherit table columns parameters previous naming & metadata nextdescription pattern hist id"}
,{"id":389871310040,"name":"Description Pattern Hist ID","type":"topic","path":"/docs/reference/parameters/parameters-naming-and-metadata/parameters-naming-and-metadata-description-pattern-hist-id","breadcrumb":"Reference › Parameters › Naming & Metadata › Description Pattern Hist ID","description":"","searchText":"reference parameters naming & metadata description pattern hist id overview description pattern hist id is a naming & metadata parameter that defines the autogenerated description of the hist_id (satz_id) field. you can use {schemaname}, {tablename}, {friendlyname}, {schemaid} and {tableid} placeholders. function use this setting to keep generated names, descriptions, and display folders consistent across the project. analyticscreator uses this value when no custom value is saved for the project. keep placeholder names unchanged when adapting the pattern. this value supports placeholders such as {tablename}, {schemaname}, {friendlyname}, {schemaid}, {tableid}. access the parameter is maintained from the parameters list in analyticscreator. how to access navigation tree parameters->list parameters toolbar options->parameter diagram not opened from the diagram. visual element parameter list default value {tablename}: surrogate key custom value not set. where it is used this parameter belongs to the naming & metadata group and is used when analyticscreator applies generated names, descriptions, and display folders. setting value technical parameter name description_pattern_hist_id default value {tablename}: surrogate key custom value not set. parameter groups group naming & metadata names & metadata naming related topics naming & metadata description pattern date to description pattern snapshot id parameters previous diagram name pattern nextdescription pattern date from"}
,{"id":389871310041,"name":"Description Pattern Date From","type":"topic","path":"/docs/reference/parameters/parameters-naming-and-metadata/parameters-naming-and-metadata-description-pattern-date-from","breadcrumb":"Reference › Parameters › Naming & Metadata › Description Pattern Date From","description":"","searchText":"reference parameters naming & metadata description pattern date from overview description pattern date from is a naming & metadata parameter that defines the autogenerated description of the datefrom (dat_von_hist) field. you can use {schemaname}, {tablename}, {friendlyname}, {schemaid} and {tableid} placeholders. function use this setting to keep generated names, descriptions, and display folders consistent across the project. analyticscreator uses this value when no custom value is saved for the project. keep placeholder names unchanged when adapting the pattern. this value supports placeholders such as {tablename}, {schemaname}, {friendlyname}, {schemaid}, {tableid}. access the parameter is maintained from the parameters list in analyticscreator. how to access navigation tree parameters->list parameters toolbar options->parameter diagram not opened from the diagram. visual element parameter list default value {tablename}: start of validity period custom value not set. where it is used this parameter belongs to the naming & metadata group and is used when analyticscreator applies generated names, descriptions, and display folders. setting value technical parameter name description_pattern_datefrom default value {tablename}: start of validity period custom value not set. parameter groups group naming & metadata names & metadata naming related topics naming & metadata description pattern calendar id description pattern date to parameters previous description pattern hist id nextdescription pattern date to"}
,{"id":389871310042,"name":"Description Pattern Date To","type":"topic","path":"/docs/reference/parameters/parameters-naming-and-metadata/parameters-naming-and-metadata-description-pattern-date-to","breadcrumb":"Reference › Parameters › Naming & Metadata › Description Pattern Date To","description":"","searchText":"reference parameters naming & metadata description pattern date to overview description pattern date to is a naming & metadata parameter that defines the autogenerated description of the dateto (dat_bis_hist) field. you can use {schemaname}, {tablename}, {friendlyname}, {schemaid} and {tableid} placeholders. function use this setting to keep generated names, descriptions, and display folders consistent across the project. analyticscreator uses this value when no custom value is saved for the project. keep placeholder names unchanged when adapting the pattern. this value supports placeholders such as {tablename}, {schemaname}, {friendlyname}, {schemaid}, {tableid}. access the parameter is maintained from the parameters list in analyticscreator. how to access navigation tree parameters->list parameters toolbar options->parameter diagram not opened from the diagram. visual element parameter list default value {tablename}: end of validity period custom value not set. where it is used this parameter belongs to the naming & metadata group and is used when analyticscreator applies generated names, descriptions, and display folders. setting value technical parameter name description_pattern_dateto default value {tablename}: end of validity period custom value not set. parameter groups group naming & metadata names & metadata naming related topics naming & metadata description pattern date from description pattern hist id parameters previous description pattern date from nextdescription pattern snapshot id"}
,{"id":389871310043,"name":"Description Pattern Snapshot ID","type":"topic","path":"/docs/reference/parameters/parameters-naming-and-metadata/parameters-naming-and-metadata-description-pattern-snapshot-id","breadcrumb":"Reference › Parameters › Naming & Metadata › Description Pattern Snapshot ID","description":"","searchText":"reference parameters naming & metadata description pattern snapshot id overview description pattern snapshot id is a naming & metadata parameter that defines the autogenerated description of the hist_id (satz_id) field in the snapshot dimension. you can use {schemaname}, {tablename}, {friendlyname}, {schemaid} and {tableid} placeholders. function use this setting to keep generated names, descriptions, and display folders consistent across the project. analyticscreator uses this value when no custom value is saved for the project. keep placeholder names unchanged when adapting the pattern. this value supports placeholders such as {schemaname}, {tablename}, {friendlyname}, {schemaid}, {tableid}. access the parameter is maintained from the parameters list in analyticscreator. how to access navigation tree parameters->list parameters toolbar options->parameter diagram not opened from the diagram. visual element parameter list default value snapshot id custom value not set. where it is used this parameter belongs to the naming & metadata group and is used when analyticscreator applies generated names, descriptions, and display folders. setting value technical parameter name description_pattern_snapshot_id default value snapshot id custom value not set. parameter groups group naming & metadata names & metadata naming related topics naming & metadata description pattern hist id description pattern statement parameters previous description pattern date to nextdescription pattern calendar id"}
,{"id":389871310044,"name":"Description Pattern Calendar ID","type":"topic","path":"/docs/reference/parameters/parameters-naming-and-metadata/parameters-naming-and-metadata-description-pattern-calendar-id","breadcrumb":"Reference › Parameters › Naming & Metadata › Description Pattern Calendar ID","description":"","searchText":"reference parameters naming & metadata description pattern calendar id overview description pattern calendar id is a naming & metadata parameter that defines the autogenerated description of the hist_id (satz_id) field in the calendar dimension. you can use {schemaname}, {tablename}, {friendlyname}, {schemaid} and {tableid} placeholders. function use this setting to keep generated names, descriptions, and display folders consistent across the project. analyticscreator uses this value when no custom value is saved for the project. keep placeholder names unchanged when adapting the pattern. this value supports placeholders such as {schemaname}, {tablename}, {friendlyname}, {schemaid}, {tableid}. access the parameter is maintained from the parameters list in analyticscreator. how to access navigation tree parameters->list parameters toolbar options->parameter diagram not opened from the diagram. visual element parameter list default value calendar id custom value not set. where it is used this parameter belongs to the naming & metadata group and is used when analyticscreator applies generated names, descriptions, and display folders. setting value technical parameter name description_pattern_calendar_id default value calendar id custom value not set. parameter groups group naming & metadata names & metadata naming related topics naming & metadata description inherit trans tables description pattern date from parameters previous description pattern snapshot id nextdescription pattern statement"}
,{"id":389871310045,"name":"Description Pattern Statement","type":"topic","path":"/docs/reference/parameters/parameters-naming-and-metadata/parameters-naming-and-metadata-description-pattern-statement","breadcrumb":"Reference › Parameters › Naming & Metadata › Description Pattern Statement","description":"","searchText":"reference parameters naming & metadata description pattern statement overview description pattern statement is a naming & metadata parameter that defines the autogenerated description when a statement is used as the description of transformation fields. you can use {statement}, {friendlyname}, {columnname}, {columnid} and {cr} placeholders. function use this setting to keep generated names, descriptions, and display folders consistent across the project. analyticscreator uses this value when no custom value is saved for the project. keep placeholder names unchanged when adapting the pattern. this value supports placeholders such as {statement}, {friendlyname}, {columnname}, {columnid}, {cr}. access the parameter is maintained from the parameters list in analyticscreator. how to access navigation tree parameters->list parameters toolbar options->parameter diagram not opened from the diagram. visual element parameter list default value {statement} custom value not set. where it is used this parameter belongs to the naming & metadata group and is used when analyticscreator applies generated names, descriptions, and display folders. setting value technical parameter name description_pattern_statement default value {statement} custom value not set. parameter groups group naming & metadata names & metadata naming related topics naming & metadata description pattern snapshot id description set special parameters previous description pattern calendar id nextfriendly name pattern hist id"}
,{"id":389871310046,"name":"Friendly Name Pattern Hist ID","type":"topic","path":"/docs/reference/parameters/parameters-naming-and-metadata/parameters-naming-and-metadata-friendly-name-pattern-hist-id","breadcrumb":"Reference › Parameters › Naming & Metadata › Friendly Name Pattern Hist ID","description":"","searchText":"reference parameters naming & metadata friendly name pattern hist id overview friendly name pattern hist id is a naming & metadata parameter that defines the autogenerated friendly name of the hist_id (satz_id) field. you can use {schemaname}, {tablename}, {friendlyname}, {schemaid} and {tableid} placeholders. function use this setting to keep generated names, descriptions, and display folders consistent across the project. analyticscreator uses this value when no custom value is saved for the project. keep placeholder names unchanged when adapting the pattern. this value supports placeholders such as {friendlyname}, {schemaname}, {tablename}, {schemaid}, {tableid}. access the parameter is maintained from the parameters list in analyticscreator. how to access navigation tree parameters->list parameters toolbar options->parameter diagram not opened from the diagram. visual element parameter list default value {friendlyname} custom value not set. where it is used this parameter belongs to the naming & metadata group and is used when analyticscreator applies generated names, descriptions, and display folders. setting value technical parameter name friendlyname_pattern_hist_id default value {friendlyname} custom value not set. parameter groups group naming & metadata names & metadata naming related topics naming & metadata friendly name pattern duplicated tables friendly name pattern snapshot id parameters previous description pattern statement nextfriendly name pattern date from"}
,{"id":389871310047,"name":"Friendly Name Pattern Date From","type":"topic","path":"/docs/reference/parameters/parameters-naming-and-metadata/parameters-naming-and-metadata-friendly-name-pattern-date-from","breadcrumb":"Reference › Parameters › Naming & Metadata › Friendly Name Pattern Date From","description":"","searchText":"reference parameters naming & metadata friendly name pattern date from overview friendly name pattern date from is a naming & metadata parameter that defines the autogenerated friendly name of the datefrom (dat_von_hist) field. you can use {schemaname}, {tablename}, {friendlyname}, {schemaid} and {tableid} placeholders. function use this setting to keep generated names, descriptions, and display folders consistent across the project. analyticscreator uses this value when no custom value is saved for the project. keep placeholder names unchanged when adapting the pattern. this value supports placeholders such as {friendlyname}, {schemaname}, {tablename}, {schemaid}, {tableid}. access the parameter is maintained from the parameters list in analyticscreator. how to access navigation tree parameters->list parameters toolbar options->parameter diagram not opened from the diagram. visual element parameter list default value {friendlyname}_validfrom custom value not set. where it is used this parameter belongs to the naming & metadata group and is used when analyticscreator applies generated names, descriptions, and display folders. setting value technical parameter name friendlyname_pattern_datefrom default value {friendlyname}_validfrom custom value not set. parameter groups group naming & metadata names & metadata naming related topics naming & metadata friendly name pattern calendar id friendly name pattern date to parameters previous friendly name pattern hist id nextfriendly name pattern date to"}
,{"id":389871310048,"name":"Friendly Name Pattern Date To","type":"topic","path":"/docs/reference/parameters/parameters-naming-and-metadata/parameters-naming-and-metadata-friendly-name-pattern-date-to","breadcrumb":"Reference › Parameters › Naming & Metadata › Friendly Name Pattern Date To","description":"","searchText":"reference parameters naming & metadata friendly name pattern date to overview friendly name pattern date to is a naming & metadata parameter that defines the autogenerated friendly name of the dateto (dat_bis_hist) field. you can use {schemaname}, {tablename}, {friendlyname}, {schemaid} and {tableid} placeholders. function use this setting to keep generated names, descriptions, and display folders consistent across the project. analyticscreator uses this value when no custom value is saved for the project. keep placeholder names unchanged when adapting the pattern. this value supports placeholders such as {friendlyname}, {schemaname}, {tablename}, {schemaid}, {tableid}. access the parameter is maintained from the parameters list in analyticscreator. how to access navigation tree parameters->list parameters toolbar options->parameter diagram not opened from the diagram. visual element parameter list default value {friendlyname}_validto custom value not set. where it is used this parameter belongs to the naming & metadata group and is used when analyticscreator applies generated names, descriptions, and display folders. setting value technical parameter name friendlyname_pattern_dateto default value {friendlyname}_validto custom value not set. parameter groups group naming & metadata names & metadata naming related topics naming & metadata friendly name pattern date from friendly name pattern duplicated columns parameters previous friendly name pattern date from nextfriendly name pattern snapshot id"}
,{"id":389871310049,"name":"Friendly Name Pattern Snapshot ID","type":"topic","path":"/docs/reference/parameters/parameters-naming-and-metadata/parameters-naming-and-metadata-friendly-name-pattern-snapshot-id","breadcrumb":"Reference › Parameters › Naming & Metadata › Friendly Name Pattern Snapshot ID","description":"","searchText":"reference parameters naming & metadata friendly name pattern snapshot id overview friendly name pattern snapshot id is a naming & metadata parameter that defines the autogenerated friendly name of the hist_id (satz_id) field in the snapshot dimension. you can use {schemaname}, {tablename}, {friendlyname}, {schemaid} and {tableid} placeholders. function use this setting to keep generated names, descriptions, and display folders consistent across the project. analyticscreator uses this value when no custom value is saved for the project. keep placeholder names unchanged when adapting the pattern. this value supports placeholders such as {schemaname}, {tablename}, {friendlyname}, {schemaid}, {tableid}. access the parameter is maintained from the parameters list in analyticscreator. how to access navigation tree parameters->list parameters toolbar options->parameter diagram not opened from the diagram. visual element parameter list default value snapshot custom value not set. where it is used this parameter belongs to the naming & metadata group and is used when analyticscreator applies generated names, descriptions, and display folders. setting value technical parameter name friendlyname_pattern_snapshot_id default value snapshot custom value not set. parameter groups group naming & metadata names & metadata naming related topics naming & metadata friendly name pattern hist id friendly name set special parameters previous friendly name pattern date to nextfriendly name pattern calendar id"}
,{"id":389871310050,"name":"Friendly Name Pattern Calendar ID","type":"topic","path":"/docs/reference/parameters/parameters-naming-and-metadata/parameters-naming-and-metadata-friendly-name-pattern-calendar-id","breadcrumb":"Reference › Parameters › Naming & Metadata › Friendly Name Pattern Calendar ID","description":"","searchText":"reference parameters naming & metadata friendly name pattern calendar id overview friendly name pattern calendar id is a naming & metadata parameter that defines the autogenerated friendly name of the hist_id (satz_id) field in the calendar dimension. you can use {schemaname}, {tablename}, {friendlyname}, {schemaid} and {tableid} placeholders. function use this setting to keep generated names, descriptions, and display folders consistent across the project. analyticscreator uses this value when no custom value is saved for the project. keep placeholder names unchanged when adapting the pattern. this value supports placeholders such as {schemaname}, {tablename}, {friendlyname}, {schemaid}, {tableid}. access the parameter is maintained from the parameters list in analyticscreator. how to access navigation tree parameters->list parameters toolbar options->parameter diagram not opened from the diagram. visual element parameter list default value calendar custom value not set. where it is used this parameter belongs to the naming & metadata group and is used when analyticscreator applies generated names, descriptions, and display folders. setting value technical parameter name friendlyname_pattern_calendar_id default value calendar custom value not set. parameter groups group naming & metadata names & metadata naming related topics naming & metadata friendly name inherit trans tables friendly name pattern date from parameters previous friendly name pattern snapshot id nextfriendly name pattern duplicated columns"}
,{"id":389871310051,"name":"Friendly Name Pattern Duplicated Columns","type":"topic","path":"/docs/reference/parameters/parameters-naming-and-metadata/parameters-naming-and-metadata-friendly-name-pattern-duplicated-columns","breadcrumb":"Reference › Parameters › Naming & Metadata › Friendly Name Pattern Duplicated Columns","description":"","searchText":"reference parameters naming & metadata friendly name pattern duplicated columns overview friendly name pattern duplicated columns is a naming & metadata parameter that defines the autogenerated replacement of duplicated friendly names. you can use {friendlyname}, {columnname}, {columnid} and {nr} (autoincrement number) placeholders. function use this setting to keep generated names, descriptions, and display folders consistent across the project. analyticscreator uses this value when no custom value is saved for the project. keep placeholder names unchanged when adapting the pattern. this value supports placeholders such as {friendlyname}, {nr}, {columnname}, {columnid}. access the parameter is maintained from the parameters list in analyticscreator. how to access navigation tree parameters->list parameters toolbar options->parameter diagram not opened from the diagram. visual element parameter list default value {friendlyname}{nr} custom value not set. where it is used this parameter belongs to the naming & metadata group and is used when analyticscreator applies generated names, descriptions, and display folders. setting value technical parameter name friendlyname_pattern_duplicated_columns default value {friendlyname}{nr} custom value not set. parameter groups group naming & metadata names & metadata naming related topics naming & metadata friendly name pattern date to friendly name pattern duplicated tables parameters previous friendly name pattern calendar id nextfriendly name pattern duplicated tables"}
,{"id":389871310052,"name":"Friendly Name Pattern Duplicated Tables","type":"topic","path":"/docs/reference/parameters/parameters-naming-and-metadata/parameters-naming-and-metadata-friendly-name-pattern-duplicated-tables","breadcrumb":"Reference › Parameters › Naming & Metadata › Friendly Name Pattern Duplicated Tables","description":"","searchText":"reference parameters naming & metadata friendly name pattern duplicated tables overview friendly name pattern duplicated tables is a naming & metadata parameter that defines the autogenerated replacement of duplicated friendly names. you can use {schemaname}, {tablename}, {friendlyname}, {schemaid}, {tableid} and {nr} (autoincrement number) placeholders. function use this setting to keep generated names, descriptions, and display folders consistent across the project. analyticscreator uses this value when no custom value is saved for the project. keep placeholder names unchanged when adapting the pattern. this value supports placeholders such as {friendlyname}, {nr}, {schemaname}, {tablename}, {schemaid}, {tableid}. access the parameter is maintained from the parameters list in analyticscreator. how to access navigation tree parameters->list parameters toolbar options->parameter diagram not opened from the diagram. visual element parameter list default value {friendlyname}{nr} custom value not set. where it is used this parameter belongs to the naming & metadata group and is used when analyticscreator applies generated names, descriptions, and display folders. setting value technical parameter name friendlyname_pattern_duplicated_tables default value {friendlyname}{nr} custom value not set. parameter groups group naming & metadata names & metadata naming related topics naming & metadata friendly name pattern duplicated columns friendly name pattern hist id parameters previous friendly name pattern duplicated columns nextsource reference description pattern"}
,{"id":389870937274,"name":"Source Reference Description Pattern","type":"topic","path":"/docs/reference/parameters/parameters-naming-and-metadata/parameters-naming-and-metadata-source-reference-description-pattern","breadcrumb":"Reference › Parameters › Naming & Metadata › Source Reference Description Pattern","description":"","searchText":"reference parameters naming & metadata source reference description pattern overview source reference description pattern is a naming & metadata parameter that defines the autogenerated source reference description. you can use {sourceschema1}, {sourcename1}, {sourceid1}, {friendlyname1}, {sourceschema2}, {sourcename2}, {sourceid2} and {friendlyname2} placeholders. function use this setting to keep generated names, descriptions, and display folders consistent across the project. analyticscreator uses this value when no custom value is saved for the project. keep placeholder names unchanged when adapting the pattern. this value supports placeholders such as {sourcename1}, {sourcename2}, {sourceschema1}, {sourceid1}, {friendlyname1}, {sourceschema2}, {sourceid2}, {friendlyname2}. access the parameter is maintained from the parameters list in analyticscreator. how to access navigation tree parameters->list parameters toolbar options->parameter diagram not opened from the diagram. visual element parameter list default value fk_{sourcename1}_{sourcename2} custom value not set. where it is used this parameter belongs to the naming & metadata group and is used when analyticscreator applies generated names, descriptions, and display folders. setting value technical parameter name source_reference_description_pattern default value fk_{sourcename1}_{sourcename2} custom value not set. parameter groups group naming & metadata names & metadata naming related topics naming & metadata friendly name set special source reference onecol description pattern parameters previous friendly name pattern duplicated tables nexttable reference description pattern"}
,{"id":389870937275,"name":"Table Reference Description Pattern","type":"topic","path":"/docs/reference/parameters/parameters-naming-and-metadata/parameters-naming-and-metadata-table-reference-description-pattern","breadcrumb":"Reference › Parameters › Naming & Metadata › Table Reference Description Pattern","description":"","searchText":"reference parameters naming & metadata table reference description pattern overview table reference description pattern is a naming & metadata parameter that defines the autogenerated table reference description. you can use {tableschema1}, {tablename1}, {tableid1}, {friendlyname1}, {tableschema2}, {tablename2}, {tableid2} and {friendlyname2} placeholders. function use this setting to keep generated names, descriptions, and display folders consistent across the project. analyticscreator uses this value when no custom value is saved for the project. keep placeholder names unchanged when adapting the pattern. this value supports placeholders such as {tablename1}, {tablename2}, {tableschema1}, {tableid1}, {friendlyname1}, {tableschema2}, {tableid2}, {friendlyname2}. access the parameter is maintained from the parameters list in analyticscreator. how to access navigation tree parameters->list parameters toolbar options->parameter diagram not opened from the diagram. visual element parameter list default value fk_{tablename1}_{tablename2} custom value not set. where it is used this parameter belongs to the naming & metadata group and is used when analyticscreator applies generated names, descriptions, and display folders. setting value technical parameter name table_reference_description_pattern default value fk_{tablename1}_{tablename2} custom value not set. parameter groups group naming & metadata names & metadata naming related topics naming & metadata source reference onecol description pattern table reference onecol description pattern parameters previous source reference description pattern nextsource reference onecol description pattern"}
,{"id":389870937276,"name":"Source Reference Onecol Description Pattern","type":"topic","path":"/docs/reference/parameters/parameters-naming-and-metadata/parameters-naming-and-metadata-source-reference-onecol-description-pattern","breadcrumb":"Reference › Parameters › Naming & Metadata › Source Reference Onecol Description Pattern","description":"","searchText":"reference parameters naming & metadata source reference onecol description pattern overview source reference onecol description pattern is a naming & metadata parameter that defines the autogenerated one-column source reference description. you can use {sourceschema1}, {sourcename1}, {sourceid1}, {friendlyname1}, {sourceschema2}, {sourcename2}, {sourceid2}, {friendlyname2}, {columnname}, {columnid} and {columnfriendlyname} placeholders. function use this setting to keep generated names, descriptions, and display folders consistent across the project. analyticscreator uses this value when no custom value is saved for the project. keep placeholder names unchanged when adapting the pattern. this value supports placeholders such as {sourcename1}, {sourcename2}, {columnname}, {sourceschema1}, {sourceid1}, {friendlyname1}, {sourceschema2}, {sourceid2}, {friendlyname2}, {columnid}, {columnfriendlyname}. access the parameter is maintained from the parameters list in analyticscreator. how to access navigation tree parameters->list parameters toolbar options->parameter diagram not opened from the diagram. visual element parameter list default value rc_{sourcename1}_{sourcename2}_{columnname} custom value not set. where it is used this parameter belongs to the naming & metadata group and is used when analyticscreator applies generated names, descriptions, and display folders. setting value technical parameter name source_reference_onecol_description_pattern default value rc_{sourcename1}_{sourcename2}_{columnname} custom value not set. parameter groups group naming & metadata names & metadata naming related topics naming & metadata source reference description pattern table reference description pattern parameters previous table reference description pattern nexttable reference onecol description pattern"}
,{"id":389870937277,"name":"Table Reference Onecol Description Pattern","type":"topic","path":"/docs/reference/parameters/parameters-naming-and-metadata/parameters-naming-and-metadata-table-reference-onecol-description-pattern","breadcrumb":"Reference › Parameters › Naming & Metadata › Table Reference Onecol Description Pattern","description":"","searchText":"reference parameters naming & metadata table reference onecol description pattern overview table reference onecol description pattern is a naming & metadata parameter that defines the autogenerated one-column table reference description. you can use {tableschema1}, {tablename1}, {tableid1}, {friendlyname1}, {tableschema2}, {tablename2}, {tableid2}, {friendlyname2}, {columnname}, {columnid} and {columnfriendlyname} placeholders. function use this setting to keep generated names, descriptions, and display folders consistent across the project. analyticscreator uses this value when no custom value is saved for the project. keep placeholder names unchanged when adapting the pattern. this value supports placeholders such as {tablename1}, {tablename2}, {columnname}, {tableschema1}, {tableid1}, {friendlyname1}, {tableschema2}, {tableid2}, {friendlyname2}, {columnid}, {columnfriendlyname}. access the parameter is maintained from the parameters list in analyticscreator. how to access navigation tree parameters->list parameters toolbar options->parameter diagram not opened from the diagram. visual element parameter list default value rc_{tablename1}_{tablename2}_{columnname} custom value not set. where it is used this parameter belongs to the naming & metadata group and is used when analyticscreator applies generated names, descriptions, and display folders. setting value technical parameter name table_reference_onecol_description_pattern default value rc_{tablename1}_{tablename2}_{columnname} custom value not set. parameter groups group naming & metadata names & metadata naming related topics naming & metadata table reference description pattern parameters previous source reference onecol description pattern nextdescription inherit tables"}
,{"id":389870937278,"name":"Description Inherit Tables","type":"topic","path":"/docs/reference/parameters/parameters-naming-and-metadata/parameters-naming-and-metadata-description-inherit-tables","breadcrumb":"Reference › Parameters › Naming & Metadata › Description Inherit Tables","description":"","searchText":"reference parameters naming & metadata description inherit tables overview description inherit tables is a naming & metadata parameter that controls description inheritance from the tables to the dependent tables: 0 - inherit if empty, 1 - always, 2 - never. function use this setting to keep generated names, descriptions, and display folders consistent across the project. analyticscreator uses this value when no custom value is saved for the project. access the parameter is maintained from the parameters list in analyticscreator. how to access navigation tree parameters->list parameters toolbar options->parameter diagram not opened from the diagram. visual element parameter list default value 0 custom value not set. where it is used this parameter belongs to the naming & metadata group and is used when analyticscreator applies generated names, descriptions, and display folders. setting value technical parameter name description_inherit_tables default value 0 custom value not set. parameter groups group naming & metadata names & metadata naming related topics naming & metadata description inherit table columns description inherit trans parameters previous table reference onecol description pattern nextdescription inherit trans"}
,{"id":389870937279,"name":"Description Inherit Trans","type":"topic","path":"/docs/reference/parameters/parameters-naming-and-metadata/parameters-naming-and-metadata-description-inherit-trans","breadcrumb":"Reference › Parameters › Naming & Metadata › Description Inherit Trans","description":"","searchText":"reference parameters naming & metadata description inherit trans overview description inherit trans is a naming & metadata parameter that controls description inheritance from the first transformation table to the transformation: 0 - inherit if empty, 1 - always, 2 - never. function use this setting to keep generated names, descriptions, and display folders consistent across the project. analyticscreator uses this value when no custom value is saved for the project. access the parameter is maintained from the parameters list in analyticscreator. how to access navigation tree parameters->list parameters toolbar options->parameter diagram not opened from the diagram. visual element parameter list default value 0 custom value not set. where it is used this parameter belongs to the naming & metadata group and is used when analyticscreator applies generated names, descriptions, and display folders. setting value technical parameter name description_inherit_trans default value 0 custom value not set. parameter groups group naming & metadata names & metadata naming related topics naming & metadata description inherit tables description inherit trans columns parameters previous description inherit tables nextdescription inherit trans tables"}
,{"id":389870937280,"name":"Description Inherit Trans Tables","type":"topic","path":"/docs/reference/parameters/parameters-naming-and-metadata/parameters-naming-and-metadata-description-inherit-trans-tables","breadcrumb":"Reference › Parameters › Naming & Metadata › Description Inherit Trans Tables","description":"","searchText":"reference parameters naming & metadata description inherit trans tables overview description inherit trans tables is a naming & metadata parameter that controls description inheritance from the transformations to the transtables and persisted tables: 0 - inherit if empty, 1 - always, 2 - never. function use this setting to keep generated names, descriptions, and display folders consistent across the project. analyticscreator uses this value when no custom value is saved for the project. access the parameter is maintained from the parameters list in analyticscreator. how to access navigation tree parameters->list parameters toolbar options->parameter diagram not opened from the diagram. visual element parameter list default value 1 custom value not set. where it is used this parameter belongs to the naming & metadata group and is used when analyticscreator applies generated names, descriptions, and display folders. setting value technical parameter name description_inherit_transtables default value 1 custom value not set. parameter groups group naming & metadata names & metadata naming related topics naming & metadata description inherit trans table columns description pattern calendar id parameters previous description inherit trans nextdescription inherit table columns"}
,{"id":389870937281,"name":"Description Inherit Table Columns","type":"topic","path":"/docs/reference/parameters/parameters-naming-and-metadata/parameters-naming-and-metadata-description-inherit-table-columns","breadcrumb":"Reference › Parameters › Naming & Metadata › Description Inherit Table Columns","description":"","searchText":"reference parameters naming & metadata description inherit table columns overview description inherit table columns is a naming & metadata parameter that controls description inheritance from the table columns to the dependent table columns: 0 - inherit if empty, 1 - always, 2 - never. function use this setting to keep generated names, descriptions, and display folders consistent across the project. analyticscreator uses this value when no custom value is saved for the project. access the parameter is maintained from the parameters list in analyticscreator. how to access navigation tree parameters->list parameters toolbar options->parameter diagram not opened from the diagram. visual element parameter list default value 0 custom value not set. where it is used this parameter belongs to the naming & metadata group and is used when analyticscreator applies generated names, descriptions, and display folders. setting value technical parameter name description_inherit_tablecolumns default value 0 custom value not set. parameter groups group naming & metadata names & metadata naming related topics naming & metadata description inherit tables parameters previous description inherit trans tables nextdescription inherit trans columns"}
,{"id":389870937282,"name":"Description Inherit Trans Columns","type":"topic","path":"/docs/reference/parameters/parameters-naming-and-metadata/parameters-naming-and-metadata-description-inherit-trans-columns","breadcrumb":"Reference › Parameters › Naming & Metadata › Description Inherit Trans Columns","description":"","searchText":"reference parameters naming & metadata description inherit trans columns overview description inherit trans columns is a naming & metadata parameter that controls description inheritance from the table columns of the data source to the transformation columns: 0 - inherit if empty, 1 - always, 2 - never. function use this setting to keep generated names, descriptions, and display folders consistent across the project. analyticscreator uses this value when no custom value is saved for the project. access the parameter is maintained from the parameters list in analyticscreator. how to access navigation tree parameters->list parameters toolbar options->parameter diagram not opened from the diagram. visual element parameter list default value 0 custom value not set. where it is used this parameter belongs to the naming & metadata group and is used when analyticscreator applies generated names, descriptions, and display folders. setting value technical parameter name description_inherit_transcolumns default value 0 custom value not set. parameter groups group naming & metadata names & metadata naming related topics naming & metadata description inherit trans description inherit trans table columns parameters previous description inherit table columns nextdescription inherit trans table columns"}
,{"id":389870937283,"name":"Description Inherit Trans Table Columns","type":"topic","path":"/docs/reference/parameters/parameters-naming-and-metadata/parameters-naming-and-metadata-description-inherit-trans-table-columns","breadcrumb":"Reference › Parameters › Naming & Metadata › Description Inherit Trans Table Columns","description":"","searchText":"reference parameters naming & metadata description inherit trans table columns overview description inherit trans table columns is a naming & metadata parameter that controls description inheritance from the transformation columns to the transtable columns and persisted table columns: 0 - inherit if empty, 1 - always, 2 - never. function use this setting to keep generated names, descriptions, and display folders consistent across the project. analyticscreator uses this value when no custom value is saved for the project. access the parameter is maintained from the parameters list in analyticscreator. how to access navigation tree parameters->list parameters toolbar options->parameter diagram not opened from the diagram. visual element parameter list default value 1 custom value not set. where it is used this parameter belongs to the naming & metadata group and is used when analyticscreator applies generated names, descriptions, and display folders. setting value technical parameter name description_inherit_transtable_columns default value 1 custom value not set. parameter groups group naming & metadata names & metadata naming related topics naming & metadata description inherit trans columns description inherit trans tables parameters previous description inherit trans columns nextdescription set special"}
,{"id":389870937284,"name":"Description Set Special","type":"topic","path":"/docs/reference/parameters/parameters-naming-and-metadata/parameters-naming-and-metadata-description-set-special","breadcrumb":"Reference › Parameters › Naming & Metadata › Description Set Special","description":"","searchText":"reference parameters naming & metadata description set special overview description set special is a naming & metadata parameter that controls whether the description of special columns (snapshotid, surrogate key, calendarid) is set automatically: 0 - yes if empty, 1 - always, 2 - never. function use this setting to keep generated names, descriptions, and display folders consistent across the project. numeric values in this parameter act as choices; use the description to interpret each option. access the parameter is maintained from the parameters list in analyticscreator. how to access navigation tree parameters->list parameters toolbar options->parameter diagram not opened from the diagram. visual element parameter list default value 0 custom value not set. where it is used this parameter belongs to the naming & metadata group and is used when analyticscreator applies generated names, descriptions, and display folders. setting value technical parameter name description_set_special default value 0 custom value not set. parameter groups group naming & metadata names & metadata naming related topics naming & metadata description pattern statement description use statements parameters previous description inherit trans table columns nextdescription use statements"}
,{"id":389870937285,"name":"Description Use Statements","type":"topic","path":"/docs/reference/parameters/parameters-naming-and-metadata/parameters-naming-and-metadata-description-use-statements","breadcrumb":"Reference › Parameters › Naming & Metadata › Description Use Statements","description":"","searchText":"reference parameters naming & metadata description use statements overview description use statements is a naming & metadata parameter that controls whether the statement is used as the description: 0 - yes if empty (priority over inherited description), 1 - always, 2 - yes if empty (inherited description has priority), 3 - never. function use this setting to keep generated names, descriptions, and display folders consistent across the project. numeric values in this parameter act as choices; use the description to interpret each option. access the parameter is maintained from the parameters list in analyticscreator. how to access navigation tree parameters->list parameters toolbar options->parameter diagram not opened from the diagram. visual element parameter list default value 0 custom value not set. where it is used this parameter belongs to the naming & metadata group and is used when analyticscreator applies generated names, descriptions, and display folders. setting value technical parameter name description_use_statements default value 0 custom value not set. parameter groups group naming & metadata names & metadata naming related topics naming & metadata description set special diagram name pattern parameters previous description set special nextfriendly name inherit tables"}
,{"id":389870937286,"name":"Friendly Name Inherit Tables","type":"topic","path":"/docs/reference/parameters/parameters-naming-and-metadata/parameters-naming-and-metadata-friendly-name-inherit-tables","breadcrumb":"Reference › Parameters › Naming & Metadata › Friendly Name Inherit Tables","description":"","searchText":"reference parameters naming & metadata friendly name inherit tables overview friendly name inherit tables is a naming & metadata parameter that controls friendly name inheritance from the tables to the dependent tables: 0 - inherit if empty, 1 - always, 2 - never. function use this setting to keep generated names, descriptions, and display folders consistent across the project. analyticscreator uses this value when no custom value is saved for the project. access the parameter is maintained from the parameters list in analyticscreator. how to access navigation tree parameters->list parameters toolbar options->parameter diagram not opened from the diagram. visual element parameter list default value 0 custom value not set. where it is used this parameter belongs to the naming & metadata group and is used when analyticscreator applies generated names, descriptions, and display folders. setting value technical parameter name friendlyname_inherit_tables default value 0 custom value not set. parameter groups group naming & metadata names & metadata naming related topics naming & metadata friendly name inherit table columns friendly name inherit trans parameters previous description use statements nextfriendly name inherit trans"}
,{"id":389870937287,"name":"Friendly Name Inherit Trans","type":"topic","path":"/docs/reference/parameters/parameters-naming-and-metadata/parameters-naming-and-metadata-friendly-name-inherit-trans","breadcrumb":"Reference › Parameters › Naming & Metadata › Friendly Name Inherit Trans","description":"","searchText":"reference parameters naming & metadata friendly name inherit trans overview friendly name inherit trans is a naming & metadata parameter that controls friendly name inheritance from the first transformation table to the transformation: 0 - inherit if empty, 1 - always, 2 - never. function use this setting to keep generated names, descriptions, and display folders consistent across the project. analyticscreator uses this value when no custom value is saved for the project. access the parameter is maintained from the parameters list in analyticscreator. how to access navigation tree parameters->list parameters toolbar options->parameter diagram not opened from the diagram. visual element parameter list default value 0 custom value not set. where it is used this parameter belongs to the naming & metadata group and is used when analyticscreator applies generated names, descriptions, and display folders. setting value technical parameter name friendlyname_inherit_trans default value 0 custom value not set. parameter groups group naming & metadata names & metadata naming related topics naming & metadata friendly name inherit tables friendly name inherit trans columns parameters previous friendly name inherit tables nextfriendly name inherit trans tables"}
,{"id":389870937288,"name":"Friendly Name Inherit Trans Tables","type":"topic","path":"/docs/reference/parameters/parameters-naming-and-metadata/parameters-naming-and-metadata-friendly-name-inherit-trans-tables","breadcrumb":"Reference › Parameters › Naming & Metadata › Friendly Name Inherit Trans Tables","description":"","searchText":"reference parameters naming & metadata friendly name inherit trans tables overview friendly name inherit trans tables is a naming & metadata parameter that controls friendly name inheritance from the transformations to the transtables and persisted tables: 0 - inherit if empty, 1 - always, 2 - never. function use this setting to keep generated names, descriptions, and display folders consistent across the project. analyticscreator uses this value when no custom value is saved for the project. access the parameter is maintained from the parameters list in analyticscreator. how to access navigation tree parameters->list parameters toolbar options->parameter diagram not opened from the diagram. visual element parameter list default value 1 custom value not set. where it is used this parameter belongs to the naming & metadata group and is used when analyticscreator applies generated names, descriptions, and display folders. setting value technical parameter name friendlyname_inherit_transtables default value 1 custom value not set. parameter groups group naming & metadata names & metadata naming related topics naming & metadata friendly name inherit trans table columns friendly name pattern calendar id parameters previous friendly name inherit trans nextfriendly name inherit table columns"}
,{"id":389870937289,"name":"Friendly Name Inherit Table Columns","type":"topic","path":"/docs/reference/parameters/parameters-naming-and-metadata/parameters-naming-and-metadata-friendly-name-inherit-table-columns","breadcrumb":"Reference › Parameters › Naming & Metadata › Friendly Name Inherit Table Columns","description":"","searchText":"reference parameters naming & metadata friendly name inherit table columns overview friendly name inherit table columns is a naming & metadata parameter that controls friendly name inheritance from the table columns to the dependent table columns: 0 - inherit if empty, 1 - always, 2 - never. function use this setting to keep generated names, descriptions, and display folders consistent across the project. analyticscreator uses this value when no custom value is saved for the project. access the parameter is maintained from the parameters list in analyticscreator. how to access navigation tree parameters->list parameters toolbar options->parameter diagram not opened from the diagram. visual element parameter list default value 0 custom value not set. where it is used this parameter belongs to the naming & metadata group and is used when analyticscreator applies generated names, descriptions, and display folders. setting value technical parameter name friendlyname_inherit_tablecolumns default value 0 custom value not set. parameter groups group naming & metadata names & metadata naming related topics naming & metadata display folder inherit trans table columns friendly name inherit tables parameters previous friendly name inherit trans tables nextfriendly name inherit trans columns"}
,{"id":389870937290,"name":"Friendly Name Inherit Trans Columns","type":"topic","path":"/docs/reference/parameters/parameters-naming-and-metadata/parameters-naming-and-metadata-friendly-name-inherit-trans-columns","breadcrumb":"Reference › Parameters › Naming & Metadata › Friendly Name Inherit Trans Columns","description":"","searchText":"reference parameters naming & metadata friendly name inherit trans columns overview friendly name inherit trans columns is a naming & metadata parameter that controls friendly name inheritance from the table columns to the transformation columns: 0 - inherit if empty, 1 - always, 2 - never. function use this setting to keep generated names, descriptions, and display folders consistent across the project. analyticscreator uses this value when no custom value is saved for the project. access the parameter is maintained from the parameters list in analyticscreator. how to access navigation tree parameters->list parameters toolbar options->parameter diagram not opened from the diagram. visual element parameter list default value 0 custom value not set. where it is used this parameter belongs to the naming & metadata group and is used when analyticscreator applies generated names, descriptions, and display folders. setting value technical parameter name friendlyname_inherit_transcolumns default value 0 custom value not set. parameter groups group naming & metadata names & metadata naming related topics naming & metadata friendly name inherit trans friendly name inherit trans table columns parameters previous friendly name inherit table columns nextfriendly name inherit trans table columns"}
,{"id":389870937291,"name":"Friendly Name Inherit Trans Table Columns","type":"topic","path":"/docs/reference/parameters/parameters-naming-and-metadata/parameters-naming-and-metadata-friendly-name-inherit-trans-table-columns","breadcrumb":"Reference › Parameters › Naming & Metadata › Friendly Name Inherit Trans Table Columns","description":"","searchText":"reference parameters naming & metadata friendly name inherit trans table columns overview friendly name inherit trans table columns is a naming & metadata parameter that controls friendly name inheritance from the transformation columns to the transtable columns and persisted table columns: 0 - inherit if empty, 1 - always, 2 - never. function use this setting to keep generated names, descriptions, and display folders consistent across the project. analyticscreator uses this value when no custom value is saved for the project. access the parameter is maintained from the parameters list in analyticscreator. how to access navigation tree parameters->list parameters toolbar options->parameter diagram not opened from the diagram. visual element parameter list default value 1 custom value not set. where it is used this parameter belongs to the naming & metadata group and is used when analyticscreator applies generated names, descriptions, and display folders. setting value technical parameter name friendlyname_inherit_transtable_columns default value 1 custom value not set. parameter groups group naming & metadata names & metadata naming related topics naming & metadata friendly name inherit trans columns friendly name inherit trans tables parameters previous friendly name inherit trans columns nextfriendly name set special"}
,{"id":389870937292,"name":"Friendly Name Set Special","type":"topic","path":"/docs/reference/parameters/parameters-naming-and-metadata/parameters-naming-and-metadata-friendly-name-set-special","breadcrumb":"Reference › Parameters › Naming & Metadata › Friendly Name Set Special","description":"","searchText":"reference parameters naming & metadata friendly name set special overview friendly name set special is a naming & metadata parameter that controls the automatically set friendly name of special columns (snapshotid, surrogate key, calendarid): 0 - yes if empty, 1 - always, 2 - never. function use this setting to keep generated names, descriptions, and display folders consistent across the project. numeric values in this parameter act as choices; use the description to interpret each option. access the parameter is maintained from the parameters list in analyticscreator. how to access navigation tree parameters->list parameters toolbar options->parameter diagram not opened from the diagram. visual element parameter list default value 0 custom value not set. where it is used this parameter belongs to the naming & metadata group and is used when analyticscreator applies generated names, descriptions, and display folders. setting value technical parameter name friendlyname_set_special default value 0 custom value not set. parameter groups group naming & metadata names & metadata naming related topics naming & metadata friendly name pattern snapshot id source reference description pattern parameters previous friendly name inherit trans table columns nextdisplay folder inherit table columns"}
,{"id":389870937293,"name":"Display Folder Inherit Table Columns","type":"topic","path":"/docs/reference/parameters/parameters-naming-and-metadata/parameters-naming-and-metadata-display-folder-inherit-table-columns","breadcrumb":"Reference › Parameters › Naming & Metadata › Display Folder Inherit Table Columns","description":"","searchText":"reference parameters naming & metadata display folder inherit table columns overview display folder inherit table columns is a naming & metadata parameter that controls olap display folder inheritance from the table columns to the dependent table columns: 0 - inherit if empty, 1 - always, 2 - never. function use this setting to keep generated names, descriptions, and display folders consistent across the project. analyticscreator uses this value when no custom value is saved for the project. access the parameter is maintained from the parameters list in analyticscreator. how to access navigation tree parameters->list parameters toolbar options->parameter diagram not opened from the diagram. visual element parameter list default value 0 custom value not set. where it is used this parameter belongs to the naming & metadata group and is used when analyticscreator applies generated names, descriptions, and display folders. setting value technical parameter name displayfolder_inherit_tablecolumns default value 0 custom value not set. parameter groups group naming & metadata names & metadata naming related topics naming & metadata diagram name pattern display folder inherit trans columns parameters previous friendly name set special nextdisplay folder inherit trans columns"}
,{"id":389870937294,"name":"Display Folder Inherit Trans Columns","type":"topic","path":"/docs/reference/parameters/parameters-naming-and-metadata/parameters-naming-and-metadata-display-folder-inherit-trans-columns","breadcrumb":"Reference › Parameters › Naming & Metadata › Display Folder Inherit Trans Columns","description":"","searchText":"reference parameters naming & metadata display folder inherit trans columns overview display folder inherit trans columns is a naming & metadata parameter that controls olap display folder inheritance from the table columns to the transformation columns: 0 - inherit if empty, 1 - always, 2 - never. function use this setting to keep generated names, descriptions, and display folders consistent across the project. analyticscreator uses this value when no custom value is saved for the project. access the parameter is maintained from the parameters list in analyticscreator. how to access navigation tree parameters->list parameters toolbar options->parameter diagram not opened from the diagram. visual element parameter list default value 0 custom value not set. where it is used this parameter belongs to the naming & metadata group and is used when analyticscreator applies generated names, descriptions, and display folders. setting value technical parameter name displayfolder_inherit_transcolumns default value 0 custom value not set. parameter groups group naming & metadata names & metadata naming related topics naming & metadata display folder inherit table columns display folder inherit trans table columns parameters previous display folder inherit table columns nextdisplay folder inherit trans table columns"}
,{"id":389870937295,"name":"Display Folder Inherit Trans Table Columns","type":"topic","path":"/docs/reference/parameters/parameters-naming-and-metadata/parameters-naming-and-metadata-display-folder-inherit-trans-table-columns","breadcrumb":"Reference › Parameters › Naming & Metadata › Display Folder Inherit Trans Table Columns","description":"","searchText":"reference parameters naming & metadata display folder inherit trans table columns overview display folder inherit trans table columns is a naming & metadata parameter that controls olap display folder inheritance from the transformation columns to the transtable columns and persisted table columns: 0 - inherit if empty, 1 - always, 2 - never. function use this setting to keep generated names, descriptions, and display folders consistent across the project. analyticscreator uses this value when no custom value is saved for the project. access the parameter is maintained from the parameters list in analyticscreator. how to access navigation tree parameters->list parameters toolbar options->parameter diagram not opened from the diagram. visual element parameter list default value 1 custom value not set. where it is used this parameter belongs to the naming & metadata group and is used when analyticscreator applies generated names, descriptions, and display folders. setting value technical parameter name displayfolder_inherit_transtable_columns default value 1 custom value not set. parameter groups group naming & metadata names & metadata naming related topics naming & metadata display folder inherit trans columns friendly name inherit table columns parameters previous display folder inherit trans columns nextreferences"}
,{"id":389870784719,"name":"References","type":"subsection","path":"/docs/reference/parameters/parameters-references","breadcrumb":"Reference › Parameters › References","description":"","searchText":"reference parameters references configures generated references and relationship inheritance. use this page to find the references settings, review their defaults, and open the detailed parameter pages. available parameters parameter technical name default value purpose autocreated references use friendly name autocreated_references_use_friendly_name 0 use friendly names instead of table names in description of autocreated references: 0 - no, 1 - yes. delete unused references on delete columns delete_unused_references_on_delete_columns 0 delete unused references on delete columns: 0 - no, 1 - yes. dwh create references dwh_create_references 0 create disabled references between tables in data warehouse. ref tables recursion depth ref_tables_recursion_depth 5 max recursion depth during the detection of referenced tables in the transformation wizard. reference pk to pk cardinality reference_pk_to_pk_cardinality 0 cardinality of pk-to-pk reference. 0 - n:1, 1 - 1:1. references datamart references_datamart 0 0 - all references are allowed, 1 - only references between objects in the same star are allowed, 2 - only references between the objects in the same schema are allowed. references inheritance references_inheritance 0 0 - within schema only, 1 - within layer only, 2 - within layer and its neighbourhood, 3 - everywhere. references inheritance force manually created references_inheritance_force_manually_created 0 0 - manually created references will be inherited like all other references, 1 - manually created references will be always inherited, 2 - manually created references and their successors will be always inherited. previous display folder inherit trans table columns nextautocreated references use friendly name"}
,{"id":389870937296,"name":"Autocreated References Use Friendly Name","type":"topic","path":"/docs/reference/parameters/parameters-references/parameters-references-autocreated-references-use-friendly-name","breadcrumb":"Reference › Parameters › References › Autocreated References Use Friendly Name","description":"","searchText":"reference parameters references autocreated references use friendly name overview autocreated references use friendly name is a references parameter that controls whether friendly names are used instead of table names in the description of autocreated references: 0 - no, 1 - yes. function use this setting to keep generated references and relationships consistent across the project. analyticscreator uses this value when no custom value is saved for the project. access the parameter is maintained from the parameters list in analyticscreator. how to access navigation tree parameters->list parameters toolbar options->parameter diagram not opened from the diagram. visual element parameter list default value 0 custom value not set. where it is used this parameter belongs to the references group and is used when analyticscreator applies generated references and relationships. setting value technical parameter name autocreated_references_use_friendly_name default value 0 custom value not set. parameter groups group references relationships links related topics references delete unused references on delete columns parameters previous references nextref tables recursion depth"}
,{"id":389870937297,"name":"Ref Tables Recursion Depth","type":"topic","path":"/docs/reference/parameters/parameters-references/parameters-references-ref-tables-recursion-depth","breadcrumb":"Reference › Parameters › References › Ref Tables Recursion Depth","description":"","searchText":"reference parameters references ref tables recursion depth overview ref tables recursion depth is a references parameter that controls the max recursion depth during the detection of referenced tables in the transformation wizard. function use this setting to keep generated references and relationships consistent across the project. analyticscreator uses this value when no custom value is saved for the project. access the parameter is maintained from the parameters list in analyticscreator. how to access navigation tree parameters->list parameters toolbar options->parameter diagram not opened from the diagram. visual element parameter list default value 5 custom value not set. where it is used this parameter belongs to the references group and is used when analyticscreator applies generated references and relationships. setting value technical parameter name ref_tables_recursion_depth default value 5 custom value not set. parameter groups group references relationships links related topics references dwh create references reference pk to pk cardinality parameters previous autocreated references use friendly name nextdwh create references"}
,{"id":389870937298,"name":"DWH Create References","type":"topic","path":"/docs/reference/parameters/parameters-references/parameters-references-dwh-create-references","breadcrumb":"Reference › Parameters › References › DWH Create References","description":"","searchText":"reference parameters references dwh create references overview dwh create references is a references parameter that controls whether analyticscreator creates disabled references between tables in the data warehouse. function use this setting to keep generated references and relationships consistent across the project. analyticscreator uses this value when no custom value is saved for the project. access the parameter is maintained from the parameters list in analyticscreator. how to access navigation tree parameters->list parameters toolbar options->parameter diagram not opened from the diagram. visual element parameter list default value 0 custom value not set. where it is used this parameter belongs to the references group and is used when analyticscreator applies generated references and relationships. setting value technical parameter name dwh_create_references default value 0 custom value not set. parameter groups group references relationships links related topics references delete unused references on delete columns ref tables recursion depth parameters previous ref tables recursion depth nextreferences inheritance"}
,{"id":389870937299,"name":"References Inheritance","type":"topic","path":"/docs/reference/parameters/parameters-references/parameters-references-references-inheritance","breadcrumb":"Reference › Parameters › References › References Inheritance","description":"","searchText":"reference parameters references references inheritance overview references inheritance is a references parameter that sets the option used for references inheritance. function use this setting to keep generated references and relationships consistent across the project. analyticscreator uses this value when no custom value is saved for the project. access the parameter is maintained from the parameters list in analyticscreator. how to access navigation tree parameters->list parameters toolbar options->parameter diagram not opened from the diagram. visual element parameter list default value 0 custom value not set. where it is used this parameter belongs to the references group and is used when analyticscreator applies generated references and relationships. setting value technical parameter name references_inheritance default value 0 custom value not set. parameter groups group references relationships links related topics references references datamart references inheritance force manually created parameters previous dwh create references nextreferences datamart"}
,{"id":389870937300,"name":"References Datamart","type":"topic","path":"/docs/reference/parameters/parameters-references/parameters-references-references-datamart","breadcrumb":"Reference › Parameters › References › References Datamart","description":"","searchText":"reference parameters references references datamart overview references datamart is a references parameter that controls which references are allowed in the data mart: 0 - all references, 1 - only within the same star, 2 - only within the same schema. function use this setting to keep generated references and relationships consistent across the project. analyticscreator uses this value when no custom value is saved for the project. access the parameter is maintained from the parameters list in analyticscreator. how to access navigation tree parameters->list parameters toolbar options->parameter diagram not opened from the diagram. visual element parameter list default value 0 custom value not set. where it is used this parameter belongs to the references group and is used when analyticscreator applies generated references and relationships. setting value technical parameter name references_datamart default value 0 custom value not set. parameter groups group references relationships links related topics references reference pk to pk cardinality references inheritance parameters previous references inheritance nextreferences inheritance force manually created"}
,{"id":389870937301,"name":"References Inheritance Force Manually Created","type":"topic","path":"/docs/reference/parameters/parameters-references/parameters-references-references-inheritance-force-manually-created","breadcrumb":"Reference › Parameters › References › References Inheritance Force Manually Created","description":"","searchText":"reference parameters references references inheritance force manually created overview references inheritance force manually created is a references parameter that controls how manually created references are inherited: 0 - inherited like all other references, 1 - always inherited, 2 - the references and their successors are always inherited. function use this setting to keep generated references and relationships consistent across the project. analyticscreator uses this value when no custom value is saved for the project. access the parameter is maintained from the parameters list in analyticscreator. how to access navigation tree parameters->list parameters toolbar options->parameter diagram not opened from the diagram. visual element parameter list default value 0 custom value not set. where it is used this parameter belongs to the references group and is used when analyticscreator applies generated references and relationships. setting value technical parameter name references_inheritance_force_manually_created default value 0 custom value not set. parameter groups group references relationships links related topics references references inheritance parameters previous references datamart nextreference pk to pk cardinality"}
,{"id":389870937302,"name":"Reference PK To PK Cardinality","type":"topic","path":"/docs/reference/parameters/parameters-references/parameters-references-reference-pk-to-pk-cardinality","breadcrumb":"Reference › Parameters › References › Reference PK To PK Cardinality","description":"","searchText":"reference parameters references reference pk to pk cardinality overview reference pk to pk cardinality is a references parameter that controls the cardinality of a pk-to-pk reference: 0 - n:1, 1 - 1:1. function use this setting to keep generated references and relationships consistent across the project. analyticscreator uses this value when no custom value is saved for the project. access the parameter is maintained from the parameters list in analyticscreator. how to access navigation tree parameters->list parameters toolbar options->parameter diagram not opened from the diagram. visual element parameter list default value 0 custom value not set. where it is used this parameter belongs to the references group and is used when analyticscreator applies generated references and relationships. setting value technical parameter name reference_pk_to_pk_cardinality default value 0 custom value not set. parameter groups group references relationships links related topics references ref tables recursion depth references datamart parameters previous references inheritance force manually created nextdelete unused references on delete columns"}
,{"id":389870937303,"name":"Delete Unused References On Delete Columns","type":"topic","path":"/docs/reference/parameters/parameters-references/parameters-references-delete-unused-references-on-delete-columns","breadcrumb":"Reference › Parameters › References › Delete Unused References On Delete Columns","description":"","searchText":"reference parameters references delete unused references on delete columns overview delete unused references on delete columns controls whether unused references are deleted when columns are deleted (0 - no, 1 - yes) function use this setting to keep generated references and relationships consistent across the project. numeric values in this parameter act as choices; use the description to interpret each option. access the parameter is maintained from the parameters list in analyticscreator. how to access navigation tree parameters->list parameters toolbar options->parameter diagram not opened from the diagram. visual element parameter list default value 0 custom value not set. where it is used this parameter belongs to the references group and is used when analyticscreator applies generated references and relationships. setting value technical parameter name delete_unused_references_on_delete_columns default value 0 custom value not set. parameter groups group references relationships links related topics references autocreated references use friendly name dwh create references parameters previous reference pk to pk cardinality nextconnectors"}
,{"id":389870784720,"name":"Connectors","type":"subsection","path":"/docs/reference/parameters/parameters-connectors","breadcrumb":"Reference › Parameters › Connectors","description":"","searchText":"reference parameters connectors stores connector-specific defaults and connection-related values. use this page to find the connectors settings, review their defaults, and open the detailed parameter pages. available parameters parameter technical name default value purpose azure blob connection string azure_blob_connection_string defaultendpointsprotocol=https;accountname={0};accountkey={1};endpointsuffix=core.windows.net connection string for azure blob storage. odata connection string odata_connection_string service document url={0};include atom elements=auto;include expanded entities=false;persist security info=false;time out=600;schema sample size=25;retry count=5;retry sleep=100;keep alive=false;max received message size=4398046511104 connection string for the odata service. oledb provider sql server oledbprovider_sqlserver msoledbsql oledb provider for sql server. previous delete unused references on delete columns nextoledb provider sql server"}
,{"id":388515715285,"name":"OLEDB Provider SQL Server","type":"topic","path":"/docs/reference/parameters/parameters-connectors/parameters-connectors-oledb-provider-sql-server","breadcrumb":"Reference › Parameters › Connectors › OLEDB Provider SQL Server","description":"","searchText":"reference parameters connectors oledb provider sql server overview oledb provider sql server is a connectors parameter that selects the oledb provider for sql server. function use this setting to keep connector setup and source connection defaults consistent across the project. analyticscreator uses this value when no custom value is saved for the project. access the parameter is maintained from the parameters list in analyticscreator. how to access navigation tree parameters->list parameters toolbar options->parameter diagram not opened from the diagram. visual element parameter list default value msoledbsql custom value not set. where it is used this parameter belongs to the connectors group and is used when analyticscreator applies connector setup and source connection defaults. setting value technical parameter name oledbprovider_sqlserver default value msoledbsql custom value not set. parameter groups group connectors connections connector setup related topics connectors odata connection string parameters previous connectors nextazure blob connection string"}
,{"id":389870937304,"name":"Azure BLOB Connection String","type":"topic","path":"/docs/reference/parameters/parameters-connectors/parameters-connectors-azure-blob-connection-string","breadcrumb":"Reference › Parameters › Connectors › Azure BLOB Connection String","description":"","searchText":"reference parameters connectors azure blob connection string overview azure blob connection string is a connectors parameter that stores the connection string for azure blob storage. function use this setting to keep connector setup and source connection defaults consistent across the project. analyticscreator uses this value when no custom value is saved for the project. keep placeholder names unchanged when adapting the pattern. this value supports placeholders such as {0}, {1}. access the parameter is maintained from the parameters list in analyticscreator. how to access navigation tree parameters->list parameters toolbar options->parameter diagram not opened from the diagram. visual element parameter list default value defaultendpointsprotocol=https;accountname={0};accountkey={1};endpointsuffix=core.windows.net custom value not set. where it is used this parameter belongs to the connectors group and is used when analyticscreator applies connector setup and source connection defaults. setting value technical parameter name azure_blob_connection_string default value defaultendpointsprotocol=https;accountname={0};accountkey={1};endpointsuffix=core.windows.net custom value not set. parameter groups group connectors connections connector setup related topics connectors odata connection string parameters previous oledb provider sql server nextodata connection string"}
,{"id":389870937305,"name":"OData Connection String","type":"topic","path":"/docs/reference/parameters/parameters-connectors/parameters-connectors-odata-connection-string","breadcrumb":"Reference › Parameters › Connectors › OData Connection String","description":"","searchText":"reference parameters connectors odata connection string overview odata connection string is a connectors parameter that stores the connection string for the odata service. function use this setting to keep connector setup and source connection defaults consistent across the project. analyticscreator uses this value when no custom value is saved for the project. keep placeholder names unchanged when adapting the pattern. this value supports placeholders such as {0}. access the parameter is maintained from the parameters list in analyticscreator. how to access navigation tree parameters->list parameters toolbar options->parameter diagram not opened from the diagram. visual element parameter list default value service document url={0};include atom elements=auto;include expanded entities=false;persist security info=false;time out=600;schema sample size=25;retry count=5;retry sleep=100;keep alive=false;max received message size=4398046511104 custom value not set. where it is used this parameter belongs to the connectors group and is used when analyticscreator applies connector setup and source connection defaults. setting value technical parameter name odata_connection_string default value service document url={0};include atom elements=auto;include expanded entities=false;persist security info=false;time out=600;schema sample size=25;retry count=5;retry sleep=100;keep alive=false;max received message size=4398046511104 custom value not set. parameter groups group connectors connections connector setup related topics connectors azure blob connection string oledb provider sql server parameters previous azure blob connection string nextrepository names"}
,{"id":389870784721,"name":"Repository Names","type":"subsection","path":"/docs/reference/parameters/parameters-repository-names","breadcrumb":"Reference › Parameters › Repository Names","description":"","searchText":"reference parameters repository names defines naming labels used for repository layers. use this page to find the repository names settings, review their defaults, and open the detailed parameter pages. available parameters parameter technical name default value purpose layer1 name layer1_name source layer source layer name. layer2 name layer2_name staging layer staging layer name. layer3 name layer3_name persisted staging layer persisted staging layer name. layer4 name layer4_name transformation layer transformation layer name. layer5 name layer5_name data warehouse layer data warehouse layer name. layer6 name layer6_name data mart layer data mart layer name. repository name repository_name not set. repository name. previous odata connection string nextlayer1 name"}
,{"id":389870937306,"name":"Layer1 Name","type":"topic","path":"/docs/reference/parameters/parameters-repository-names/parameters-repository-names-layer1-name","breadcrumb":"Reference › Parameters › Repository Names › Layer1 Name","description":"","searchText":"reference parameters repository names layer1 name overview layer1 name is a repository names parameter that controls the source layer name. function use this setting to keep repository layer naming consistent across the project. analyticscreator uses this value when no custom value is saved for the project. access the parameter is maintained from the parameters list in analyticscreator. how to access navigation tree parameters->list parameters toolbar options->parameter diagram not opened from the diagram. visual element parameter list default value source layer custom value not set. where it is used this parameter belongs to the repository names group and is used when analyticscreator applies repository layer naming. setting value technical parameter name layer1_name default value source layer custom value not set. parameter groups group repository names layer names names related topics repository names layer2 name parameters previous repository names nextlayer2 name"}
,{"id":389870937307,"name":"Layer2 Name","type":"topic","path":"/docs/reference/parameters/parameters-repository-names/parameters-repository-names-layer2-name","breadcrumb":"Reference › Parameters › Repository Names › Layer2 Name","description":"","searchText":"reference parameters repository names layer2 name overview layer2 name is a repository names parameter that controls the staging layer name. function use this setting to keep repository layer naming consistent across the project. analyticscreator uses this value when no custom value is saved for the project. access the parameter is maintained from the parameters list in analyticscreator. how to access navigation tree parameters->list parameters toolbar options->parameter diagram not opened from the diagram. visual element parameter list default value staging layer custom value not set. where it is used this parameter belongs to the repository names group and is used when analyticscreator applies repository layer naming. setting value technical parameter name layer2_name default value staging layer custom value not set. parameter groups group repository names layer names names related topics repository names layer1 name layer3 name parameters previous layer1 name nextlayer3 name"}
,{"id":389870937308,"name":"Layer3 Name","type":"topic","path":"/docs/reference/parameters/parameters-repository-names/parameters-repository-names-layer3-name","breadcrumb":"Reference › Parameters › Repository Names › Layer3 Name","description":"","searchText":"reference parameters repository names layer3 name overview layer3 name is a repository names parameter that controls the persisted staging layer name. function use this setting to keep repository layer naming consistent across the project. analyticscreator uses this value when no custom value is saved for the project. access the parameter is maintained from the parameters list in analyticscreator. how to access navigation tree parameters->list parameters toolbar options->parameter diagram not opened from the diagram. visual element parameter list default value persisted staging layer custom value not set. where it is used this parameter belongs to the repository names group and is used when analyticscreator applies repository layer naming. setting value technical parameter name layer3_name default value persisted staging layer custom value not set. parameter groups group repository names layer names names related topics repository names layer2 name layer4 name parameters previous layer2 name nextlayer4 name"}
,{"id":389870937309,"name":"Layer4 Name","type":"topic","path":"/docs/reference/parameters/parameters-repository-names/parameters-repository-names-layer4-name","breadcrumb":"Reference › Parameters › Repository Names › Layer4 Name","description":"","searchText":"reference parameters repository names layer4 name overview layer4 name is a repository names parameter that controls the transformation layer name. function use this setting to keep repository layer naming consistent across the project. analyticscreator uses this value when no custom value is saved for the project. access the parameter is maintained from the parameters list in analyticscreator. how to access navigation tree parameters->list parameters toolbar options->parameter diagram not opened from the diagram. visual element parameter list default value transformation layer custom value not set. where it is used this parameter belongs to the repository names group and is used when analyticscreator applies repository layer naming. setting value technical parameter name layer4_name default value transformation layer custom value not set. parameter groups group repository names layer names names related topics repository names layer3 name layer5 name parameters previous layer3 name nextlayer5 name"}
,{"id":389870937310,"name":"Layer5 Name","type":"topic","path":"/docs/reference/parameters/parameters-repository-names/parameters-repository-names-layer5-name","breadcrumb":"Reference › Parameters › Repository Names › Layer5 Name","description":"","searchText":"reference parameters repository names layer5 name overview layer5 name is a repository names parameter that controls the data warehouse layer name. function use this setting to keep repository layer naming consistent across the project. analyticscreator uses this value when no custom value is saved for the project. access the parameter is maintained from the parameters list in analyticscreator. how to access navigation tree parameters->list parameters toolbar options->parameter diagram not opened from the diagram. visual element parameter list default value data warehouse layer custom value not set. where it is used this parameter belongs to the repository names group and is used when analyticscreator applies repository layer naming. setting value technical parameter name layer5_name default value data warehouse layer custom value not set. parameter groups group repository names layer names names related topics repository names layer4 name layer6 name parameters previous layer4 name nextlayer6 name"}
,{"id":389870937311,"name":"Layer6 Name","type":"topic","path":"/docs/reference/parameters/parameters-repository-names/parameters-repository-names-layer6-name","breadcrumb":"Reference › Parameters › Repository Names › Layer6 Name","description":"","searchText":"reference parameters repository names layer6 name overview layer6 name is a repository names parameter that controls the data mart layer name. function use this setting to keep repository layer naming consistent across the project. analyticscreator uses this value when no custom value is saved for the project. access the parameter is maintained from the parameters list in analyticscreator. how to access navigation tree parameters->list parameters toolbar options->parameter diagram not opened from the diagram. visual element parameter list default value data mart layer custom value not set. where it is used this parameter belongs to the repository names group and is used when analyticscreator applies repository layer naming. setting value technical parameter name layer6_name default value data mart layer custom value not set. parameter groups group repository names layer names names related topics repository names layer5 name repository name parameters previous layer5 name nextrepository name"}
,{"id":389870937312,"name":"Repository Name","type":"topic","path":"/docs/reference/parameters/parameters-repository-names/parameters-repository-names-repository-name","breadcrumb":"Reference › Parameters › Repository Names › Repository Name","description":"","searchText":"reference parameters repository names repository name overview repository name is a repository names parameter that defines the display name of the repository in analyticscreator. function use this setting to keep repository layer naming consistent across the project. analyticscreator uses this value when no custom value is saved for the project. access the parameter is maintained from the parameters list in analyticscreator. how to access navigation tree parameters->list parameters toolbar options->parameter diagram not opened from the diagram. visual element parameter list default value not set. custom value not set. where it is used this parameter belongs to the repository names group and is used when analyticscreator applies repository layer naming. setting value technical parameter name repository_name default value not set. custom value not set. parameter groups group repository names layer names names related topics repository names layer6 name parameters previous layer6 name nextlogging"}
,{"id":389870784722,"name":"Logging","type":"subsection","path":"/docs/reference/parameters/parameters-logging","breadcrumb":"Reference › Parameters › Logging","description":"","searchText":"reference parameters logging controls diagnostic logging behavior. use this page to find the logging settings, review their defaults, and open the detailed parameter pages. available parameters parameter technical name default value purpose ac log ac_log 0 add log info. 0 - no, 1 - yes. previous repository name nextac log"}
,{"id":388515715280,"name":"AC Log","type":"topic","path":"/docs/reference/parameters/parameters-logging/parameters-logging-ac-log","breadcrumb":"Reference › Parameters › Logging › AC Log","description":"","searchText":"reference parameters logging ac log overview ac log is a logging parameter that controls whether log info is added: 0 - no, 1 - yes. function use this setting to keep diagnostic logging consistent across the project. numeric values in this parameter act as choices; use the description to interpret each option. access the parameter is maintained from the parameters list in analyticscreator. how to access navigation tree parameters->list parameters toolbar options->parameter diagram not opened from the diagram. visual element parameter list default value 0 custom value not set. where it is used this parameter belongs to the logging group and is used when analyticscreator applies diagnostic logging. setting value technical parameter name ac_log default value 0 custom value not set. parameter groups group logging diagnostics log related topics logging parameters previous logging nextsemantic model"}
,{"id":389870784723,"name":"Semantic Model","type":"subsection","path":"/docs/reference/parameters/parameters-semantic-model","breadcrumb":"Reference › Parameters › Semantic Model","description":"","searchText":"reference parameters semantic model controls default semantic-model naming and display-folder behavior. use this page to find the semantic model settings, review their defaults, and open the detailed parameter pages. available parameters parameter technical name default value purpose attribute default display folder attribute_default_display_folder not set. default attribute display folder. measure default display folder measure_default_display_folder measures default measure display folder. measure default name measure_default_name {aggregationname} of {columnname} ({tablename}) default measure name pattern. tabular olap isavailableinmdx tabular_olap_isavailableinmdx 1 isavailableinmdx option for the tabular olap attributes. 0 - no, 1 - yes. previous ac log nextmeasure default display folder"}
,{"id":389870937313,"name":"Measure Default Display Folder","type":"topic","path":"/docs/reference/parameters/parameters-semantic-model/parameters-semantic-model-measure-default-display-folder","breadcrumb":"Reference › Parameters › Semantic Model › Measure Default Display Folder","description":"","searchText":"reference parameters semantic model measure default display folder overview measure default display folder is a semantic model parameter that controls the default measure display folder. function use this setting to keep semantic-model metadata consistent across the project. analyticscreator uses this value when no custom value is saved for the project. access the parameter is maintained from the parameters list in analyticscreator. how to access navigation tree parameters->list parameters toolbar options->parameter diagram not opened from the diagram. visual element parameter list default value measures custom value not set. where it is used this parameter belongs to the semantic model group and is used when analyticscreator applies semantic-model metadata. setting value technical parameter name measure_default_display_folder default value measures custom value not set. parameter groups group semantic model olap model olap related topics semantic model attribute default display folder measure default name parameters previous semantic model nextattribute default display folder"}
,{"id":389870937314,"name":"Attribute Default Display Folder","type":"topic","path":"/docs/reference/parameters/parameters-semantic-model/parameters-semantic-model-attribute-default-display-folder","breadcrumb":"Reference › Parameters › Semantic Model › Attribute Default Display Folder","description":"","searchText":"reference parameters semantic model attribute default display folder overview attribute default display folder is a semantic model parameter that controls the default attribute display folder. function use this setting to keep semantic-model metadata consistent across the project. analyticscreator uses this value when no custom value is saved for the project. access the parameter is maintained from the parameters list in analyticscreator. how to access navigation tree parameters->list parameters toolbar options->parameter diagram not opened from the diagram. visual element parameter list default value not set. custom value not set. where it is used this parameter belongs to the semantic model group and is used when analyticscreator applies semantic-model metadata. setting value technical parameter name attribute_default_display_folder default value not set. custom value not set. parameter groups group semantic model olap model olap related topics semantic model measure default display folder parameters previous measure default display folder nextmeasure default name"}
,{"id":389870937315,"name":"Measure Default Name","type":"topic","path":"/docs/reference/parameters/parameters-semantic-model/parameters-semantic-model-measure-default-name","breadcrumb":"Reference › Parameters › Semantic Model › Measure Default Name","description":"","searchText":"reference parameters semantic model measure default name overview measure default name is a semantic model parameter that controls the default measure name pattern. function use this setting to keep semantic-model metadata consistent across the project. analyticscreator uses this value when no custom value is saved for the project. keep placeholder names unchanged when adapting the pattern. this value supports placeholders such as {aggregationname}, {columnname}, {tablename}. access the parameter is maintained from the parameters list in analyticscreator. how to access navigation tree parameters->list parameters toolbar options->parameter diagram not opened from the diagram. visual element parameter list default value {aggregationname} of {columnname} ({tablename}) custom value not set. where it is used this parameter belongs to the semantic model group and is used when analyticscreator applies semantic-model metadata. setting value technical parameter name measure_default_name default value {aggregationname} of {columnname} ({tablename}) custom value not set. parameter groups group semantic model olap model olap related topics semantic model measure default display folder tabular olap isavailableinmdx parameters previous attribute default display folder nexttabular olap isavailableinmdx"}
,{"id":389870937316,"name":"Tabular OLAP Isavailableinmdx","type":"topic","path":"/docs/reference/parameters/parameters-semantic-model/parameters-semantic-model-tabular-olap-isavailableinmdx","breadcrumb":"Reference › Parameters › Semantic Model › Tabular OLAP Isavailableinmdx","description":"","searchText":"reference parameters semantic model tabular olap isavailableinmdx overview tabular olap isavailableinmdx is a semantic model parameter that controls the isavailableinmdx option for the tabular olap attributes. 0 - no, 1 - yes. function use this setting to keep semantic-model metadata consistent across the project. analyticscreator uses this value when no custom value is saved for the project. access the parameter is maintained from the parameters list in analyticscreator. how to access navigation tree parameters->list parameters toolbar options->parameter diagram not opened from the diagram. visual element parameter list default value 1 custom value not set. where it is used this parameter belongs to the semantic model group and is used when analyticscreator applies semantic-model metadata. setting value technical parameter name tabular_olap_isavailableinmdx default value 1 custom value not set. parameter groups group semantic model olap model olap related topics semantic model measure default name parameters previous measure default name nextsql templates"}
,{"id":389870784724,"name":"SQL Templates","type":"subsection","path":"/docs/reference/parameters/parameters-sql-templates","breadcrumb":"Reference › Parameters › SQL Templates","description":"","searchText":"reference parameters sql templates stores sql templates and variables used during generated sql execution. use this page to find the sql templates settings, review their defaults, and open the detailed parameter pages. available parameters parameter technical name default value purpose main dwh sqlcmd variable main_dwh_sqlcmd_variable $ sqlcmd variable used to address the main dwh database. will be used in case of multi-db dwh. update statistics hist template update_statistics_hist_template update statistics {tablename} pattern to create update statistics statement in historizing stored procedure. {tablename} can be used as an alias. update statistics persist template update_statistics_persist_template update statistics {tablename} pattern to create update statistics statement in persisting stored procedure. {tablename} can be used as an alias. previous tabular olap isavailableinmdx nextupdate statistics hist template"}
,{"id":389870937317,"name":"Update Statistics Hist Template","type":"topic","path":"/docs/reference/parameters/parameters-sql-templates/parameters-sql-templates-update-statistics-hist-template","breadcrumb":"Reference › Parameters › SQL Templates › Update Statistics Hist Template","description":"","searchText":"reference parameters sql templates update statistics hist template overview update statistics hist template is a sql templates parameter that controls the pattern used to create an update statistics statement in the historizing stored procedure. {tablename} can be used as an alias. function use this setting to keep generated sql execution consistent across the project. analyticscreator uses this value when no custom value is saved for the project. keep placeholder names unchanged when adapting the pattern. this value supports placeholders such as {tablename}. access the parameter is maintained from the parameters list in analyticscreator. how to access navigation tree parameters->list parameters toolbar options->parameter diagram not opened from the diagram. visual element parameter list default value update statistics {tablename} custom value not set. where it is used this parameter belongs to the sql templates group and is used when analyticscreator applies generated sql execution. setting value technical parameter name update_statistics_hist_template default value update statistics {tablename} custom value not set. parameter groups group sql templates sql variables sql related topics sql templates main dwh sqlcmd variable update statistics persist template parameters previous sql templates nextupdate statistics persist template"}
,{"id":389870937318,"name":"Update Statistics Persist Template","type":"topic","path":"/docs/reference/parameters/parameters-sql-templates/parameters-sql-templates-update-statistics-persist-template","breadcrumb":"Reference › Parameters › SQL Templates › Update Statistics Persist Template","description":"","searchText":"reference parameters sql templates update statistics persist template overview update statistics persist template is a sql templates parameter that controls the pattern used to create an update statistics statement in the persisting stored procedure. {tablename} can be used as an alias. function use this setting to keep generated sql execution consistent across the project. analyticscreator uses this value when no custom value is saved for the project. keep placeholder names unchanged when adapting the pattern. this value supports placeholders such as {tablename}. access the parameter is maintained from the parameters list in analyticscreator. how to access navigation tree parameters->list parameters toolbar options->parameter diagram not opened from the diagram. visual element parameter list default value update statistics {tablename} custom value not set. where it is used this parameter belongs to the sql templates group and is used when analyticscreator applies generated sql execution. setting value technical parameter name update_statistics_persist_template default value update statistics {tablename} custom value not set. parameter groups group sql templates sql variables sql related topics sql templates update statistics hist template parameters previous update statistics hist template nextmain dwh sqlcmd variable"}
,{"id":389870937319,"name":"Main DWH SQLCMD Variable","type":"topic","path":"/docs/reference/parameters/parameters-sql-templates/parameters-sql-templates-main-dwh-sqlcmd-variable","breadcrumb":"Reference › Parameters › SQL Templates › Main DWH SQLCMD Variable","description":"","searchText":"reference parameters sql templates main dwh sqlcmd variable overview main dwh sqlcmd variable is a sql templates parameter that controls the sqlcmd variable used to address the main dwh database. will be used in case of multi-db dwh. function use this setting to keep generated sql execution consistent across the project. analyticscreator uses this value when no custom value is saved for the project. access the parameter is maintained from the parameters list in analyticscreator. how to access navigation tree parameters->list parameters toolbar options->parameter diagram not opened from the diagram. visual element parameter list default value $ custom value not set. where it is used this parameter belongs to the sql templates group and is used when analyticscreator applies generated sql execution. setting value technical parameter name main_dwh_sqlcmd_variable default value $ custom value not set. parameter groups group sql templates sql variables sql related topics sql templates update statistics hist template parameters previous update statistics persist template nextsource import"}
,{"id":389870784725,"name":"Source Import","type":"subsection","path":"/docs/reference/parameters/parameters-source-import","breadcrumb":"Reference › Parameters › Source Import","description":"","searchText":"reference parameters source import controls source import query behavior. use this page to find the source import settings, review their defaults, and open the detailed parameter pages. available parameters parameter technical name default value purpose import sql server use no lock import_sqlserver_use_nolock 0 use nolock hint in import packages for sql server. 0 - no, 1 - yes. previous main dwh sqlcmd variable nextimport sql server use no lock"}
,{"id":389870937320,"name":"Import SQL Server Use No Lock","type":"topic","path":"/docs/reference/parameters/parameters-source-import/parameters-source-import-import-sql-server-use-no-lock","breadcrumb":"Reference › Parameters › Source Import › Import SQL Server Use No Lock","description":"","searchText":"reference parameters source import import sql server use no lock overview import sql server use no lock is a source import parameter that controls the use of the nolock hint in import packages for sql server. 0 - no, 1 - yes. function use this setting to keep source import sql behavior consistent across the project. analyticscreator uses this value when no custom value is saved for the project. access the parameter is maintained from the parameters list in analyticscreator. how to access navigation tree parameters->list parameters toolbar options->parameter diagram not opened from the diagram. visual element parameter list default value 0 custom value not set. where it is used this parameter belongs to the source import group and is used when analyticscreator applies source import sql behavior. setting value technical parameter name import_sqlserver_use_nolock default value 0 custom value not set. parameter groups group source import profiling import related topics source import parameters previous source import nextproject limits"}
,{"id":389870784726,"name":"Project Limits","type":"subsection","path":"/docs/reference/parameters/parameters-project-limits","breadcrumb":"Reference › Parameters › Project Limits","description":"","searchText":"reference parameters project limits controls project file-name and file-path restrictions. use this page to find the project limits settings, review their defaults, and open the detailed parameter pages. available parameters parameter technical name default value purpose project restrict file name length project_restrict_filename_length not set. if set, limits the maximum length of the file name to a specified number of characters. project restrict file path length project_restrict_filepath_length not set. if set, limits the maximum length of the full file name to a specified number of characters. previous import sql server use no lock nextproject restrict file path length"}
,{"id":388515715287,"name":"Project Restrict File Path Length","type":"topic","path":"/docs/reference/parameters/parameters-project-limits/parameters-project-limits-project-restrict-file-path-length","breadcrumb":"Reference › Parameters › Project Limits › Project Restrict File Path Length","description":"","searchText":"reference parameters project limits project restrict file path length overview project restrict file path length is a project limits parameter that, if set, limits the maximum length of the full file name to a specified number of characters. function use this setting to keep project file and path validation consistent across the project. analyticscreator uses this value when no custom value is saved for the project. access the parameter is maintained from the parameters list in analyticscreator. how to access navigation tree parameters->list parameters toolbar options->parameter diagram not opened from the diagram. visual element parameter list default value not set. custom value not set. where it is used this parameter belongs to the project limits group and is used when analyticscreator applies project file and path validation. setting value technical parameter name project_restrict_filepath_length default value not set. custom value not set. parameter groups group project limits file limits limits related topics project limits project restrict file name length parameters previous project limits nextproject restrict file name length"}
,{"id":389870937321,"name":"Project Restrict File Name Length","type":"topic","path":"/docs/reference/parameters/parameters-project-limits/parameters-project-limits-project-restrict-file-name-length","breadcrumb":"Reference › Parameters › Project Limits › Project Restrict File Name Length","description":"","searchText":"reference parameters project limits project restrict file name length overview project restrict file name length is a project limits parameter that, if set, limits the maximum length of the file name to a specified number of characters. function use this setting to keep project file and path validation consistent across the project. analyticscreator uses this value when no custom value is saved for the project. access the parameter is maintained from the parameters list in analyticscreator. how to access navigation tree parameters->list parameters toolbar options->parameter diagram not opened from the diagram. visual element parameter list default value not set. custom value not set. where it is used this parameter belongs to the project limits group and is used when analyticscreator applies project file and path validation. setting value technical parameter name project_restrict_filename_length default value not set. custom value not set. parameter groups group project limits file limits limits related topics project limits project restrict file path length parameters previous project restrict file path length nexttechnical configuration parameters"}
,{"id":387188914419,"name":"Technical configuration parameters","type":"subsection","path":"/docs/reference/parameters/parameters-technical-configuration-parameters","breadcrumb":"Reference › Parameters › Technical configuration parameters","description":"","searchText":"reference parameters technical configuration parameters highlights technical settings that also appear in functional parameter groups. use this page to find the technical configuration parameters settings, review their defaults, and open the detailed parameter pages. technical settings these technical settings are documented in their functional parameter groups. parameter technical name functional group default value ac log ac_log logging 0 deployment create subdirectory deployment_create_subdirectory deployment 1 diagram name pattern diagram_name_pattern naming & metadata {fullfriendlynamecr} dwh metadata in extended properties dwh_metadata_in_extended_properties deployment 1 hist proc use hash join hist_proc_use_hash_join historization 1 oledb provider sql server oledbprovider_sqlserver connectors msoledbsql pers default part switch pers_default_partswitch historization 2 project restrict file path length project_restrict_filepath_length project limits not set. table compression type table_compression_type deployment 1 previous project restrict file name length nextother parameters"}
,{"id":383509340376,"name":"Other parameters","type":"subsection","path":"/docs/reference/parameters/parameters-other-parameters","breadcrumb":"Reference › Parameters › Other parameters","description":"","searchText":"reference parameters other parameters reserved for parameters that do not have a more specific functional group. use this page to find the other parameters settings, review their defaults, and open the detailed parameter pages. available parameters no additional settings are currently listed for this group. previous technical configuration parameters"}
,
{"id":383461199045,"name":"Tutorials","type":"category","path":"/docs/tutorials","breadcrumb":"Tutorials","description":"","searchText":"tutorials this section contains guided walkthroughs based on sample datasets and example scenarios. tutorials are intended to help you become familiar with analyticscreator by following complete modeling, generation, deployment, and execution flows in a controlled environment. use these tutorials to understand how metadata is translated into warehouse structures, pipelines, and analytical models across different platforms and source scenarios. available tutorials northwind data warehouse guided walkthrough based on the northwind dataset. source import and modeling transformations and data marts end-to-end warehouse flow open northwind dwh walkthrough coming soon sql server data warehouse walkthrough end-to-end tutorial for building a sql server-based warehouse. repository and connector setup wizard-generated model execution with sql server and ssis coming soon microsoft fabric walkthrough tutorial for generating and deploying a warehouse model to microsoft fabric. fabric target setup pipeline generation semantic model integration coming soon sap to data warehouse walkthrough tutorial for importing sap metadata and generating a layered warehouse model. sap metadata import persistent staging dimensional or hybrid modeling how to use this section tutorials are intended as practical implementation guides. they are most useful when followed in a test environment together with the quick start guide and the related reference pages. start with northwind if you are new to analyticscreator use platform-specific tutorials to understand deployment patterns use source-specific tutorials to understand metadata import and modeling behavior common principles across tutorials practical walkthroughs each tutorial focuses on a complete implementation flow rather than isolated features. sample datasets tutorials use controlled example data so that modeling and generation steps can be reproduced. end-to-end flow tutorials typically cover metadata import, model generation, deployment, and execution. reference alignment tutorial steps should be used together with technical reference pages for deeper detail. key takeaway tutorials provide guided, reproducible examples that show how analyticscreator is used in practice across datasets, platforms, and source scenarios."}
,{"id":383225948382,"name":"Northwind DWH Walkthrough","type":"section","path":"/docs/tutorials/northwind-dwh-walkthrough","breadcrumb":"Tutorials › Northwind DWH Walkthrough","description":"","searchText":"tutorials northwind dwh walkthrough step-by-step: sql server northwind project create your first data warehouse with analyticscreator analyticscreator offers pre-configured demos for testing within your environment. this guide outlines the steps to transition from the northwind oltp database to the northwind data warehouse model. once completed, you will have a fully generated dwh project ready to run locally. load the demo project from the file menu, select load from cloud. choose nw_demo enter a name for your new repository (default: nw_demo) note: this repository contains metadata onlyâno data is moved. analyticscreator will automatically generate all required project parameters. project structure: the 5-layer model analyticscreator will generate a data warehouse project with five layers: sources â raw data from the source system (northwind oltp). staging layer â temporary storage for data cleansing and preparation. persisted staging layer â permanent storage of cleaned data for historization. core layer â integrated business modelâstructured and optimized for querying. datamart layer â optimized for reportingâorganized by business topic (e.g., sales, inventory). northwind setup (if not already installed) step 1: check if the northwind database exists open sql server management studio (ssms) and verify that the northwind database is present. if yes, skip to the next section. if not, proceed to step 2. step 2: create the northwind database run the setup script from microsoft: đľ download script or copy-paste it into ssms and execute. step 3: verify database use northwind; go select * from information_schema.tables where table_schema = 'dbo' and table_type = 'base table'; once confirmed, you can proceed with the next steps to configure the analyticscreator connector with your northwind database. note: analyticscreator uses only native microsoft connectors, and we do not store any personal information. step 4: change database connector navigate to sources > connectors. you will notice that a connector is already configured. for educational purposes, the connection string is not encrypted yet. to edit or add a new connection string, go to options > encrypted strings > add. paste your connection string as demonstrated in the video below. after adding the new connection string, it's time to test your connection. go to sources â connectors and press the test button to verify your connection. step 5: create a new deployment in this step, you'll configure and deploy your project to the desired destination. please note that only the metadata will be deployed; there will be no data movement or copy during this process. navigate to deployments in the menu and create a new deployment. assign a name to your deployment. configure the connection for the destination set the project path where the deployment will be saved. select the packages you want to generate. review the connection variables and click deploy to initiate the process. finally, click deploy to complete the deployment. in this step, your initial data warehouse project is created. note that only the metadataâthe structure of your projectâis generated at this stage. you can choose between two options for package generation: ssis (sql server integration services) adf (azure data factory) ssis follows a traditional etl tool architecture, making it a suitable choice for on-premises data warehouse architectures. in contrast, adf is designed with a modern cloud-native architecture, enabling seamless integration with various cloud services and big data systems. this architectural distinction makes adf a better fit for evolving data integration needs in cloud-based environments. to execute your package and move your data, you will still need an integration runtime (ir). keep in mind that analyticscreator only generates the project at the metadata level and does not access your data outside the analyticscreator interface. it does not link your data to us, ensuring that your data remains secure in its original location. for testing purposes, you can run your package in microsoft visual studio 2022, on your local sql server, or even in azure data factory."}
,
{"id":383461199046,"name":"Platform Support","type":"category","path":"/docs/platform-support","breadcrumb":"Platform Support","description":"","searchText":"platform support this section describes how analyticscreator integrates with supported target platforms and what it generates for each environment. analyticscreator is a metadata-driven design application that generates sql-based data warehouse structures, orchestration artifacts, and semantic models. the generated assets are then deployed and executed on the selected target platform. supported platforms microsoft fabric support for fabric data warehouse, lakehouse sql endpoints, onelake, pipelines, and integrated semantic models. warehouse and lakehouse targets pipeline generation semantic model integration view platform details microsoft azure / data factory support for azure data factory orchestration together with azure sql and synapse-based warehouse execution. adf pipeline generation azure sql and synapse targets cloud orchestration view platform details sql server support for sql server-based repositories, warehouse generation, and ssis-based execution. on-premise warehouse targets sql and stored procedure generation ssis orchestration view platform details power bi support for semantic model generation including measures, relationships, and analytical structures. tabular models measures and relationships reporting layer view platform details how to use this section each platform page explains how analyticscreator maps metadata definitions to platform-specific implementations. supported services and runtimes generated sql, pipelines, and semantic models deployment and execution behavior platform-specific constraints and design considerations common principles across platforms metadata-driven generation all structures and logic are generated from metadata definitions. platform-side execution processing and orchestration run on the target platform. consistent modeling approach dimensional, data vault, and hybrid models are supported across platforms. generated deployment assets sql objects, pipelines, and semantic models are generated automatically. key differences between platforms orchestration: ssis vs data factory vs fabric pipelines execution environment: on-premise vs cloud vs unified platform storage model: database vs lakehouse vs onelake integration with semantic layers key takeaway analyticscreator generates platform-specific warehouse, pipeline, and analytical artifacts from metadata, while execution and runtime behavior are handled by the selected platform."}
,{"id":383225948376,"name":"Microsoft Fabric","type":"section","path":"/docs/platform-support/microsoft-fabric","breadcrumb":"Platform Support › Microsoft Fabric","description":"","searchText":"platform support microsoft fabric this page describes how analyticscreator generates and integrates data warehouse and analytical solutions for microsoft fabric environments. overview analyticscreator supports microsoft fabric as a target platform for data warehouse generation, orchestration, and analytical modeling. it generates sql-based structures, pipelines, and semantic models that run within fabric services. analyticscreator itself does not execute workloads inside fabric. it generates artifacts that are deployed and executed within fabric components such as sql endpoints, pipelines, and semantic models. supported services and components fabric data warehouse (sql endpoint) fabric lakehouse (sql analytics endpoint) onelake storage fabric data pipelines power bi semantic models (fabric-integrated) what analyticscreator generates for microsoft fabric, analyticscreator generates: sql objects: stg tables (import layer) persistent staging and historization tables core transformations (views or tables) dm layer (facts and dimensions) stored procedures for: data loading historization persisting logic fabric pipelines: orchestration of load and transformation steps dependency-based execution semantic models: dimensions and measures relationships between entities supported modeling approaches dimensional modeling (facts and dimensions) data vault modeling (hubs, links, satellites) hybrid approaches (data vault foundation with dimensional output) historized models (scd2 with valid-from and valid-to) both warehouse and lakehouse-style architectures can be implemented depending on the selected fabric components. deployment and execution model analyticscreator separates generation, deployment, and execution: analyticscreator generates sql objects, pipelines, and semantic models deployment publishes these artifacts into microsoft fabric execution is performed by fabric services (pipelines and sql engine) data processing runs inside fabric: sql transformations run on fabric sql endpoints pipelines orchestrate execution using fabric pipeline services data is stored in onelake ci/cd and version control metadata is stored in the analyticscreator repository projects can be versioned via json export (acrepo) deployment artifacts can be integrated into ci/cd pipelines fabric environments can be targeted via deployment configurations connectors, sources, and exports supported sources sap systems sql server and relational databases other supported connectors exports and targets fabric sql endpoints lakehouse tables semantic models for power bi prerequisites, limitations, and notes fabric workspace and permissions must be configured linked services or connections must be defined for pipelines sql compatibility depends on fabric sql endpoint capabilities performance depends on data volume, partitioning, and load strategy design considerations: choose between data warehouse and lakehouse based on workload use persistent staging to avoid repeated source reads validate generated joins and transformations for performance example use cases building a fabric-native data warehouse with automated sql generation implementing data vault models on top of onelake storage generating power bi-ready semantic models from warehouse structures replacing manual pipeline development with generated fabric pipelines platform-specific notes fabric unifies storage and compute, which simplifies deployment compared to separate azure services lakehouse and warehouse approaches can coexist in the same environment semantic models are tightly integrated with power bi related content quick start guide understanding analyticscreator fabric tutorials and examples key takeaway analyticscreator generates sql structures, pipelines, and semantic models for microsoft fabric, while execution and storage are handled by fabric services such as sql endpoints, pipelines, and onelake."}
,{"id":383225948377,"name":"Azure","type":"section","path":"/docs/platform-support/azure","breadcrumb":"Platform Support › Azure","description":"","searchText":"platform support azure this page describes how analyticscreator generates and integrates data warehouse solutions in microsoft azure environments, with a focus on azure data factory for orchestration and sql-based engines for processing. overview analyticscreator supports microsoft azure as a target environment by generating sql-based data warehouse structures, orchestration pipelines, and analytical models. azure data factory is used for workflow orchestration, while sql-based engines handle data processing and storage. analyticscreator generates all required artifacts, but execution is performed by azure services such as data factory and sql engines. supported services and components azure data factory (orchestration) azure sql database azure sql managed instance azure synapse analytics (sql pools) azure storage (as data source or staging area) power bi (analytical layer) what analyticscreator generates for azure environments, analyticscreator generates: sql objects: stg tables (import layer) persistent staging and historization tables core transformations (views or persisted tables) dm layer (facts and dimensions) stored procedures for: data loading historization persisting logic azure data factory pipelines: execution orchestration dependency handling integration with linked services semantic models for reporting tools such as power bi supported modeling approaches dimensional modeling (facts and dimensions) data vault modeling (hubs, links, satellites) hybrid approaches historized models (scd2 with valid-from and valid-to) modeling behavior is independent of azure and is defined in metadata. azure determines where and how generated logic is executed. deployment and execution model analyticscreator separates generation, deployment, and execution: analyticscreator generates sql objects and pipeline definitions deployment publishes these artifacts to azure services execution is handled by azure data factory and sql engines typical execution flow: azure data factory triggers pipelines data is extracted from sources data is written to stg tables stored procedures execute transformations and historization core and dm layers are updated ci/cd and version control metadata is stored in the analyticscreator repository projects can be versioned via json export (acrepo) generated artifacts can be integrated into azure devops pipelines deployment configurations support multiple environments connectors, sources, and exports supported sources sap systems sql server and azure sql flat files and external storage via data factory exports and targets azure sql database azure synapse sql pools power bi semantic models prerequisites, limitations, and notes azure subscription and resource group required data factory instance must be configured linked services must be defined for source systems sql compatibility depends on target engine (azure sql vs synapse) design considerations: azure environments are modular and require explicit configuration orchestration and storage are separated services performance depends on selected sql engine and scaling configuration example use cases building a cloud-based data warehouse using azure sql database using azure data factory to orchestrate etl pipelines implementing data vault models in azure synapse automating pipeline generation instead of manual adf development platform-specific notes azure separates orchestration (data factory) from compute (sql engines) pipeline configuration requires linked services and integration runtimes multiple sql engines can be used depending on workload requirements related content quick start guide understanding analyticscreator azure tutorials and examples key takeaway analyticscreator generates sql structures and azure data factory pipelines, while execution is handled by azure services such as data factory and sql-based compute engines."}
,{"id":383225948378,"name":"SQL Server","type":"section","path":"/docs/platform-support/sql-server","breadcrumb":"Platform Support › SQL Server","description":"","searchText":"platform support sql server this page describes how analyticscreator generates and integrates data warehouse solutions for microsoft sql server environments. overview analyticscreator supports sql server as both the metadata repository platform and a primary target platform for generated data warehouse structures. in a typical sql server-based setup, analyticscreator generates database objects, loading procedures, ssis packages, and analytical structures that run on sql server and related microsoft services. analyticscreator itself is a design-time application. it generates sql-based artifacts, but execution takes place in sql server, sql server integration services, and downstream analytical services. supported services and components sql server database engine sql server integration services (ssis) sql server analysis services, where used for tabular or analytical models power bi as a downstream semantic and reporting target sql server-based repository for metadata storage what analyticscreator generates for sql server environments, analyticscreator generates: sql objects: stg tables for source import persistent staging and historization tables core transformations as views or persisted tables dm layer structures with facts and dimensions stored procedures for: data loading historization persisting logic customizable processing steps ssis packages for: source import workflow execution etl orchestration analytical outputs: data marts tabular or semantic model structures where configured power bi-ready dimensional outputs deployment assets: deployment packages visual studio solution content generated sql deployment artifacts supported modeling approaches dimensional modeling with facts and dimensions data vault modeling with hubs, links, and satellites hybrid approaches combining data vault foundations with dimensional output historized models using valid-from and valid-to logic snapshot-based historization patterns in sql server-based models, analyticscreator can generate a layered flow from source to staging, persistent staging, core, data mart, and presentation-oriented outputs. deployment and execution model analyticscreator separates structure generation, deployment, and execution: analyticscreator stores metadata in the repository and generates sql server artifacts from that metadata synchronization materializes the modeled structure in a sql server database deployment creates the required database assets and related execution packages execution is performed by sql server and ssis, not by analyticscreator itself typical sql server execution flow: metadata is stored in the sql server repository the wizard generates a draft model synchronization materializes the model as sql server objects deployment creates sql server database content and ssis packages ssis packages are executed to load and process data ci/cd and version control repository metadata is stored in sql server projects can be exported for versioning and deployment control generated deployment packages can be used in development, test, and production processes visual studio-based deployment assets support controlled release workflows connectors, sources, and exports relevant source types sql server source systems sap sources with sql server as target platform files and other supported source connectors relevant exports and downstream targets sql server data warehouse databases ssis execution packages analysis services or power bi-oriented semantic outputs prerequisites, limitations, and notes a sql server instance is required for the repository a target sql server database is required for generated warehouse objects ssis is required when package-based orchestration is used performance depends on indexing, load strategy, and transformation complexity generated sql should still be reviewed where platform-specific tuning is required design considerations: persistent staging should be used deliberately to support reprocessing and historization persisting can improve performance for complex transformations by materializing view output into tables historization strategy affects both storage volume and processing behavior example use cases building an on-premise sql server data warehouse with ssis-based loading modernizing an existing sql server warehouse into a metadata-driven model generating dimensional marts and semantic outputs for power bi implementing data vault or hybrid architectures on sql server platform-specific faq does analyticscreator execute etl inside sql server? analyticscreator generates sql objects and procedures for sql server, but workflow execution is typically handled through generated ssis packages or other generated orchestration assets. does synchronization load business data? no. synchronization materializes the structure in sql server. data loading happens later during execution. can sql server be both source and target? yes. sql server can be used as a source system, as the repository platform, and as the target warehouse platform. can i use power bi with a sql server-based model? yes. analyticscreator can generate dimensional and semantic outputs that are intended for downstream use in power bi. proof assets demo transcripts show the repository stored in sql server, synchronization creating a new sql server database, and deployment producing ssis packages and sql-based structures demo transcripts also show generated historization procedures, view-based transformations, persisting procedures, and data mart outputs for analytical consumption related content quick start guide understanding analyticscreator sql server tutorials and examples historization reference persisting reference commercial solution page for product-level positioning and commercial overview, see the analyticscreator sql server solution page. key takeaway in sql server environments, analyticscreator generates the warehouse schema, loading procedures, ssis assets, and analytical structures, while sql server and related microsoft services execute and host the resulting solution."}
,{"id":383225948379,"name":"Power BI","type":"section","path":"/docs/platform-support/power-bi","breadcrumb":"Platform Support › Power BI","description":"","searchText":"platform support power bi this page describes how analyticscreator generates and integrates analytical models for power bi. overview analyticscreator supports power bi as a target for analytical consumption by generating semantic models based on the data warehouse structure. these models define dimensions, measures, and relationships that can be used directly in reporting. analyticscreator does not execute data processing inside power bi. instead, it generates semantic structures that are consumed by power bi after data has been processed in the underlying data warehouse platform. supported services and components power bi semantic models (tabular models) power bi datasets power bi desktop and power bi service directquery and import modes what analyticscreator generates for power bi, analyticscreator generates: semantic models: dimensions and facts mapped from dm layer relationships between entities measures and calculated fields model structure: hierarchies (e.g. date hierarchies) attribute groupings metadata descriptions deployment-ready artifacts: tabular model definitions integration with deployment workflows supported modeling approaches dimensional modeling (star schema) measures derived from fact tables hierarchical dimensions (e.g. time, geography) data vault models are not directly exposed to power bi. instead, dimensional structures are generated from core layers and used as the basis for semantic models. deployment and execution model analyticscreator separates semantic model generation from data processing: analyticscreator generates the semantic model definition the model is deployed to power bi or an analytical engine data processing happens in the underlying data warehouse power bi consumes the processed data through the semantic model execution flow: data is processed in stg, core, and dm layers semantic model references dm structures power bi queries the model or underlying data source ci/cd and version control semantic models are generated from metadata definitions model definitions can be included in deployment pipelines integration with version-controlled analyticscreator projects connectors, sources, and exports data sources for power bi sql server azure sql microsoft fabric other supported warehouse targets export targets power bi semantic models tabular model deployments prerequisites, limitations, and notes power bi requires access to the deployed data warehouse model performance depends on underlying data model design directquery performance depends on source system performance design considerations: use dm layer as the source for semantic models avoid exposing stg or core layers directly ensure measures are defined consistently example use cases generating a power bi-ready star schema from a data warehouse automating creation of measures and relationships standardizing reporting models across projects reducing manual modeling effort in power bi platform-specific faq does analyticscreator replace power bi modeling? analyticscreator generates the base semantic model, including dimensions, relationships, and measures. additional report-specific logic can still be implemented in power bi if required. where are measures defined? measures can be generated as part of the semantic model based on metadata definitions and can be extended in power bi. can power bi connect directly to core or stg? this is technically possible but not recommended. the dm layer should be used as the primary source for reporting. proof assets generated semantic models include dimensions, measures, and relationships based on metadata demo scenarios show end-to-end flow from source to power bi-ready model related content quick start guide understanding analyticscreator data mart modeling semantic model reference commercial solution page for product-level positioning and overview, see the analyticscreator power bi solution page. key takeaway analyticscreator generates semantic models for power bi based on data warehouse structures, while data processing remains in the underlying platform."}
]