
Change interface appearance and colors
Introduction
Use Interface settings to adjust the diagram, navigation tree, pages, and colors for readable day-to-day work. You can start from a predefined profile and then customize it.
Screenshot examples: names, selected rows, paths, dates, and values in the images illustrate the interface. Use the objects and settings required by your own Data Warehouse project. Exact control names and functional choices in the steps still apply.
Applicability
Applies to the AnalyticsCreator desktop interface. This guide does not cover sharing or synchronizing appearance settings between users or computers.
If your controls differ, confirm the workflow for your installed version before proceeding.
Prerequisites
- Access to the AnalyticsCreator desktop interface.
- A note or screenshot of existing values if you want to be able to restore a custom appearance.
Steps
Open Options
Click Options.
Open Options. Screenshot values are examples. 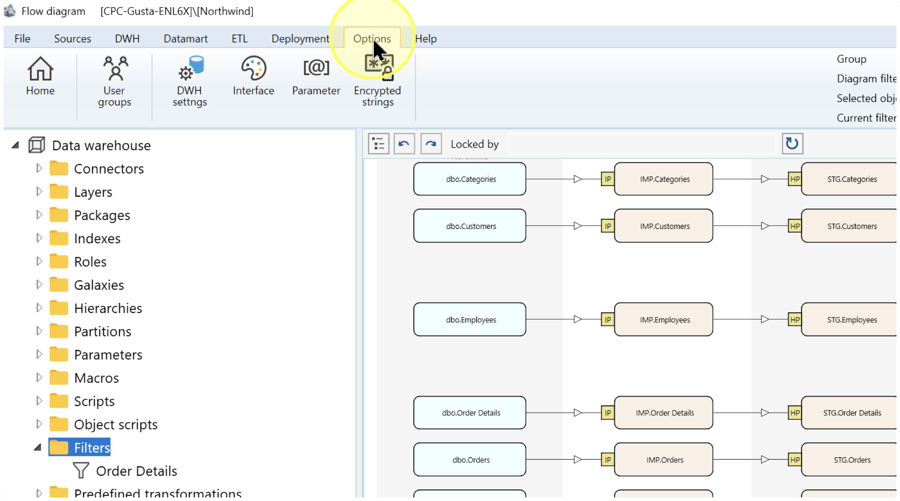
Open Interface settings
Click Interface.
Open Interface settings. Screenshot values are examples. 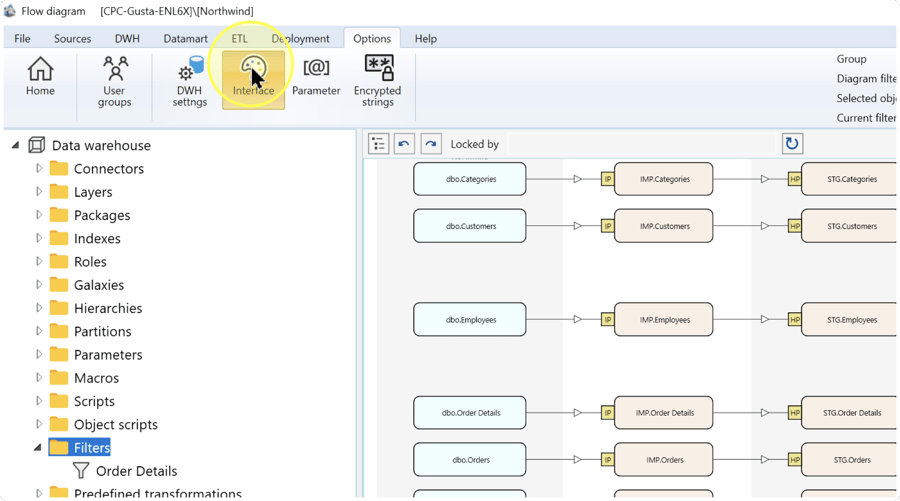
Review the setting categories
Use the Colors, Diagram, Navigation tree, and Pages tabs to find the settings to change. On Diagram, adjust the relevant font, dimensions, scale, and line appearance rather than reproducing the pictured numbers.
- Colors — Appearance settings for interface colors.
- Diagram — Settings such as font size, cell/box dimensions, arrow dimensions, border thickness, scale, and connector-line opacity.
- Navigation tree — Appearance settings for the tree.
- Pages — Appearance/layout settings for detail and list pages.
Review the setting categories. Screenshot values are examples. 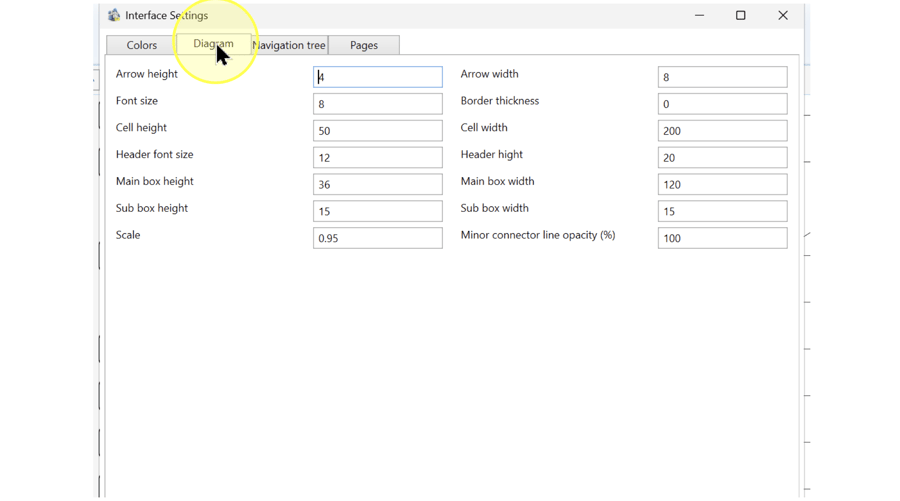
Choose a profile if desired, then customize
To start from a predefined profile, choose Default 1, Default 2, or Default 3. Review the resulting values and make any custom adjustments after selecting the profile, so the profile does not replace those changes.
Choose a profile if desired, then customize. Screenshot values are examples. 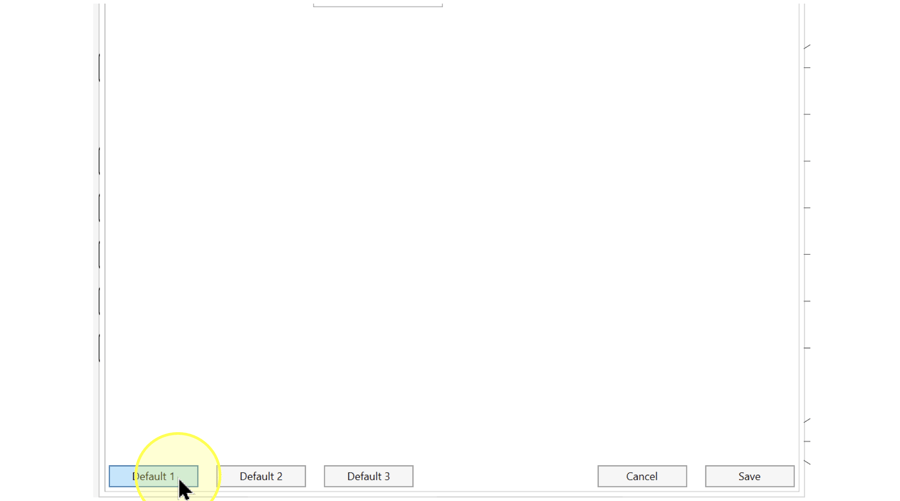
Save the appearance settings
Click Save. Return to the diagram and representative editor pages to check readability.
Save the appearance settings. Screenshot values are examples. 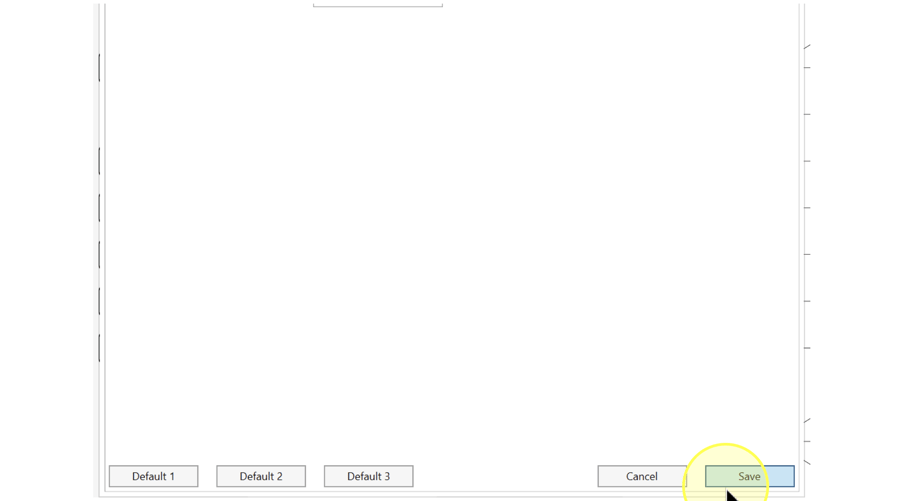
Verify the result
- The intended diagram, tree, or page appearance is visible.
- Text, connectors, and selected objects remain distinguishable at the chosen size and colors.
- Reopen Interface settings and confirm the retained values.
Decisions and variations
Use profiles as starting points. Keep text and selection states distinguishable; a screenshot’s scale or color choice is not a requirement for another display.
Troubleshooting
- Expected item is missing — Check the current Data Warehouse project and the selected list or navigation branch. Clear unintended search criteria.
- A change is not retained — Reopen the same definition and compare the saved fields. Resolve any validation or permission message before repeating Save.
