
Define a Tabular OLAP DAX calculated column
Introduction
Define a calculated column for a tabular analytical model by entering a DAX expression in an analytical table's Tabular OLAP DAX columns tab. The expression calculates a value for each row, such as a label derived from a numeric amount. Configure the column's analytical visibility, default aggregation rule, and display settings, then save the definition.
The outcome of this task is a saved calculated-column definition in your Data Warehouse (DWH) project. Saving the definition is not evidence that the analytical model has been generated, deployed, or processed.
Screenshot examples: schema names, table names, expressions, and selected settings illustrate the interface. Use the objects and settings required by your own project; you do not need to reproduce the pictured configuration.
Applicability
Use this workflow for a row-level DAX calculation on an analytical table in a tabular model. It does not define a measure or a database computed column. Those tasks use different tabs and calculation contexts; see Add or update definitions.
The navigation shown uses Datamart layer. Follow this guide when your table editor includes Tabular OLAP DAX columns. If that tab is absent, confirm that the selected object and model support this workflow before continuing.
Prerequisites
3.1. An open AnalyticsCreator Data Warehouse (DWH) project containing the analytical table you intend to edit, with its schema and table name known.
3.2. The input columns required by your calculation, available in the intended analytical table or model. The example in Enter the calculated-column definition requires a numeric SalesAmount column; that column is not required for other expressions.
3.3. A defined business calculation, a meaningful output name, and the intended output type, such as text or a number. Know whether the column should be transferred to the analytical model and how its values should be summarized.
Steps
Expand Layers
In the left navigation tree, expand Layers. Confirm that you are working in the intended Data Warehouse (DWH) project.
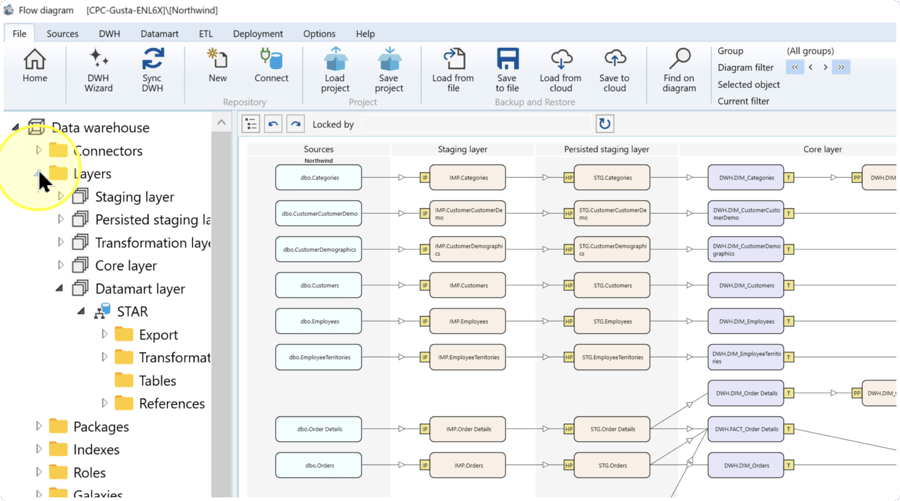
Expand the analytical schema
Expand Datamart layer, then expand the schema containing your analytical table. A schema groups tables; the Datamart contains analytical dimensions, facts, and related structures. STAR is the pictured schema name, not a required name for your project.
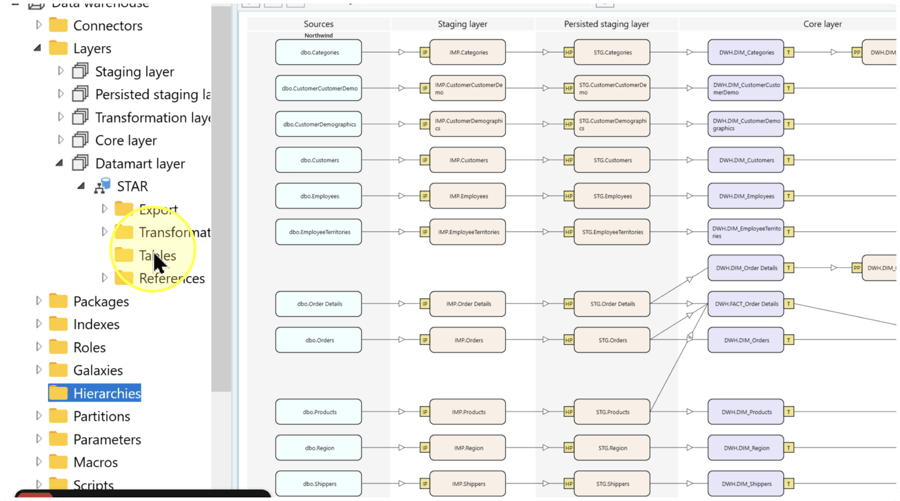
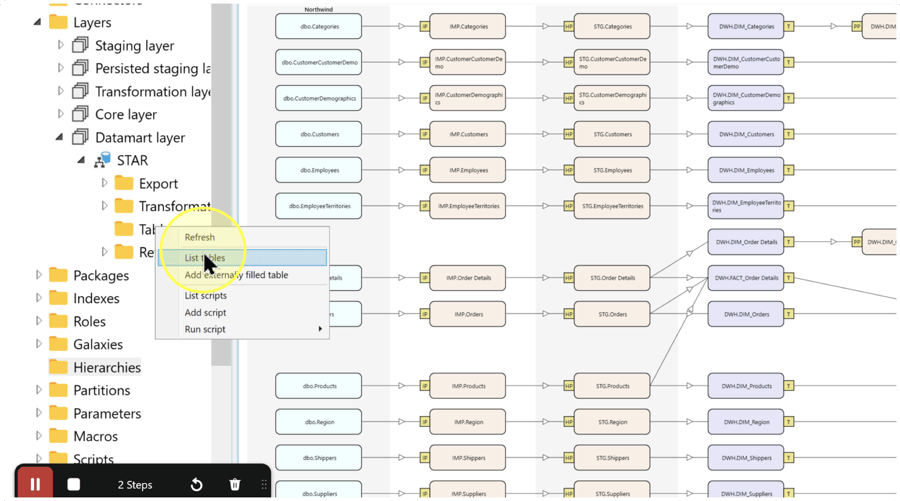
List the tables
Right-click Tables under the intended schema and select List tables from the context menu.
Expected Results: the Tables list opens so that you can identify the table to edit.
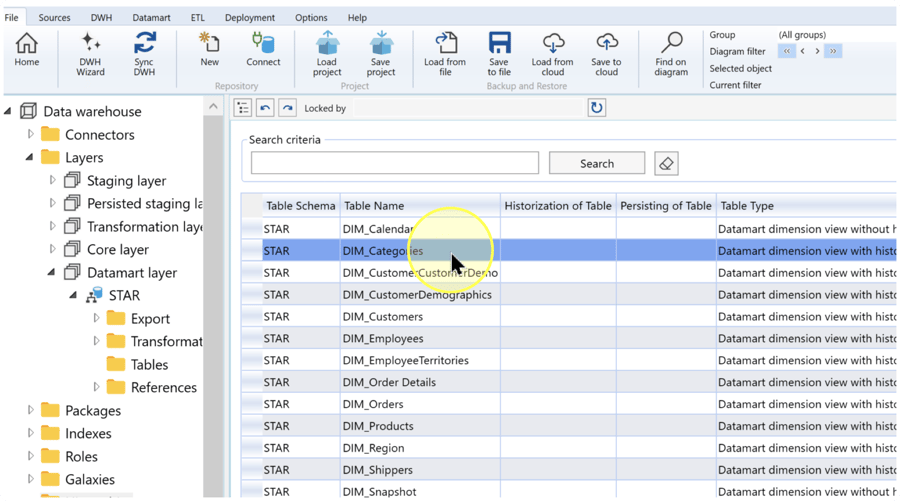
Open the intended analytical table
In the Tables list, identify your table by the Table Schema and Table Name columns. Check Table Type to confirm that it is the intended analytical object, then double-click its row to open the table editor.
The selected STAR.DIM_Categories row is an example. Its selection does not establish that it contains the SalesAmount input used later; choose a table that contains the inputs for your own calculation.
Open Tabular OLAP DAX columns
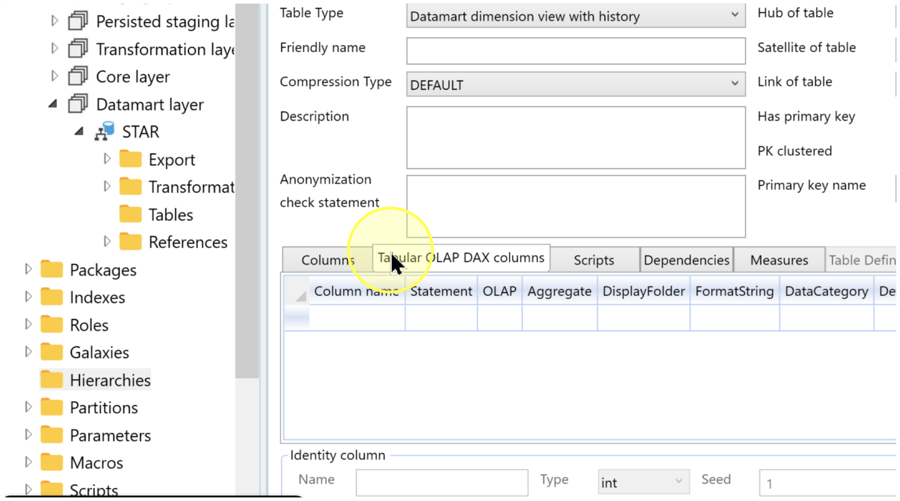
In the table editor, click the Tabular OLAP DAX columns tab.
Expected Results: the calculated-column grid is displayed. The next step defines the calculation in this grid, not in the Measures tab or the database Calculated columns tab.
Enter the calculated-column definition
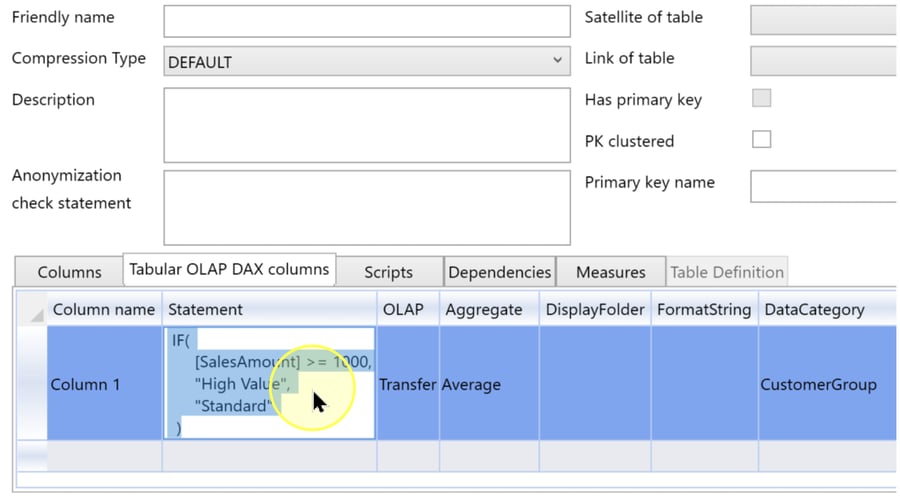
For a new calculated column, enter its definition in the blank row of the Tabular OLAP DAX columns grid. To change an existing calculated column, locate its row by Column name and edit that row. Each row holds a column definition; use the settings in the following order.
- Column name — Enter a meaningful name for the calculated output.
Column 1is the screenshot's example name, not a naming requirement. - Statement — Enter the complete DAX expression that calculates a value for each row. DAX is the expression language used for this tabular calculation. Reference actual input columns and check that the expression returns the intended type of value. For the example below,
[SalesAmount]refers to the current row's SalesAmount value. - OLAP — Set the column's transfer and visibility choice for the analytical model. For a column that you intend to transfer, select Transfer, as illustrated. This setting does not specify the database data type, and selecting it does not execute a transfer.
- Aggregate — Select the default aggregation rule according to the meaning and type of the calculated values. Average represents a numeric mean: use it only for numeric output that should be averaged. It is not an instruction to average text labels and does not replace the row-level calculation in Statement.
- DisplayFolder / FormatString / DataCategory — Configure these display settings only when the output requires them:
DisplayFolder groups the column in an analytical display folder. Enter the folder name required for that organization; otherwise leave it blank.
FormatString specifies how values are displayed. If the output needs a particular numeric or date format, enter a format string supported by your target model; otherwise leave it blank. A display format does not change the calculation.
DataCategory describes the column's semantic category. Enter a category only when it is supported by the target model and matches the output's meaning; otherwise leave it blank. The pictured
CustomerGroupvalue is not a required category. - Description — In the grid's Description field, enter a concise explanation of the calculated output and its business rule. This describes the column, not the table-level Description field above the tabs.
Calculation example: if the intended table contains a numeric SalesAmount column and you want to label rows by a threshold, enter the following expression in Statement:
IF(
    [SalesAmount] >= 1000,
    "High Value",
    "Standard"
)
This expression returns High Value for an amount of 1000 or more and Standard for an amount below 1000. The threshold and labels are examples, not product defaults. If your calculation uses other inputs or business rules, enter your own complete expression instead.
Screenshot difference: the capture combines this text-returning expression with Aggregate set to Average. Do not copy that combination for the text example. The image shows where to enter the settings; its selected values are not instructions for this text output.
Check before saving: confirm the input columns exist, the expression is complete, and the aggregation and display settings match the intended output. Do not change unrelated table settings to match the screenshot.
Review and save the definitions
If this table needs additional calculated columns, repeat Enter the calculated-column definition for each new row. If it needs only one, continue with that definition.
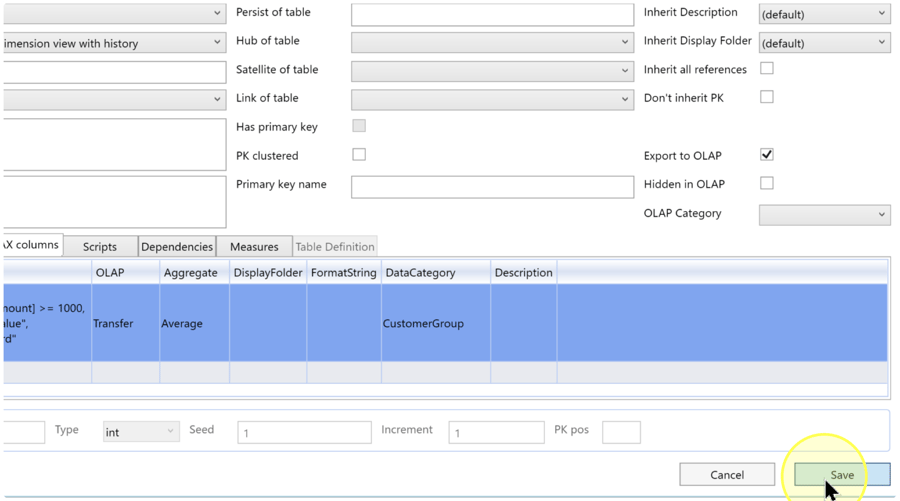
Review the column names, complete expressions, and analytical settings for all rows you added or changed. Then click Save at the bottom of the table editor.
Expected Results: the table definition, including the calculated-column definitions, is saved. Verify the saved values in Expected Results; this action does not demonstrate model deployment, processing, or calculated data values.
Expected Results
5.1. Reopen the same analytical table through the Tables list and click Tabular OLAP DAX columns, as described in List the tables. Confirm that each intended calculated column is present by its saved Column name.
5.2. Compare the saved Statement, OLAP, Aggregate, DisplayFolder, FormatString, DataCategory, and Description settings with the intended definition. Confirm that unrelated definitions remain as intended.
5.3. Treat persistence of the intended definition as completion of this how-to. It does not verify runtime values. After the model has been generated, deployed, and processed through your separate model workflow, check representative rows and the column's visibility, display settings, and aggregation behavior. For the example expression, test numeric amounts below, at, and above 1000; the expected labels are Standard, High Value, and High Value, respectively.
Decisions and variations
Choose the calculation context
Use Tabular OLAP DAX columns for a row-level DAX column in a tabular analytical model. Use Measures for analytical measures, or Calculated columns for database computed columns. An expression written for one context must not be moved unchanged to another without checking its syntax and inputs. The corresponding how-to pages are linked in Related Guides.
Match the settings to the output
Choose the aggregation rule when defining the expression in Enter the calculated-column definition, not merely because it appears in an image. Numeric output may require an aggregation such as Average when a mean is meaningful; the example's text labels cannot be averaged. Folder, format, and category settings describe how the output is organized or displayed and do not supply missing expression logic.
Add or update definitions
Use a new grid row for each additional calculated column. To revise a saved definition, edit the row identified by its Column name, save it, and compare the reopened values as described in Expected Results.
Troubleshooting
- Required object is missing — Check the Data Warehouse (DWH) project and schema, then compare the Table Schema, Table Name, and Table Type columns in the Tables list. If Search criteria contains an unintended restriction, remove that text and click Search before checking the list again. Do not substitute a pictured table that lacks your expression's inputs.
- Save is unavailable or fails — If AnalyticsCreator displays a validation message, use it to identify the setting that needs attention. Check the Column name and complete Statement in each row you changed, correct the identified issue, and retry Save. If the cause remains unclear, retain the message and ask your project support contact to investigate; do not assume the definition was saved.
- Saved definition differs from the intended result — Reopen the same table and compare its saved calculated-column settings with the intended design. Correct a differing definition and save it again. If the definition is correct but analytical results differ, check the input values and expression in the target model and verify that your separate deployment and processing workflow has included the change. Average must not be used to average the text labels in the example.
