
Create and configure an OLAP hierarchy
Introduction
A hierarchy organizes analytical attributes into a logical sequence of levels, allowing readers of an analytical model to navigate from broader groups to more detailed values. Use this how-to to create an OLAP hierarchy for an existing table, configure its level columns, sequence, and names, and save the definition in your Data Warehouse (DWH) project.
The intended outcome is a saved hierarchy definition whose table and levels match your design. Generating and processing the analytical model are separate tasks.
Applicability
This workflow applies to hierarchy definitions for tabular or multidimensional analytical models. It uses the desktop Datamart tab, the Hierarchies list, and the hierarchy editor.
The illustrated schema, table, hierarchy name, and column selections are examples. Select the objects and enter the values required by your own Data Warehouse (DWH) project.
Prerequisites
3.1. An open Data Warehouse (DWH) project containing the analytical table you intend to use.
3.2. The table's schema and the existing columns required for the hierarchy levels.
3.3. A planned sequence of levels and a name for each level. The selected columns must represent the analytical path you intend readers to follow.
Steps
Open the Datamart tab
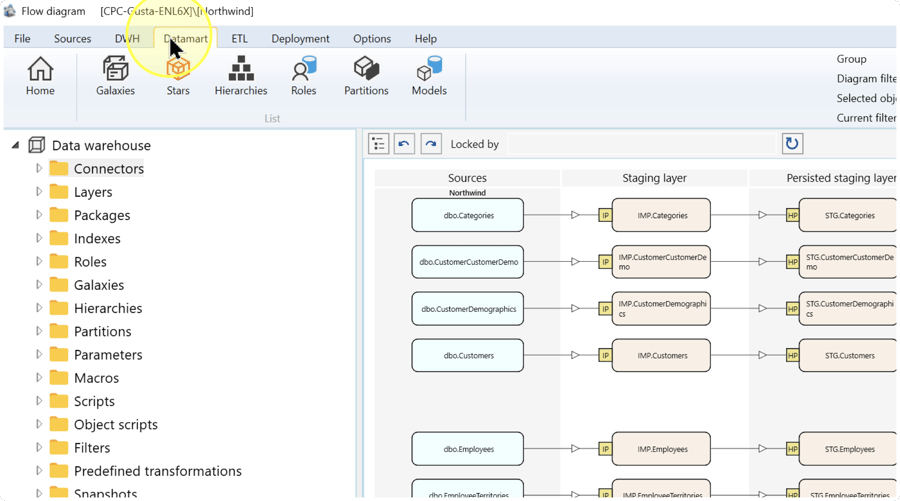
In the open Data Warehouse (DWH) project, click the Datamart tab on the toolbar.
Open the hierarchy list
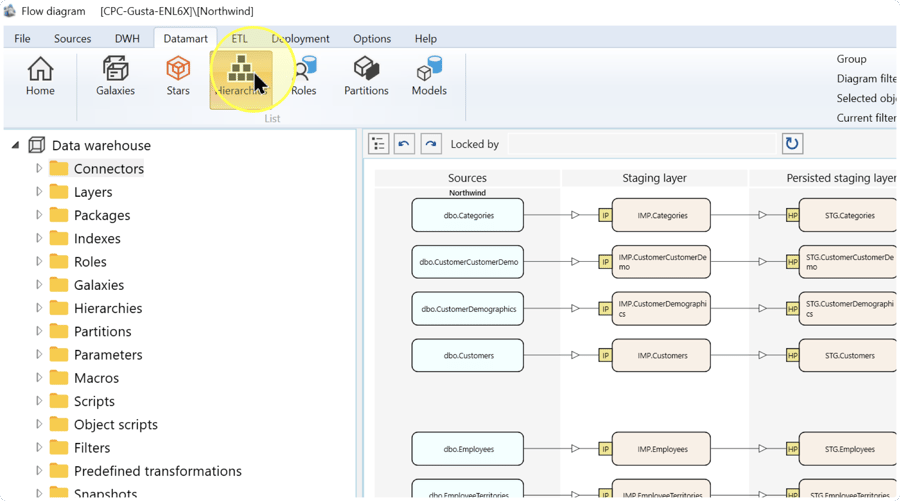
In the List group on the Datamart tab, click Hierarchies to open the hierarchy list.
Create a hierarchy definition
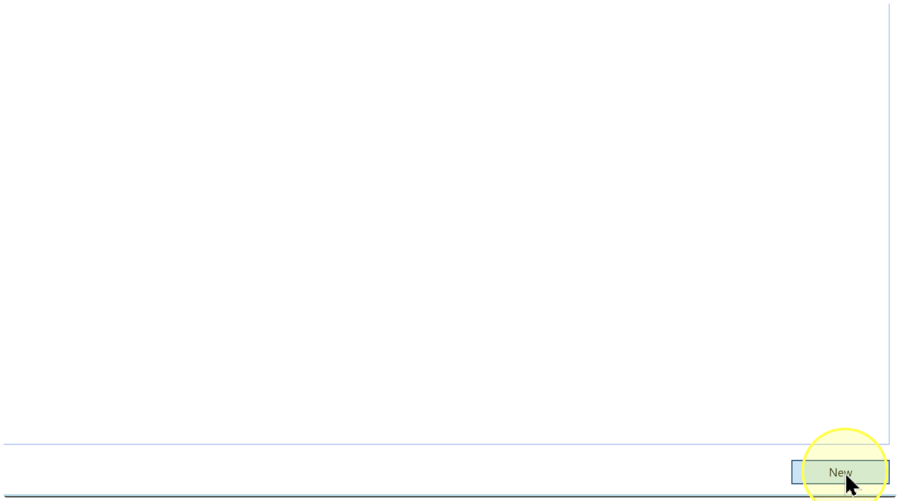
At the bottom of the hierarchy list, click New to open a new hierarchy definition.
Select the table's schema
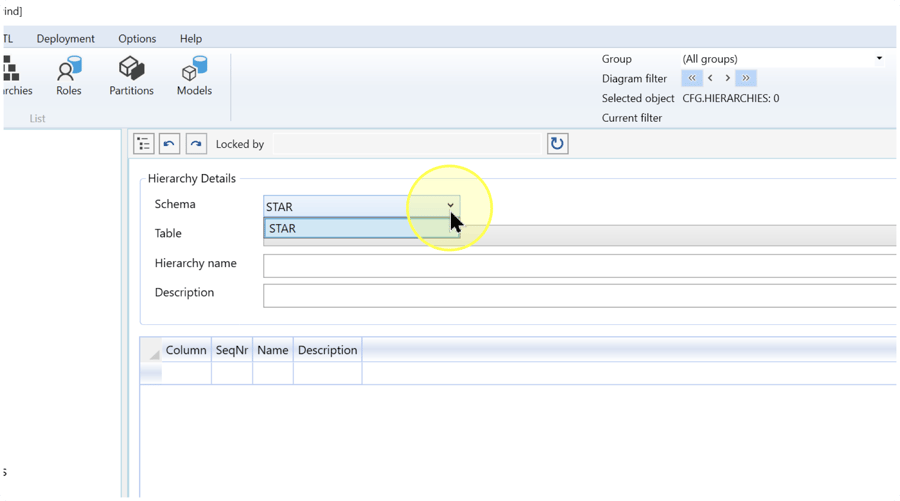
In Hierarchy Details, open the Schema list and select the schema containing the analytical table. A schema groups database objects under a shared namespace; use the schema of the table you planned to use.
The upper part of the editor contains the settings for the hierarchy as a whole. The grid below it contains one row for each hierarchy level and is configured in Add and order the hierarchy levels.
Select the analytical table
Open the Table list and select the table that contains the columns for your planned hierarchy. All level columns in this definition come from that table.
Check both Schema and Table before continuing, especially if similarly named tables exist in the project. If the table does not contain the required level columns, resolve that starting condition before configuring the hierarchy.
![Table list open in Hierarchy Details with DIM_Categories [Categories] selected among the example tables.](https://www.analyticscreator.com/hs-fs/hubfs/images/how-to/047-create-configure-hierarchies%20-%202026-08-31_18-40-01/047-create-configure-hierarchies%20-%202026-08-31_18-40-01_Step005.webp?width=900&name=047-create-configure-hierarchies%20-%202026-08-31_18-40-01_Step005.webp)
Name and describe the hierarchy
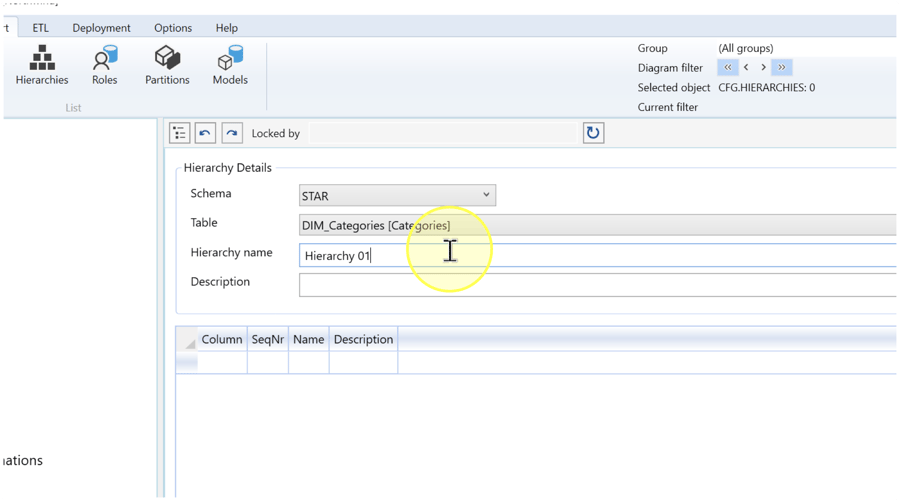
In Hierarchy name, enter a name that identifies the analytical path represented by the hierarchy. In the Description field immediately below it, enter an explanation of the hierarchy's purpose.
These settings describe the entire hierarchy. The Name and Description cells in the grid describe individual levels and are configured next.
Add and order the hierarchy levels
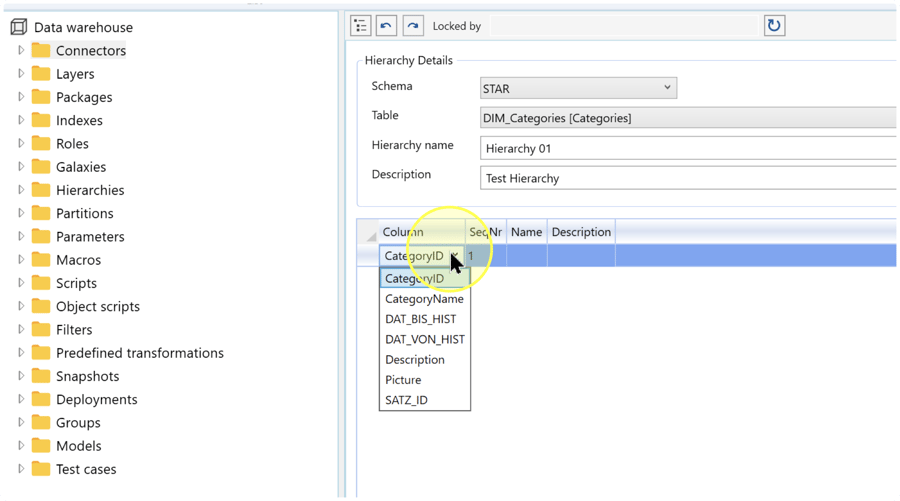
In the grid below Hierarchy Details, configure one row for each level. A level pairs a column from the selected table with its position and display name in the hierarchy.
4.7.1. In an empty row, open the Column list and select the column representing the first level of your planned analytical path.
4.7.2. In the same row, enter the level's sequence number in SeqNr and its display name in Name. Use sequence numbers that reflect the intended order, from the broadest level to the most detailed level.
4.7.3. If the level needs an explanation beyond its name, enter it in that row's Description cell. Otherwise, leave that cell blank.
4.7.4. Repeat these actions in the next empty row for each remaining level. Compare every selected column, sequence number, and name with your planned hierarchy.
- Column — An existing attribute column from the selected table that supplies the values for a hierarchy level.
- SeqNr — The level's sequence number. Use it to express the level's position in the intended navigation order.
- Name / Description in the level grid — Name is the display name for that level. Description explains the level when additional context is needed.
Level sequence example: if your table contains suitable Year, Month, and Date columns and the data supports that path, you could use sequence numbers 1, 2, and 3 for Year → Month → Date. Each successive level should provide more detail within the preceding level. Use this example only when it matches your data and intended analysis.
Review and save the hierarchy
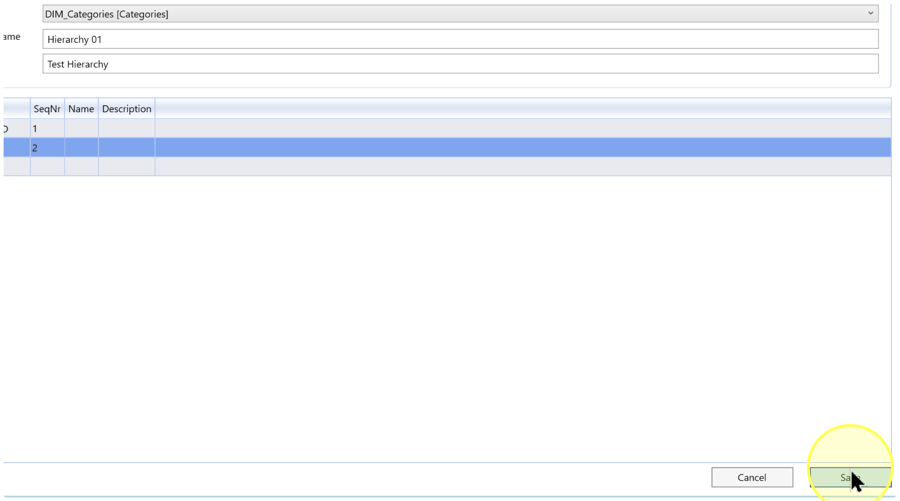
Review Schema, Table, Hierarchy name, and the hierarchy Description. Then check that every intended level has the correct Column, SeqNr, and Name, with a level Description where needed.
Click Save. Verify the saved definition using Expected Results.
Expected Results
The hierarchy definition is saved in the Data Warehouse (DWH) project with the intended table, level columns, sequence, and names. Confirm this by reopening it:
5.1. Click Datamart, then Hierarchies. Locate the hierarchy you saved and double-click its entry to open its definition.
5.2. Check Schema, Table, Hierarchy name, and the hierarchy Description against the values you intended to save.
5.3. Check the level rows. Each intended level should retain its selected Column, SeqNr, Name, and any entered Description. The sequence should match the analytical path you designed.
These checks confirm the saved definition. After the analytical model is generated and processed through your project's separate workflow, verify the hierarchy's level order and representative navigation paths in that model.
Decisions and variations
6.1. Table and level selection. Select the table that contains the intended level columns, as described in Select the analytical table. Choose columns that form a meaningful analytical path; assigning unrelated columns a sequence does not establish useful relationships between their values.
6.2. Level descriptions. Enter a level Description when its Name needs additional explanation; otherwise, leave the cell blank. This is separate from the description of the hierarchy as a whole in Name and describe the hierarchy.
Troubleshooting
- Required object is missing — Confirm that you are in the intended Data Warehouse (DWH) project. For a missing table, check Schema; for a missing level column, check Table. The required table and columns must already exist before you configure their hierarchy.
- Save is unavailable or fails — Read any displayed validation message and review the hierarchy settings and level rows in Review and save the hierarchy. If Locked by identifies another user, coordinate with that user before continuing. This field displays lock information; it is not a hierarchy setting.
- Saved definition differs from the intended result — Reopen the definition as described in Expected Results, compare its settings with your design, correct the mismatches, and click Save again. Recheck the saved values. Check behavior in a generated and processed analytical model separately.
