
To make smart decisions, companies need to turn raw data into clear, reliable insights. This is where Business Intelligence (BI) platforms come in. Choosing the right BI software is a strategic decision: it must integrate with your existing systems, meet your security and governance standards, support high-quality reporting, and be flexible enough to adapt as your business evolves. The goal is to select a platform that not only fits your current landscape, but also truly supports how your organization wants to analyse and use data.
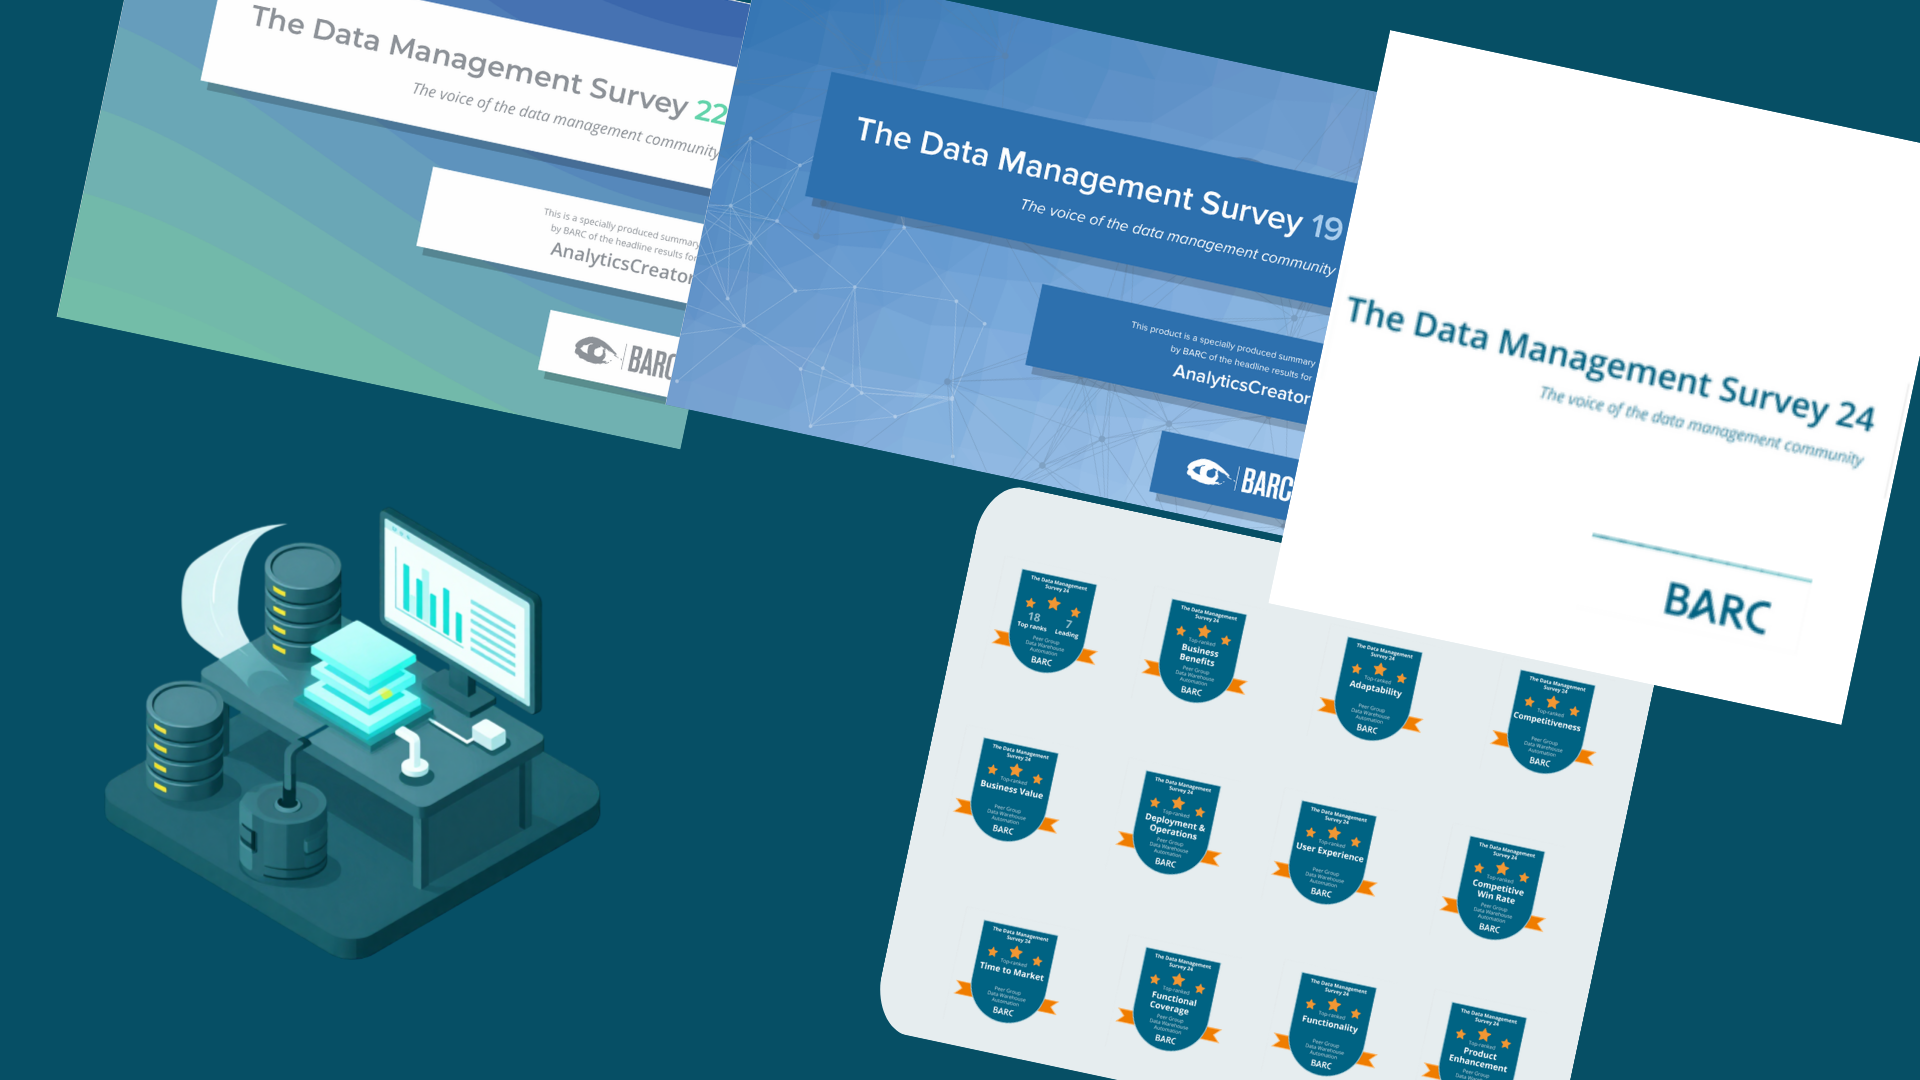
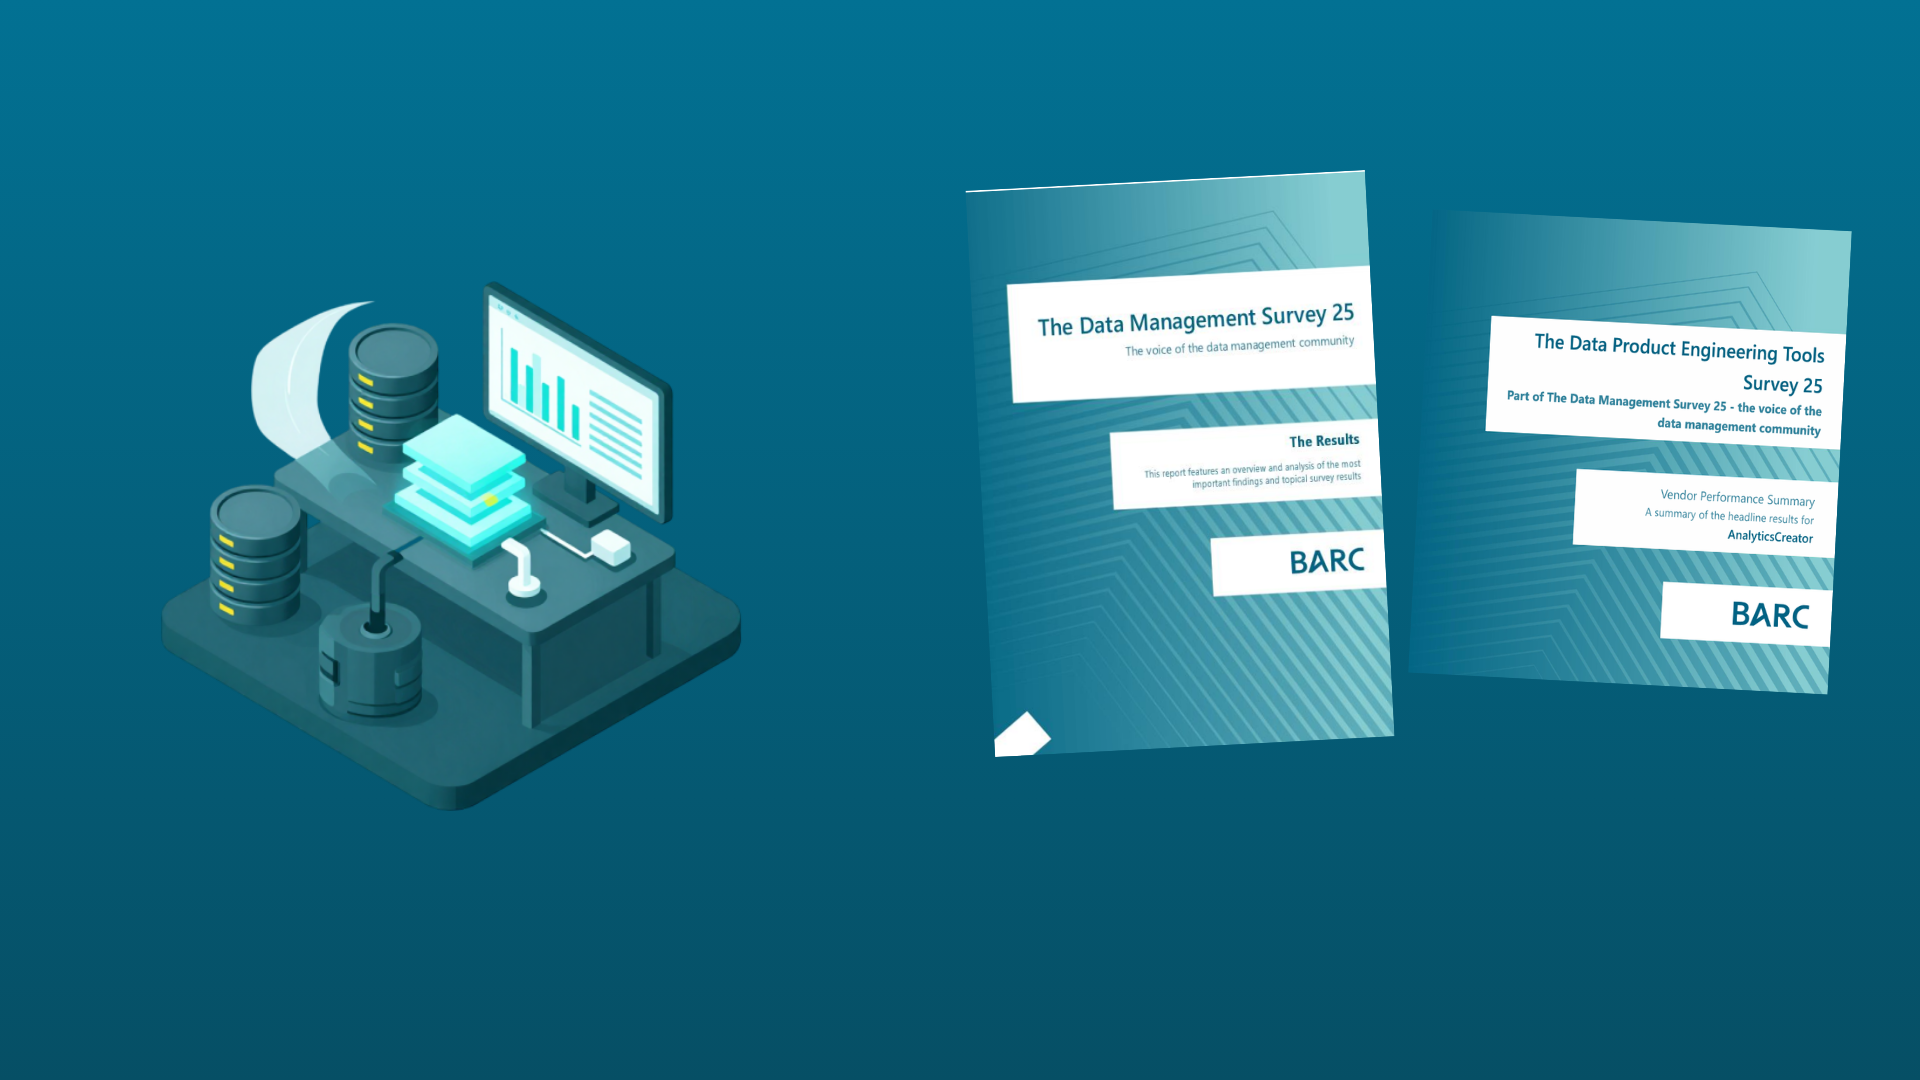
To support this decision, this article provides an overview and ranking of some of the leading BI platforms in 2025. The comparison is based on a combination of expert evaluations and real user feedback. We draw on reports from well-known analyst firms such as Gartner, BARC, and Forrester, and combine these with aggregated reviews from platforms including Capterra, G2, SourceForge, TrustRadius, and PeerSpot. The result is a practical, balanced view of the BI tools that stand out in today’s market.
How We Ranked the Platforms
Our assessment combines structured analyst research with real-world user sentiment. Specifically, we considered:
- Gartner Magic Quadrant: Evaluates BI vendors on their ability to execute and the completeness of their vision. This is one of the most widely referenced benchmarks in the technology space.
- BARC BI & Analytics Survey: One of the largest user-based BI surveys worldwide. It highlights user satisfaction and platform performance across key dimensions such as usability, flexibility, and business value.
- Forrester Reports: Provides in-depth analysis on market trends, vendor strategies, and technology capabilities in the BI and analytics landscape.
- User Review Platforms: Ratings from Capterra, G2, SourceForge, TrustRadius, and PeerSpot were aggregated to understand real-life experiences, perceived strengths, and recurring pain points.
Top Business Intelligence Platforms of 2025
Based on this combined view of analyst opinion and user feedback, several BI platforms consistently stand out for their capabilities, usability, and ecosystem strength. The tables below show rating snapshots across analyst reports and key review platforms, giving you a quick, comparable view of overall perception and performance.

1. Microsoft Power BI
Microsoft Power BI consistently leads the BI market and is recognized as a Leader in the Gartner Magic Quadrant. It's known for being easy to use, having a wide range of features, and working seamlessly with other Microsoft products.
- Key Strengths:
- Connects to many different data sources.
- Analyzes data in real-time.
- Offers interactive and adaptable dashboards.
- Includes AI-powered analytics.
- Provides excellent value, including a free option and an affordable professional version.
- Has a strong presence in the market.
Gartner Magic Quadrant |
G2 Rating |
Capterra Rating |
SourceForge Rating |
TrustRadius Rating |
PeerSpot Rating |
Leader |
4.5/5 |
4.6/5 |
4.5/5 |
8.7/10 |
9/10 |
2. Tableau
Now part of Salesforce, Tableau is famous for its outstanding data visualization and user-friendly design. It's excellent for exploring complex data and creating interactive dashboards, making it a favorite for organizations that work with a lot of data
- Key Strengths
- Industry-leading data visualization.
- Intuitive drag-and-drop interface.
- Advanced analytics features.
- Large and active community of users.
- Powerful AI-driven insights.
- Flexible options for how to deploy and use the software.
Gartner Magic Quadrant |
G2 Rating |
Capterra Rating |
Barc Rating |
TrustRadius Rating |
PeerSpot Rating |
Leader |
4.4/5 |
4.5/5 |
6.6/10 |
8.4/10 |
9/10 |

3. Qlik Sense
Qlik Sense stands out with its unique way of connecting data, allowing users to explore data in a non-linear way and discover hidden insights. Its AI and self-service features make it a powerful tool for companies seeking advanced analytics.
- Key Strengths
- Associative data model for understanding complex data relationships.
- AI-powered insights to automatically find patterns.
- Self-service BI capabilities, empowering users to analyze data themselves.
- Strong data governance features to maintain data quality and security.
- Flexible approach to analytics.
- Advanced data integration capabilities.
Gartner Magic Quadrant |
G2 Rating |
Capterra Rating |
Barc Rating |
TrustRadius Rating |
PeerSpot Rating |
Leader |
4.4/5 |
4.4/5 |
6.4/10 |
7.9/10 |
8/10 |
4. Looker
Looker, now part of Google Cloud, is recognized as a Visionary by Gartner. Its modern, cloud-based design and strong data modeling capabilities are particularly beneficial for organizations using Google's cloud services.
- Key Strengths
- Built for the cloud.
- Robust data modeling features.
- Integrates seamlessly with Google Cloud.
- Acts as a centralized data platform.
- Offers customizable reports.
- Includes a free version called Looker Studio
Gartner Magic Quadrant |
G2 Rating |
Capterra Rating |
Barc Rating |
TrustRadius Rating |
PeerSpot Rating |
Visionary |
4.4/5 |
4.5/5 |
6.0/10 |
8.1/10 |
8/10 |

5. ThoughtSpot
ThoughtSpot is recognized as a Visionary in Gartner's Magic Quadrant, especially for its AI-first approach and ability to analyze data using natural language search. This makes data analysis more accessible to users who are not technical experts.
- Key Strengths
- Natural language search – ask questions in plain English.
- AI-driven insights to surface important findings automatically.
- Real-time data exploration.
- Self-service analytics for broader user access.
- Easy to use for non-technical users.
Gartner Magic Quadrant |
G2 Rating |
Capterra Rating |
Barc Rating |
TrustRadius Rating |
PeerSpot Rating |
Visionary |
4.4/5 |
4.5/5 |
6.3/10 |
8.3/10 |
8/10 |

6. Pyramid Analytics
Pyramid Analytics stands out in the BARC 2025 BI & Analytics Survey, achieving top rankings in numerous key performance indicators (KPIs). While Gartner recognizes it as a Visionary, BARC's user-focused survey highlights its strengths in user experience and overall value.
- Key Strengths
- Comprehensive BI platform.
- Strong integration with SAP systems.
- User-friendly data modeling tools.
- Excellent return on investment (ROI) according to BARC.
- Advanced analytics features.
- Strong performance in large-scale business deployments.
Gartner Magic Quadrant |
G2 Rating |
Capterra Rating |
Barc Rating |
TrustRadius Rating |
PeerSpot Rating |
Visionary |
4.3/5 |
4.4/5 |
7.1/10 |
7.8/10 |
8/10 |
7. Sisense
Sisense is identified as a Visionary in the Gartner Magic Quadrant and is particularly known for its embedded analytics capabilities and ability to handle large and complex datasets.
- Key Strengths
- Powerful embedded analytics features.
- Scalable architecture designed for complex data.
- Customizable dashboards.
- AI-driven insights.
- Easy to integrate into existing business workflows.
Gartner Magic Quadrant |
G2 Rating |
Capterra Rating |
Barc Rating |
TrustRadius Rating |
PeerSpot Rating |
Visionary |
4.2/5 |
4.4/5 |
6.1/10 |
7.7/10 |
8/10 |

8. Domo
Domo is a cloud-based BI platform that offers a wide range of tools for data integration, visualization, and analysis. It's particularly strong at handling large amounts of data and providing real-time insights
- Key Strengths
- Cloud-based platform.
- Real-time data integration.
- Many options for visualizing data.
- Strong mobile capabilities for access on the go.
- Scalable to handle large data volumes.
Gartner Magic Quadrant |
G2 Rating |
Capterra Rating |
Barc Rating |
TrustRadius Rating |
PeerSpot Rating |
Visionary |
4.4/5 |
4.5/5 |
6.2/10 |
7.9/10 |
8/10 |
9. Zoho Analytics
Zoho Analytics is consistently praised for being affordable and easy to use, making it a great choice for small and medium-sized businesses. It provides comprehensive BI features with AI capabilities at a competitive price.
- Key Strengths
- User-friendly interface.
- Affordable pricing.
- Connects to a wide variety of data sources.
- Strong integration with the Zoho suite of applications.
- AI-powered insights.
Gartner Magic Quadrant |
G2 Rating |
Capterra Rating |
Barc Rating |
TrustRadius Rating |
PeerSpot Rating |
Niche Player |
4.3/5 |
4.5/5 |
7.3/10 |
8.3/10 |
8/10 |

10. Yellowfin BI
Yellowfin BI, recognized as a Niche Player in the Gartner Magic Quadrant, is known for its strong focus on data storytelling and visualization. It also offers automated data discovery and features that support team collaboration.
- Key Strengths
- Excellent data storytelling features to communicate insights effectively.
- Automated insights to speed up analysis.
- Collaboration features for teams to work together.
- Flexible deployment options.
- AI-powered analytics.
Gartner Magic Quadrant |
G2 Rating |
Capterra Rating |
Barc Rating |
TrustRadius Rating |
PeerSpot Rating |
Niche Player |
|
4.6/5 |
|
7.9/10 |
8/10 |
Other BI Platforms to Consider
- SAP Analytics Cloud: Aimed primarily at larger enterprises, SAP Analytics Cloud combines BI, planning, and predictive capabilities in a unified platform.
- IBM Cognos Analytics: A mature enterprise analytics platform with strong reporting, dashboarding, and integrated AI features for advanced analysis.
The Business Intelligence market in 2025 is rich with powerful tools, each designed for slightly different use cases and organizational profiles. Established leaders like Microsoft Power BI, Tableau, and Qlik Sense remain at the forefront, while innovative platforms such as ThoughtSpot and Pyramid Analytics continue to gain traction thanks to their strengths in search-based analytics, augmented intelligence, or guided analytics workflows.
How to Choose the Right BI Platform
When selecting a BI platform, it’s important to start with your specific context rather than the market hype. Consider:
- Data volume and complexity: How much data do you manage, from how many systems, and how complex are your integration needs?
- Team skills: Does your team prefer low-code, drag-and-drop tools, or do you have strong data engineering and scripting capabilities?
- Integration requirements: How tightly must the BI tool integrate with your existing data warehouse, data lake, ERP, CRM, or cloud environment?
- Governance and security: Do you require row-level security, strict governance, auditability, or industry-specific compliance?
- Budget and TCO: Beyond license cost, account for implementation, training, maintenance, and infrastructure.
These factors will help you narrow the field and focus on the platforms that best align with your organization’s reality and ambitions.
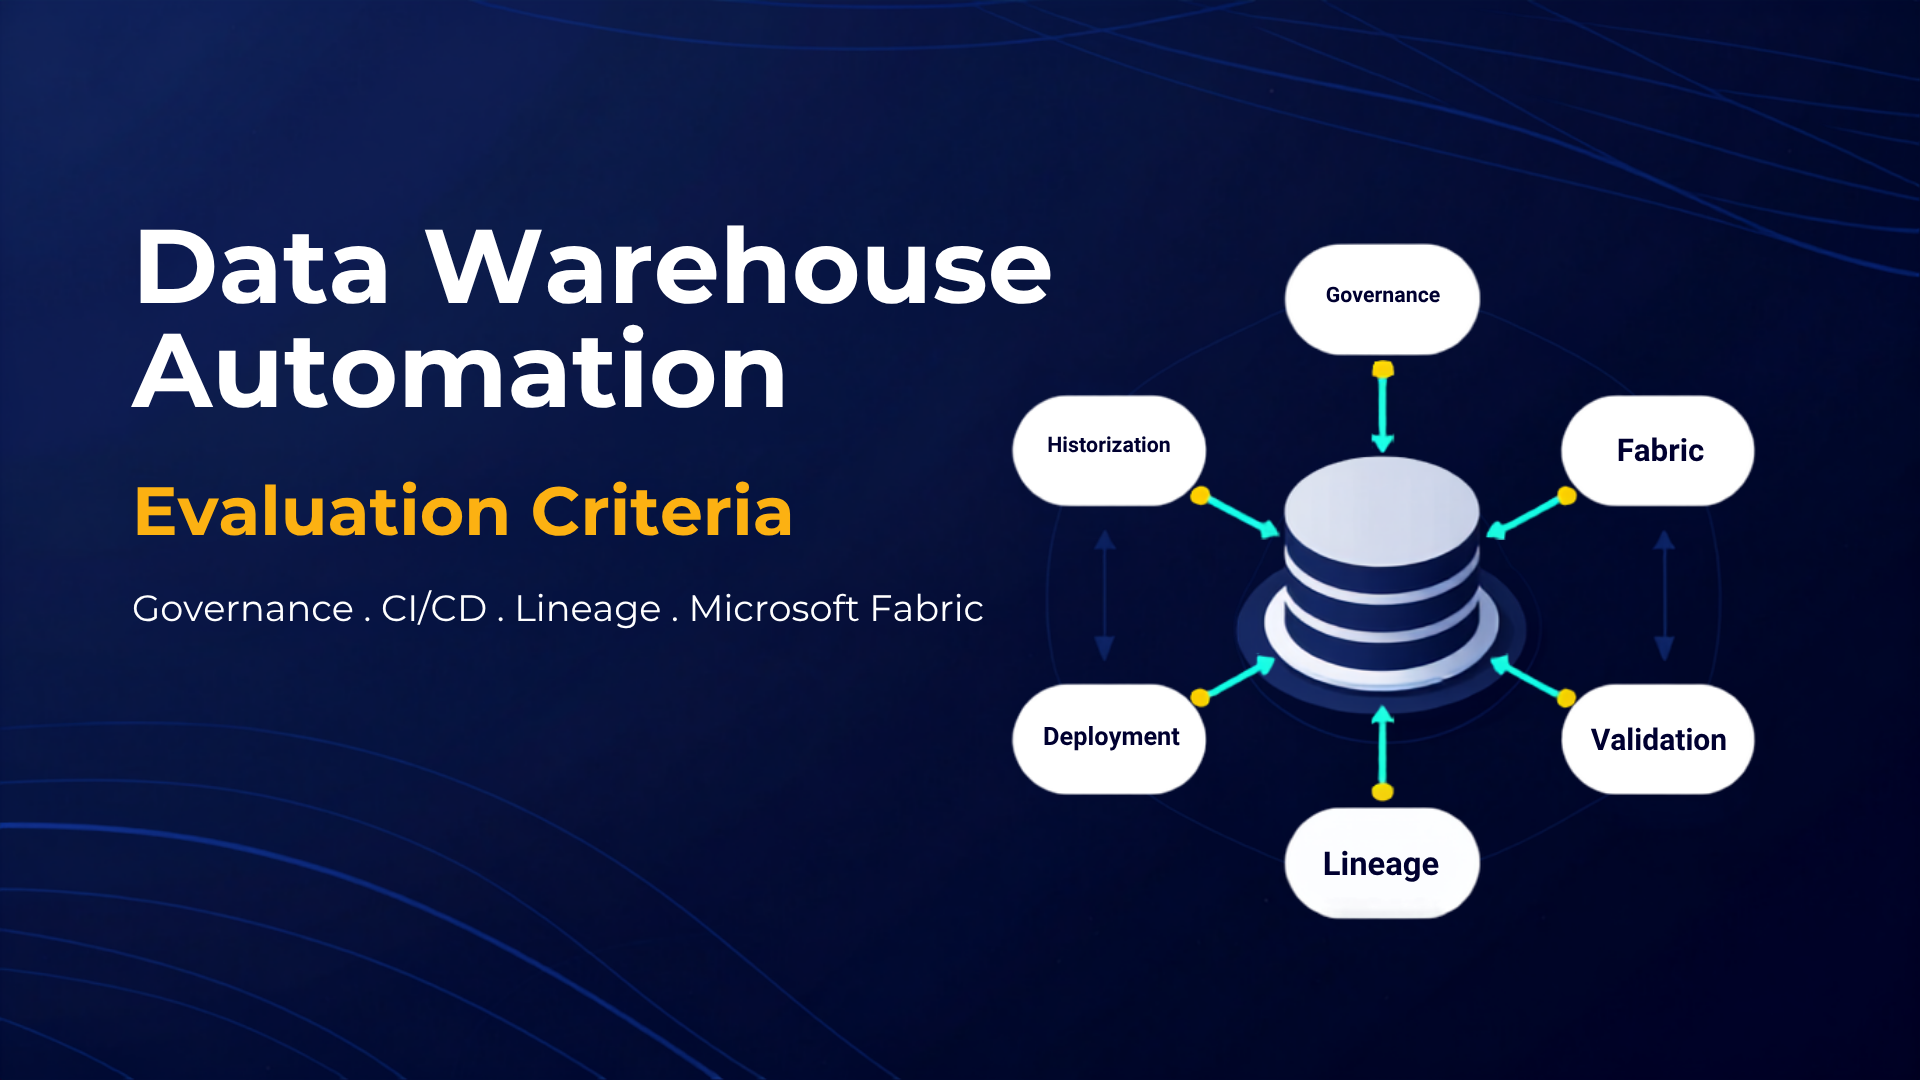
The Role of Data Infrastructure and Automation
The strength of your BI platform is directly tied to the quality and agility of your underlying data infrastructure. A flexible, automated data foundation ensures that dashboards and reports remain reliable as data sources, structures, and business requirements evolve.
Tools like AnalyticsCreator play a critical role here. By streamlining data warehouse automation, AnalyticsCreator helps organizations design, build, and maintain robust data models and pipelines much more efficiently. This allows BI platforms to sit on top of a clean, governed, and scalable data layer—rather than on fragile, manually maintained integrations.
This ranking and comparison can serve as a starting point for your BI evaluation. The most important step, however, is to map these platforms against your own use cases, data architecture, and long-term analytics strategy. A well-chosen BI platform, paired with a modern and automated data infrastructure, is a key enabler for a sustainable, data-driven future.
The BI landscape and adjacent technologies are evolving quickly, with continuous advances in AI, natural language interfaces, and automation. Staying informed about vendor roadmaps and market developments will help your organization maintain a competitive edge and keep your analytics environment future-ready.
Frequently Asked Questions (FAQ)
1. What is the most important factor when choosing a BI platform?
The most important factor is alignment with your business requirements and existing data landscape. A “top” platform on paper may underperform if it doesn’t integrate well with your systems, governance model, or team skills.
2. Should I always choose a Leader from the Gartner Magic Quadrant?
Not necessarily. Leaders are strong general-purpose options, but Visionaries or Niche Players can be a better fit for specific industries, use cases, or budget constraints. Use the quadrant as input—not as the only decision driver.
3. How much weight should I give to user reviews on G2 or Capterra?
User reviews are very helpful for understanding usability, support quality, and common pain points. However, they should complement, not replace, a hands-on evaluation and a proof of concept tailored to your environment.
4. Do all BI platforms integrate equally well with my data warehouse?
No. Integration depth varies. Some platforms have native connectors and tight integration with specific cloud or database ecosystems, while others require more custom work. Always validate connectivity, performance, and security in your target architecture.
5. How does data warehouse automation support BI adoption?
Data warehouse automation tools like AnalyticsCreator reduce the time and effort required to build and maintain data models and pipelines. This leads to more reliable data, faster iteration, and fewer bottlenecks—directly improving BI adoption and trust.
6. Is it realistic to use more than one BI platform?
Yes, many large organizations use multiple tools—for example, a standard platform for enterprise reporting and a second tool for advanced analytics or specific departments. The key is to maintain a consistent, governed data foundation underneath.
7. How often should we revisit our BI platform choice?
You don’t need to switch tools frequently, but it’s wise to review your BI strategy every 1–2 years. Check whether your current platform still aligns with your data volume, use cases, and user expectations, and whether new capabilities (AI, natural language, etc.) are being leveraged.
8. Where does AnalyticsCreator fit into a BI architecture?
AnalyticsCreator sits in the data layer, not the visualization layer. It automates data modeling, ETL/ELT, and data warehouse structures so that BI tools like Power BI, Tableau, or Qlik can consume clean, well-modeled, and governed data with minimal manual effort.