
Microsoft has recently renamed the Power BI dataset content type to semantic model. This change is aimed at avoiding confusion and better reflecting the rich functionality of Analysis Services data models. The term dataset is too generic and has different meanings in other data-related contexts, especially in Microsoft Fabric.
The semantic model is a more accurate term for the underlying database in Power BI, which is based on Analysis Services data models and provides the authoritative source of truth for reports. It is also more consistent with the Fabric vision, which is the first truly unified analytics solution based on one copy of data, using open-standard formats and end-to-end service offerings.
The change is a rename only, and there is no interruption to usage or service. Users are not required to make any changes, but they should be notified of this change to avoid confusion and support requests.

- Semantic model: Microsoft has renamed the Power BI dataset content type to semantic model, which better reflects the rich functionality of Analysis Services data models.
- Reasons for rename: The term dataset is too generic and has different meanings in other data-related contexts, especially in Microsoft Fabric.
- No service interruption: The rename is only a change in terminology and does not affect the usage or service of Power BI. Users are not required to make any changes.
The semantic model name will help drive awareness of the unparalleled capabilities provided by Power BI datasets, such as scalability, security, governance, and ease of management. The change is a positive step towards better reflecting the rich functionality of Analysis Services data models and avoiding confusion in the data-related contexts.
Semantic models in the Power BI service
- Power BI semantic models are sources of data that are ready for reporting and visualization. They can be created in various ways, such as connecting to existing data models, uploading Excel or CSV files, or using the Power BI service.
- Analysis Services models are external-hosted models that Power BI can make live connections to. They can be SQL Server Analysis Services or Azure Analysis Services. They can enforce data permissions and row-level security.
- Power BI Desktop models are Power BI-hosted models that use the Analysis Services tabular model technology. They can use Import, DirectQuery, or Composite modes to access data from different sources. They can also enforce row-level security.
To deploy and manage Power BI semantic models, one should understand the model design, the semantic model modes, the connectivity and refresh requirements, and the security rules.
How Power BI semantic models can simplify data analysis and visualization for business users and analysts.
Power BI semantic models represent a source of data that’s ready for reporting and visualization. They can be created in various ways, such as connecting to existing data models, uploading Excel or CSV files, or using the Power BI service. They simplify data analysis and visualization for business users and analysts by providing a consistent and secure data source that can be easily managed and scaled. Semantic models can leverage existing investments in enterprise data warehouse and provide consistent and secure data access. They can also integrate data from various sources and support different query modes. By choosing the best semantic model mode and configuration for different scenarios and needs, business users and analysts can make data-driven decisions with confidence.

How Power BI Desktop models can integrate data from various sources and support different query modes.
Power BI Desktop models can integrate data from various sources and support different query modes. With composite models, a report can seamlessly include data connections from more than one DirectQuery or import data connection, in any combination you choose. The composite models capability in Power BI Desktop consists of three related features: Composite models, Many-to-many relationships, and Storage mode. Composite models allow a report to have two or more data connections from different source groups. Many-to-many relationships remove requirements for unique values in tables. Storage mode helps improve performance and reduce back-end load. You can connect to different kinds of data sources when you use Power BI Desktop or the Power BI service. You can make those data connections in a couple of ways: By importing data to Power BI, which is the most common way to get data, or by connecting directly to data in its original source repository by using DirectQuery. To learn more about DirectQuery, see DirectQuery in Power BI. For a more granular solution a DWH automation tool, like AnalyticsCreator is recommended.
To choose the best semantic model mode and configuration for different scenarios and needs, you need to understand the three semantic model modes: Import, DirectQuery, and Composite.
-
Import mode is the most common mode used to develop semantic models. It delivers fast performance thanks to in-memory querying and offers design flexibility to modelers. It’s the default mode when creating a new Power BI Desktop solution. Imported data is always stored to disk. When queried or refreshed, the data must be fully loaded into memory of the Power BI capacity. Once in memory, Import models can then achieve very fast query results. However, the entire model must be loaded to memory before Power BI can query the model, which can place pressure on available capacity resources, especially as the number and size of Import models grow. Model data is only as current as the latest refresh, and so Import models need to be refreshed, usually on a scheduled basis.
-
DirectQuery mode is an alternative to Import mode. Models developed in DirectQuery mode don’t import data into Power BI. Instead, they connect directly to the data source and query the data source for each visualization. This mode is useful when you have a large data source that you don’t want to import into Power BI. DirectQuery mode is slower than Import mode, but it provides real-time data access and the ability to work with large data sources.
-
Composite mode allows a report to have two or more data connections from different source groups. Composite models consist of three related features: Composite models, Many-to-many relationships, and Storage mode. Many-to-many relationships remove requirements for unique values in tables. Storage mode helps improve performance and reduce back-end load. Composite models allow a report to seamlessly include data connections from more than one DirectQuery or import data connection, in any combination you choose.
To choose the best semantic model mode and configuration, you need to consider factors such as the size of your data source, the frequency of data updates, and the performance requirements of your reports. Import mode is best suited for small to medium-sized data sources that require fast performance. DirectQuery mode is best suited for large data sources that require real-time data access. Composite mode is best suited for reports that require data from multiple data sources.
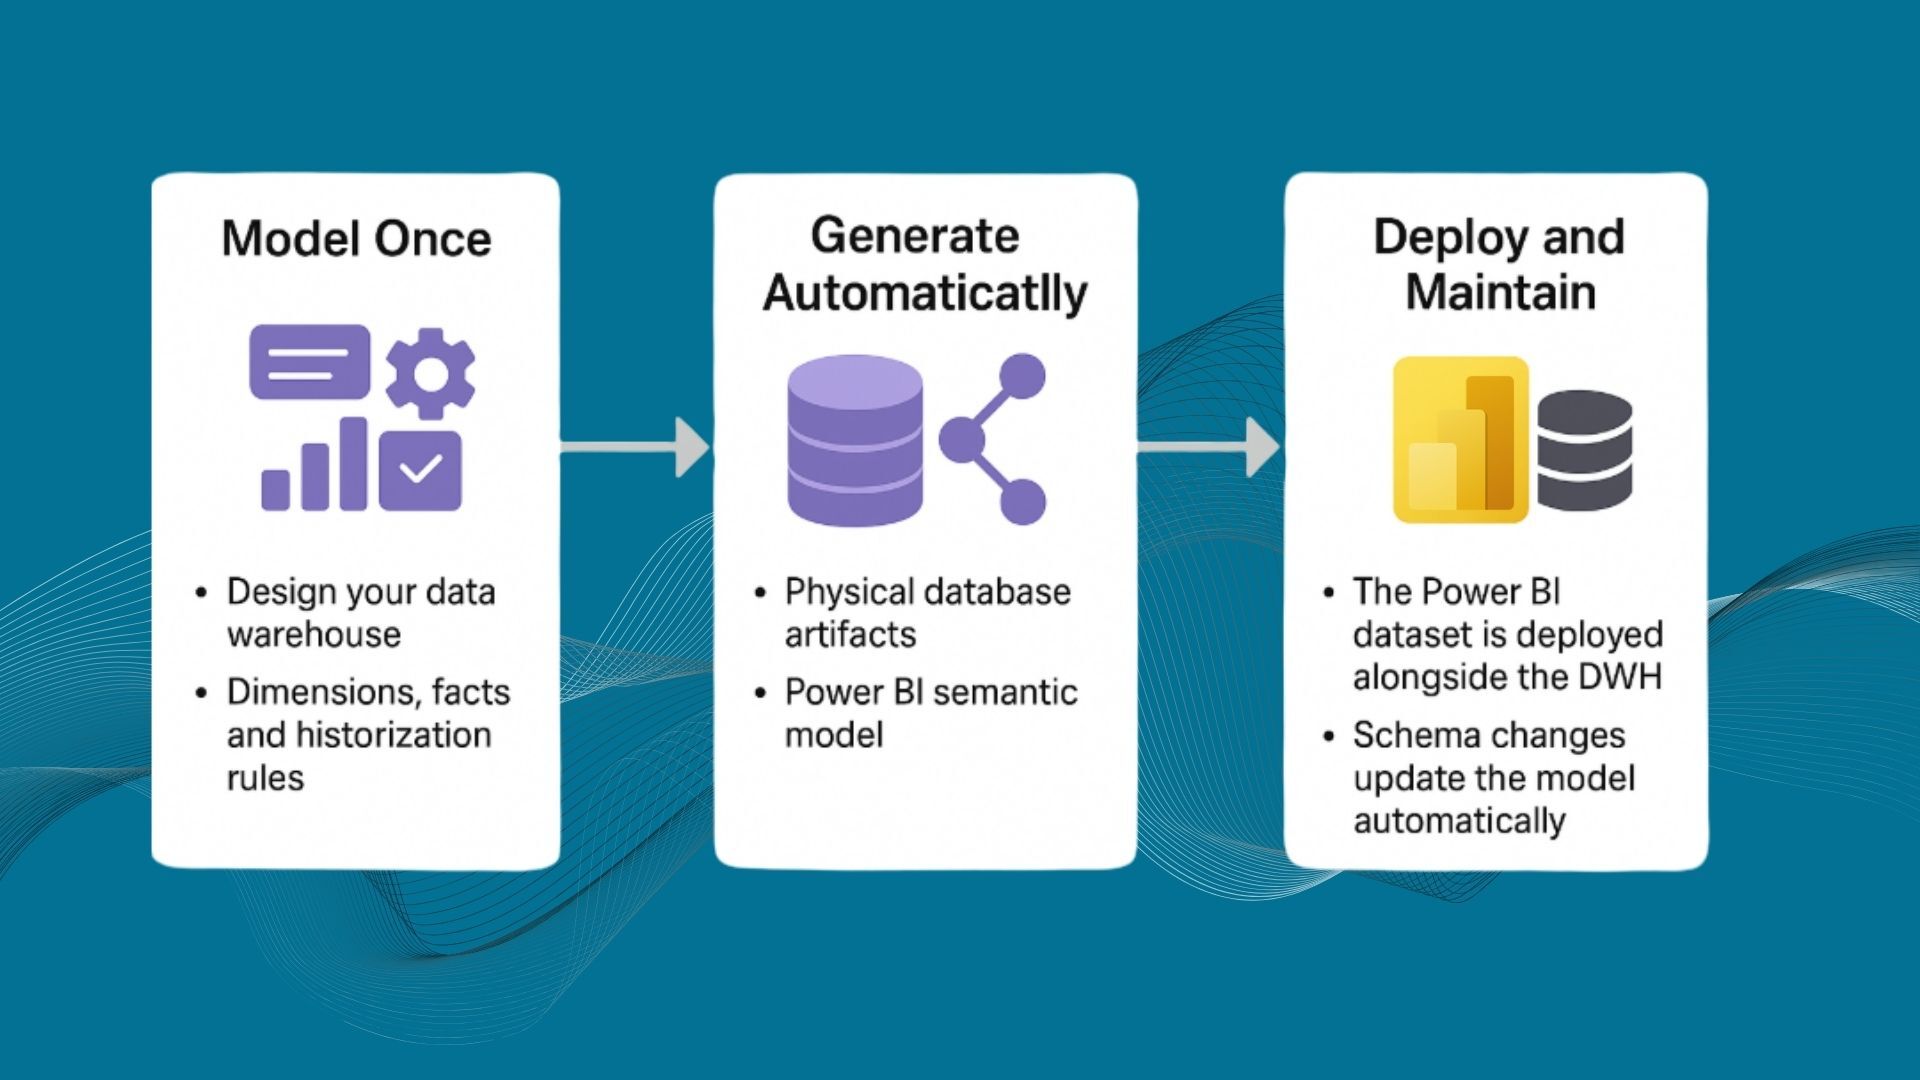
AnalyticsCreator is a powerful tool that can help simplify the process of incorporating data for Power BI. It automates the design, creation, maintenance, and deployment of data warehouses, data pipelines, and Power BI models. AnalyticsCreator can connect to any data source and transfer data to your cube or MS Tabular model. It provides ultra-fast prototyping, which can help you get results in hours instead of days. AnalyticsCreator also offers a holistic data model, which can help you map the core business logic directly in AnalyticsCreator.
To use AnalyticsCreator, you don’t need to be an expert in programming or data management. AnalyticsCreator generates the code for all data management needs through your analytical frontend, like Power BI. AnalyticsCreator is available on Azure Marketplace and can be used on-premises or in the cloud.
By using AnalyticsCreator, you can reduce your project risk, save time and cost, and achieve results faster. AnalyticsCreator also provides automated documentation and a powerful Data Lineage, which brings transparency for all stakeholders. AnalyticsCreator is a great tool for simplifying the process of incorporating data for Power BI. It provides a fast, efficient, and user-friendly way to manage your data and create powerful analytics solutions.