Back to all Blogs
2019–2024 BARC Rankings: AnalyticsCreator Automation
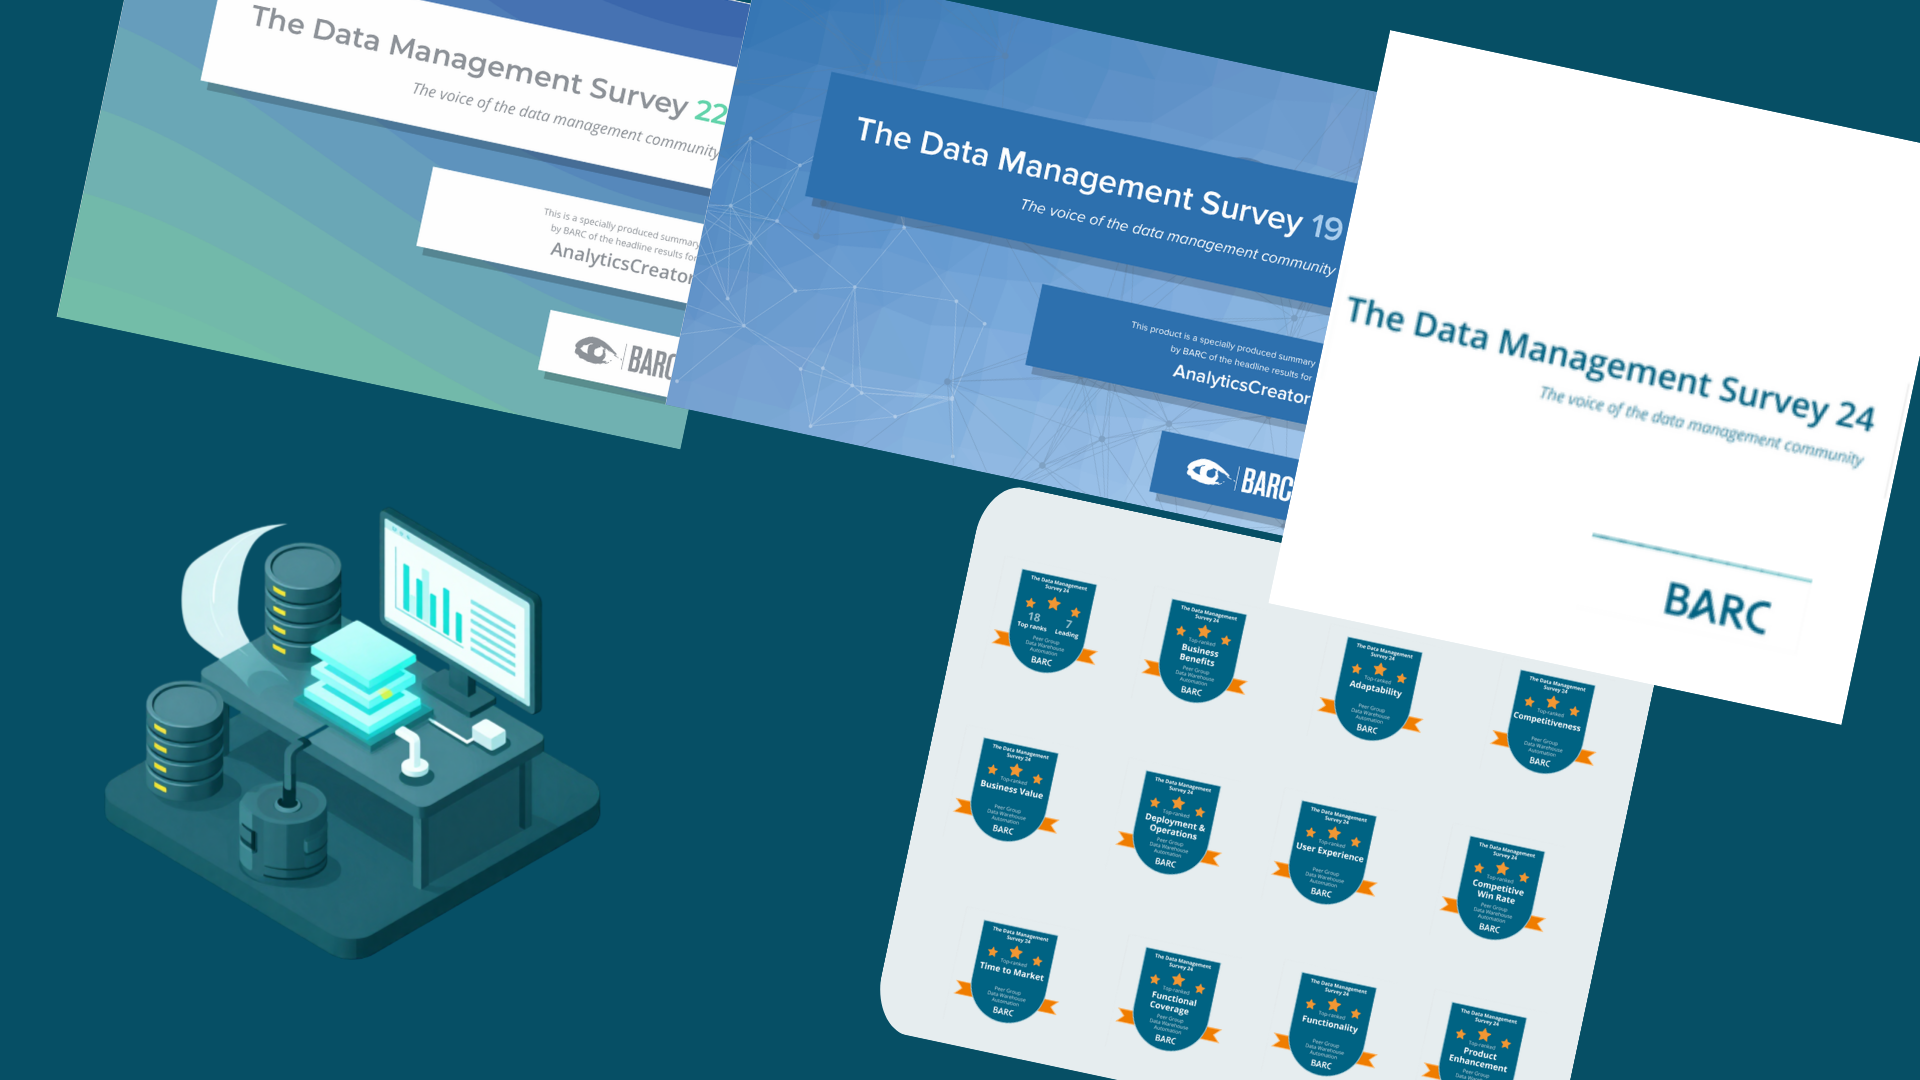


From 2019 to 2024, AnalyticsCreator’s BARC results evolved from engineering-focused top rankings in development efficiency, maintenance efficiency and governance into broader recognition for business value, business benefits, technical foundation and deployment operations. The pattern suggests that the value case moved beyond automation speed into maintainable, governed analytics delivery.
Part 2 of 5 in our series on six years of BARC KPI data for AnalyticsCreator.
The first four BARC Data Management Survey editions tell a clear story. AnalyticsCreator starts as a strong engineering and governance application, then reaches 2024 with a broader evidence base across business value, technical foundation and operational maturity.
That shift matters for data and analytics leaders evaluating AnalyticsCreator functions and features. The 2019–2024 pattern does not only show automation strength. It shows how user feedback moved from engineering efficiency toward governed delivery at scale.
In this article
- How AnalyticsCreator’s BARC results developed from 2019 to 2024
- Why the early rankings were mainly engineering and governance signals
- How 2022 and 2023 strengthened the automation case
- Why 2024 marks an inflection point toward business value and operational maturity
- What this pattern means before the 2025 peer-group comparison in Part 3
How to read the 2019–2024 BARC results
The 2019–2024 results should be read as a pattern across survey years, not as isolated rankings. The table below uses the same marker logic introduced in Part 1 of this series.
| Marker | Meaning |
|---|---|
| T | Top-ranked, meaning rank 1 in the relevant BARC peer group |
| L | Leader position, meaning among the strongest products in the peer group |
| - | Not highlighted or not available for that survey year |
The important point is consistency. One top ranking is useful. Repeated top rankings and leader positions across multiple survey years are stronger evidence that the underlying capability is structural.
AnalyticsCreator BARC KPI pattern: 2019–2024
The table shows AnalyticsCreator moving from engineering efficiency and governance strength toward broader business and operational recognition. The shift becomes especially clear in 2024.
| KPI | 2019 (DM19) | 2022 (DM22) | 2023 (DM23) | 2024 (DM24) |
|---|---|---|---|---|
| Business Value | - | - | - | T |
| Business Benefits | - | - | - | T |
| Time to Market | L | L | T | T |
| Development Efficiency | T | T | T | - |
| Maintenance Efficiency | T | - | - | - |
| Automation | - | T | T | - |
| Functionality | - | T | L | T |
| Customer Satisfaction | - | L | T | L |
| Connectivity | - | - | T | - |
| Technical Foundation | - | - | - | T |
| Deployment and Operations | - | - | - | T |
| Compliance | T | - | - | - |
| Data Governance | T | - | - | - |
| Skills Availability | T | - | - | - |
| Scalability | T | - | - | - |
Key takeaway: AnalyticsCreator’s 2019–2024 BARC pattern starts with development efficiency and governance, then expands into business value, technical foundation and deployment maturity.
2019: the engineering fundamentals
AnalyticsCreator’s first BARC appearance is mainly an engineering and governance story. The strongest signals appear in Development Efficiency, Maintenance Efficiency, Compliance, Data Governance, Skills Availability and Scalability.
That pattern fits the profile of a specialist data warehouse automation application. Early user recognition centres on the mechanics of delivery: making engineering work more repeatable, reducing maintenance effort and supporting governed development practices.
The commercial-outcome KPIs are not yet the main story. Business Value, Recommendation and Customer Satisfaction do not appear in the highlighted set. That is not unusual for a specialist application at this stage. It suggests that the first proof points were technical: does the application help teams build, govern and maintain analytics structures more effectively?
For AnalyticsCreator, the answer in 2019 was strongest around the engineering base. Metadata-driven design, model-based development and generated artifacts created the foundation for later results in automation, time to market and business value.
2022–2023: automation broadens the case
In 2022 and 2023, the BARC pattern broadens from development efficiency into automation and delivery speed. Automation joins Development Efficiency as a top-ranked KPI in both years.
This matters because development efficiency and automation are related but not identical. Development efficiency asks whether daily engineering work becomes more productive and maintainable. Automation asks whether the application reduces manual work by generating repeatable structures, code and processes from metadata.
Time to Market is the important movement in this period. It moves from leader position to top-ranked in 2023, which suggests that users increasingly associated AnalyticsCreator not only with efficient engineering, but also with faster delivery of analytics outcomes.
Connectivity and Customer Satisfaction also become top-ranked in 2023. That broadens the interpretation further. AnalyticsCreator is no longer being recognised only for the core generation engine. The results indicate stronger user confidence across a wider range of practical use cases.
What changed between 2022 and 2023?
The key change between 2022 and 2023 is that delivery strength becomes more visible as a user outcome. Development Efficiency and Automation remain strong, but Time to Market, Connectivity and Customer Satisfaction move the evidence closer to real project impact.
For buyers, this is an important distinction. A data warehouse automation application can look efficient in a product demonstration, but user-based survey results are more useful when they show that efficiency translating into faster delivery, stronger connectivity and higher satisfaction.
This is also where AnalyticsCreator’s Microsoft-centric fit becomes relevant. Teams working with SQL Server, Azure Data Factory, Azure Synapse Analytics, Microsoft Fabric and Power BI need automation that supports delivery without removing transparency or control. The Understanding AnalyticsCreator documentation explains how metadata, deployment and execution fit together in that workflow.
2024: the inflection point
2024 is the year the BARC pattern changes shape. AnalyticsCreator’s results move from a primarily engineering-efficiency narrative into a broader business-value and operational-maturity narrative.
Business Value and Business Benefits register as top-ranked for the first time. So do Technical Foundation and Deployment and Operations. This is an important shift because these KPIs speak to different buyer concerns.
Business Value and Business Benefits matter to executives and data leaders who need to justify investment. Technical Foundation matters to architects who need confidence in reliability, performance, connectivity and extensibility. Deployment and Operations matter to teams that must run controlled releases, manage change and support analytics delivery beyond the first project.
AnalyticsCreator’s own DM24 write-up reports 18 top rankings and 7 leading positions across the full KPI set. The highlighted areas include Business Benefits, Project Length, Business Value, Time to Market, Functionality, Deployment and Operations, User Experience, Platform Reliability, Extensibility, Technical Foundation, Competitive Win Rate and Competitiveness.
Key takeaway: The 2024 BARC results reposition AnalyticsCreator from an automation-efficiency story toward a governed-delivery story with stronger business and operational evidence.
Why Development Efficiency and Automation drop out of the 2024 highlighted set
The absence of Development Efficiency and Automation from the 2024 highlighted set should not be read as a decline on its own. Survey structures, peer groups and highlighted KPI clusters can change from year to year.
The more useful interpretation is to look at where the emphasis moves. In 2024, the highlighted strength shifts toward business outcomes and operational maturity: Business Value, Business Benefits, Technical Foundation, Deployment and Operations, Platform Reliability and related KPIs.
That shift is strategically important. For data leaders, automation is not the final objective. The objective is faster, more maintainable and better governed analytics delivery. Automation is the mechanism; business value and operational confidence are the outcomes.
What the 2019–2024 pattern says about AnalyticsCreator
The 2019–2024 pattern suggests that AnalyticsCreator’s recognised strengths became broader over time. The early evidence is technical. The later evidence connects technical capability to business and operational outcomes.
For evaluation teams, this creates a more practical view of the application:
- For data engineers: the early rankings point to repeatable development, reduced manual work and maintainable generated artifacts.
- For data architects: the later rankings point to stronger technical foundation, connectivity and deployment confidence.
- For data leaders: the 2024 rankings connect the technical case to business value, business benefits and time to market.
- For partners: the pattern supports a delivery model based on repeatable project execution rather than one-off manual builds.
This is why the 2019–2024 story matters. It does not present AnalyticsCreator as a general-purpose data management application. It shows a metadata-driven design application building credibility from engineering automation toward governed, business-relevant analytics delivery.
How this connects to AnalyticsCreator capabilities
The BARC pattern is easiest to understand when connected to the capabilities behind it. AnalyticsCreator supports visual modeling, generated SQL and pipelines, lineage visualization, reusable generated artifacts, historization patterns and deployment into Microsoft-focused data environments.
Those capabilities help explain why development efficiency and automation appear early in the series. They also help explain why technical foundation and deployment operations become more visible later. Once automation is established, buyers begin to ask whether the approach is maintainable, governable and suitable for controlled delivery.
For more detail on the capability set, review the AnalyticsCreator features overview. For a deeper explanation of the workflow, read Understanding AnalyticsCreator.
Why this matters before the 2025 comparison
The 2024 inflection point sets up the main question for 2025. If the business-value and technical-foundation strengths are real rather than a one-year artefact, they should remain visible when AnalyticsCreator is assessed in another peer-group context.
That is what Part 3 examines. In 2025, AnalyticsCreator is scored in two peer groups at once: the traditional Data Warehouse Automation category and the newer Data Product Engineering category. The question is whether the 2024 gains hold up when the comparison frame changes.
Where to explore the source data
For the full DM24 breakdown before reading Part 3, download the AnalyticsCreator BARC Data Management Survey 24 highlights or read the AnalyticsCreator DM24 results write-up. You can also explore the AnalyticsCreator resources page for related analyst reports, product materials and technical content.
Previous and next in this series
Previous: Part 1 explains why BARC rankings matter and how to read them.
Next: Part 3 covers 2025, the year AnalyticsCreator is scored in two peer groups at once. The next article examines whether the 2024 business-value and technical-foundation gains hold up across both Data Warehouse Automation and Data Product Engineering.
Continue the evaluation
To assess whether AnalyticsCreator fits your Microsoft data and analytics environment, review the AnalyticsCreator functions and features or request a demo or pricing discussion.
Frequently Asked Questions
What changed in AnalyticsCreator’s BARC results between 2019 and 2024?
AnalyticsCreator’s results evolved from early top rankings in development efficiency, maintenance efficiency and governance into broader recognition for business value, business benefits, technical foundation and deployment operations.
Why were the 2019 results important?
The 2019 results established AnalyticsCreator’s engineering foundation. Top rankings in areas such as Development Efficiency, Maintenance Efficiency, Compliance and Data Governance showed early strength in repeatable, governed data warehouse automation.
Why is 2024 described as an inflection point?
2024 is an inflection point because AnalyticsCreator’s highlighted BARC results expanded into Business Value, Business Benefits, Technical Foundation and Deployment and Operations. These KPIs connect automation to business outcomes and operational maturity.
Did Development Efficiency and Automation get worse in 2024?
Not necessarily. Their absence from the highlighted 2024 set should not be read as a decline on its own. BARC survey structures and highlighted KPI clusters can change between editions.
What does the 2019–2024 pattern mean for buyers?
The pattern suggests that AnalyticsCreator’s recognised strengths broadened over time. Buyers can read the results as evidence of development efficiency, automation, governance, technical confidence and business value across multiple survey years.